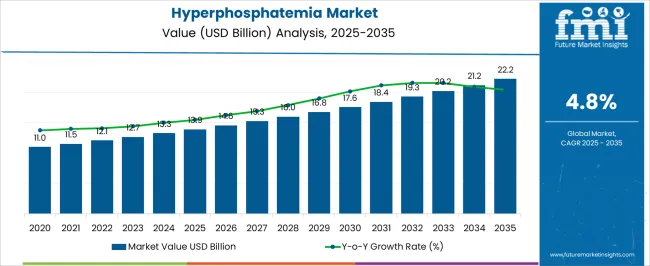
The Hyperphosphatemia Market is estimated to be valued at USD 13.9 billion in 2025 and is projected to reach USD 22.2 billion by 2035, registering a compound annual growth rate (CAGR) of 4.8% over the forecast period.
| Metric | Value |
|---|---|
| Hyperphosphatemia Market Estimated Value in (2025 E) | USD 13.9 billion |
| Hyperphosphatemia Market Forecast Value in (2035 F) | USD 22.2 billion |
| Forecast CAGR (2025 to 2035) | 4.8% |
The Hyperphosphatemia market is experiencing consistent growth, driven by the increasing prevalence of chronic kidney disease and associated metabolic disorders. The current market landscape is shaped by heightened clinical focus on managing elevated phosphate levels in patients undergoing dialysis and those with advanced renal impairment. Hospitals and healthcare systems have adopted more structured screening protocols and therapeutic guidelines, as observed in nephrology journals, clinical updates, and pharmaceutical company communications.
The future outlook remains optimistic, supported by advancements in diagnostic technologies and therapeutic options targeting phosphate regulation. Regulatory initiatives promoting early diagnosis, along with broader access to renal care, are expected to fuel continued expansion. Furthermore, as patient awareness and physician education increase, adherence to phosphate management regimens is improving.
Drug innovation pipelines, particularly in phosphate-binding compounds and more accurate biochemical assays, are also expected to support market evolution These factors collectively provide a strong foundation for sustainable market performance in both developed and emerging regions.
The market is segmented by Drug Class, Test Type, and End User and region. By Drug Class, the market is divided into Calcium Based Phosphate Binders, Iron Based Phosphate Binders, Lanthanum Carbonate, and Non-Phosphate Binders. In terms of Test Type, the market is classified into Phosphate Level Test, Low Serum Calcium Level Test, Blood Urea Nitrogen Test, and Creatinine Value Test. Based on End User, the market is segmented into Hospitals, Ambulatory Surgical Centers, Specialty Clinics, and Others. Regionally, the market is classified into North America, Latin America, Western Europe, Eastern Europe, Balkan & Baltic Countries, Russia & Belarus, Central Asia, East Asia, South Asia & Pacific, and the Middle East & Africa.
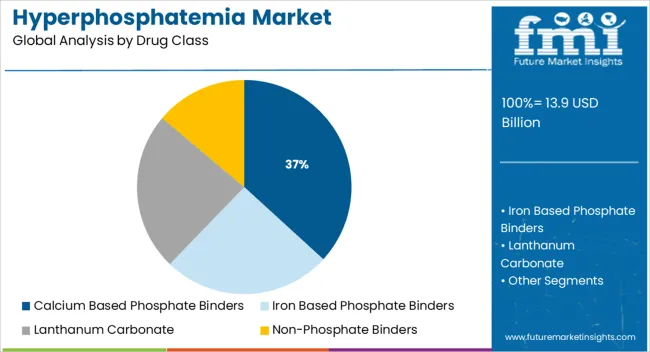
The calcium based phosphate binders segment is projected to account for 36.8% of the Hyperphosphatemia market revenue share in 2025, making it the leading drug class segment. This dominance is being supported by the long-established use of calcium compounds in controlling serum phosphate levels in patients with chronic kidney disease. As outlined in clinical guidelines and pharmaceutical product literature, these binders are often prescribed as first-line therapies due to their affordability and proven efficacy.
Healthcare providers have favored them due to the dual benefit of phosphate control and calcium supplementation. Additionally, widespread availability, broad formulary inclusion, and inclusion in clinical care pathways have reinforced their adoption.
The segment’s strength is further underpinned by familiarity among nephrologists, established safety profiles, and minimal complexity in dosing These factors have continued to ensure sustained preference for calcium based binders in both outpatient and hospital settings, particularly where cost constraints and accessibility remain important considerations.
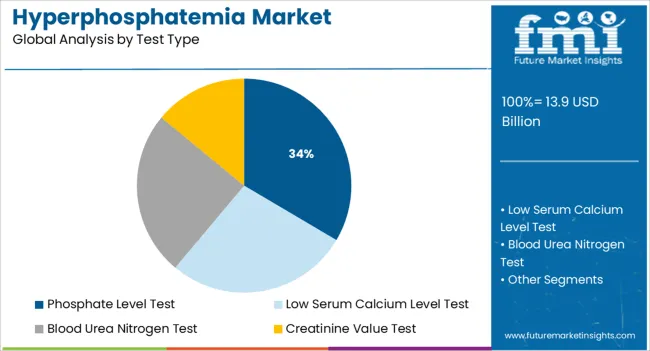
The phosphate level test segment is expected to represent 33.5% of the Hyperphosphatemia market revenue share in 2025, making it the leading test type. The segment’s growth is being driven by the critical need for timely diagnosis and monitoring of serum phosphate concentrations, particularly in patients with kidney disease and metabolic disorders. Diagnostic protocols outlined in nephrology clinical practices emphasize the importance of routine phosphate screening in managing hyperphosphatemia, which has increased test volumes across care settings.
Hospitals and dialysis centers have standardized the use of phosphate level tests to guide treatment adjustments and monitor therapeutic efficacy. The accessibility, cost-efficiency, and quick turnaround of these tests have also contributed to their widespread adoption.
Furthermore, the integration of these assays into broader renal function panels has enhanced their clinical utility As early detection remains central to phosphate management, this test type continues to dominate the diagnostic landscape, driven by its established role in chronic disease monitoring.
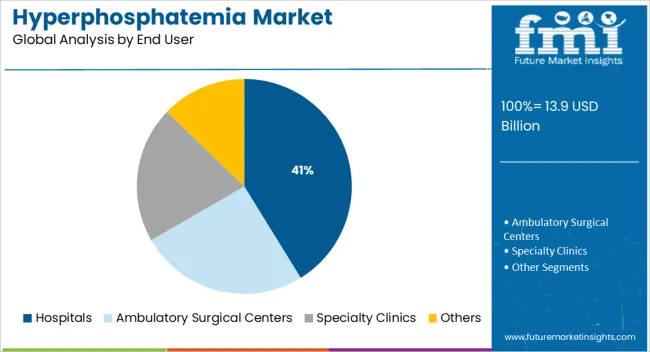
The hospitals segment is forecasted to hold 41.2% of the Hyperphosphatemia market revenue share in 2025, establishing it as the leading end user segment. The segment’s growth is being supported by the rising number of hospital admissions related to chronic kidney disease and associated complications. Hospitals are increasingly equipped with specialized nephrology departments and dialysis units, making them primary centers for the diagnosis, monitoring, and treatment of hyperphosphatemia.
Clinical protocols implemented across hospitals emphasize regular phosphate testing and timely intervention using drug therapies, which has increased the volume of in-patient management. Moreover, institutional preference for evidence-based treatment regimens and structured follow-up care has enhanced the use of standardized drug classes and diagnostic tools.
Hospitals also serve as key hubs for early-stage diagnosis, patient education, and long-term management, particularly for high-risk populations These factors, combined with high patient throughput and access to multidisciplinary care, have reinforced the hospital segment’s position as the primary end use setting in 2025.
According to Fact.MR, hyperphosphatemia sales grew at a CAGR of 4% in the historical period 2020 to 2025. During the forecast period, the demand for emerging therapies will also be fueled by the expected launch of novel treatments and pharmaceutical companies' research and development activities. Proactively pursuing reimbursement during late development and after launch can have a beneficial effect.
Phosphate-binder treatment has made recent advances. As a result of hypercalcemia, sevelamer, and lanthanum are effective in the prevention of cardiovascular mortality. Some patients may benefit from the newly approved iron-based products, but there's no data on long-term safety. For pharmacists to optimize hyperphosphatemia therapy, knowing these new treatments is crucial as essential members of the care team.
Globally, chronic kidney diseases are becoming more prevalent, resulting in significant growth in new drug development and therapeutics. In recent years, new therapies have been conceptualized based on new mechanistic understandings of phosphorus absorption. Accordingly, the market for hyperphosphatemia treatment is projected to grow at a CAGR of 4.8% between 2025 and 2035.
A Growing Number of Health Conditions will drive Hyperphosphatemia Market Demand
The growing prevalence of chronic diseases and the growing geriatric population are expected to drive the market demand for hyperphosphatemia treatments. As Chronic Kidney Disease (CKD) and End-Stage Renal Disease (ESRD) patients become more prevalent, the market will witness a surge in investment and development of newer mechanisms of action.
As the FDA and other government funding bodies continue to grow in the coming years, it is expected that the market will continue to grow. With the increase in Research and Development funding and the development of biotechnology advancements and studies, the market for hyperphosphatemia is expected to grow in the upcoming years. The market for hyperphosphatemia diagnosis and drug treatments is expected to grow further due to the growing number of anemic women in emerging countries and anemic conditions in children.
Insights into the Future of Hyperphosphatemia Markets
Researchers have investigated a number of hyperphosphatemia treatment approaches to reduce its burden. Various treatments for hyperphosphatemia that lower phosphate levels have been demonstrated to be successful in controlling and preventing hyperphosphatemia through the use of these strategies.
With the launch of more drugs in developing economies, the hyperphosphatemia treatment market is expected to witness significant growth in the near future. For instance, Vifor Fresenius Medical Care Renal Pharma (VFMCRP) revealed that Velphoro (PA21) lowered serum phosphorus in CKD dialysis patients in April 2024.
Furthermore, studies also showed using Raman spectroscopy and attenuated total reflectance Fourier transform infrared spectroscopy, the researchers confirmed the formation of noncovalent hydrogen bonds in the hetero synthon. For instance, Sanofi-Aventis Korea announced in March that it had entered into a joint marketing and sales agreement with Handok for the latter's hyperphosphatemia treatment Renvela.
Phosphate levels that are too high can cause serious health conditions if left untreated. Among them are diabetes and kidney disease. A treatment program may be needed to prevent this condition from developing. The market for hyperphosphatemia is expected to grow at a brisk pace, but there are a few factors that may hinder its growth, including a poor understanding of what phosphate levels are in food products and the lack of data on how phosphates are managed, a significant cost, and increased competition within the industry make it difficult to manage them.
Moreover, the stricter regulations imposed by the regulatory agencies will further impede the sales of hyperphosphatemia drugs, which will further dampen the demand for these drugs. A rise in side effects associated with drugs and the high cost of diagnosis is expected to hamper the growth of this industry.
New Entrants Lead to Improvement in Hyperphosphatemia
With technological advancements in the hyperphosphatemia field, new companies are entering the market and gaining a competitive edge. In order to stay ahead of changing consumer preferences, these companies continually invest in research and development. By advancing the market, the company aims to improve its position in the hyperphosphatemia market.
Shield Therapeutics: Pharmaceutical company that develops products to treat iron deficiency anemia and hyperphosphatemia. The company's lead product is Feraccru, an oral therapy that is stable and non-salt-based to treat iron deficiency in adults. Aside from PT20, the company also has PT30 to provide hypoallergenic IV iron therapy, and PT40 to make a generic version of iron sucrose, which may be used to treat patients with hyperphosphatemia due to dialysis or chronic kidney disease.
Alebund: Manufacturer of kidney therapeutics. Lead candidates include AP-301 which is being evaluated for the treatment of hyperphosphatemia, AP-303, which is for the treatment of diabetic kidney disease, AP-304, which is being evaluated for the treatment of autosomal dominant polycystic kidney disease, and AP-305, which is an antibody against the enzyme in the complement system lectin pathway for the treatment of IgA nephropathy.
Llypsa: Develops compounds to bind phosphates and potassium for the treatment of chronic kidney diseases. One of the company’s lead drug candidates, ILY101, prevents hyperphosphatemia, a condition characterized by high levels of phosphorus in the blood. A phosphorus-binding compound, ILY101, prevents the body from absorbing phosphorus. As well as potassium and sodium binders, Ilypsa has other candidates in its pipeline.
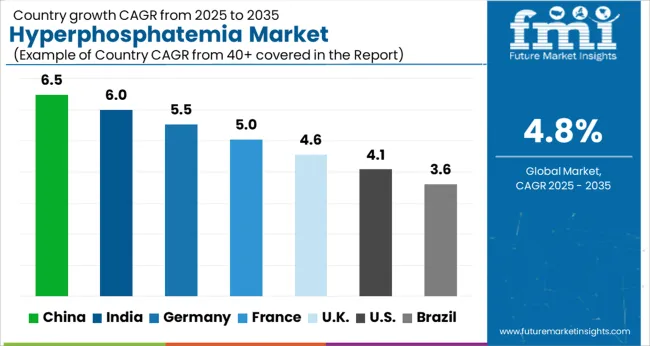
Increased Advances in Drugs, along with Investments to propel Market Expansion
According to the forecast, North American sales will account for 36% of the overall demand in the forthcoming decade. In North America, hyperphosphatemia diagnosis investments are rising, which will lead to market dominance. Health awareness and the availability of modern diagnostic facilities have made the United States the dominant market in North America.
North America is by far the global market leader in terms of medications for hyperphosphatemia, both in terms of income and in terms of the number of patients. Among the North American population, hyperphosphatemia therapeutics are growing at an accelerating rate as diabetes, osteoporosis, and a variety of chronic renal diseases are on the rise. Chronic kidney disease (CKD) affects about 15% of American adults, and 1 in 3 are at risk. There are approximately 560,000 dialysis patients in the United States. The burden of chronic kidney disease and end-stage renal disease is disproportionately higher for minorities; the likelihood that Black Americans require dialysis is 4 times higher than that of White Americans.
Moreover, the rising prevalence of hyperphosphatemia as well as the development of osteoporosis and a variety of chronic kidney diseases are driving the growth of the market for hyperphosphatemia therapeutic drugs in North America. A recent study by Block et al concluded that despite attempts made by patients, dietitians, and nephrologists to reach 5.5 mg/dL as the recommended goal for serum phosphorus, approximately 60% of American patients on hemodialysis have phosphorus levels above this goal.
Pharmaceuticals will Dominate the Emerging Markets Hyperphosphatemia Market
Estimates indicate that Asia Pacific will dominate the global market. Globally, this region generates 32% of the revenues generated worldwide, making up a substantial portion of global revenues. Asia-Pacific is experiencing the fastest market growth. In the Asia-Pacific region, China is expected to be the biggest market, both in revenue and size. With China's central government's robust growth initiatives, it is expected that the country's healthcare infrastructure will increase the demand for hyperphosphatemia medications.
As the FDA approves more of these drugs, and dialysis services increase in major countries, phosphate binders in the region are in greater demand. Emerging countries, such as China, India, and Brazil, are distinguished from developed countries by the prevalence of calcium-based phosphate binders in prescriptions, and the significant increase in dialysis patients in Asia Pacific, as well as a significant increase in the number of dialysis patients, are expected to boost demand during the period 2025 to 2035.
Due to the increasing aging population, the increasing osteoporosis cases, and changes in dietary habits, the Asia-Pacific market is set to grow at an increasing rate. Hyperphosphatemia drugs are being increasingly used in Asia-Pacific as a consequence of the increasing number of osteoporosis cases and this is the biggest factor driving the market for these drugs.
Iron Based Phosphate Binder Growth will be Fueled by New Clinical Trials
Based on drug class the market is segmented into calcium-based phosphate binders, iron-based phosphate binders, lanthanum carbonate, and non-phosphate binders. According to Future Market Insights, iron-based phosphate binders will continue to dominate the market throughout the forecast period. Approximately 20% of all medical treatments are based on iron-based phosphate binders.
New classes of phosphate binders are based on iron. Clinical trials have been conducted on various iron-based phosphate binders. Two iron-based binders have been approved for clinical use in the United States after being found to be safe and effective in lowering serum phosphate levels: ferric citrate (JTT-751) and sucroferric oxyhydroxide (PA21). In comparison to sucroferric oxyhydroxide, ferric citrate absorbs iron partially.
In order to grow the market for hyperphosphatemia in dialysis patients, growing awareness about phosphorus levels is expected to drive the market. For instance, a new study has found that ferric citrate improved biomarkers of hyperphosphatemia and anemia in patients treated with ferric citrate after clinical trials have granted approval. In comparison with calcium-based binders or sevelamer salts, both of these agents are effective in reducing serum phosphorus levels. A number of factors need to be explored in order to determine their optimal place in therapy, including pill burden, adverse effects on the gastrointestinal system, potential cost reduction strategies for anemia therapies, and the physiological effects of long-term exposure to iron.
The low serum calcium level test is expected to represent 8% of the market at the end of the evaluation period with a CAGR of 3% during the forecast period. As the population ages and calcium levels decrease, the market for low serum calcium level tests is expected to grow as a result of this. Low serum calcium level tests will continue to grow in the market as an increasing number of pregnant women, as well as an increase in bone diseases, is expected to increase market demand for low serum calcium level tests.
A growing number of home-based tests and a growing demand for at-home test kits in the market is expected to lead to a growth in the low serum calcium level test market next year. In addition to this, the growing prevalence of kidney disease and thyroid disease is expected to further contribute to the growth of the market for low serum calcium level tests. As industry advancements continue to grow and more and more customers demand quick test results and more accurate devices, the market is expected to continue growing.
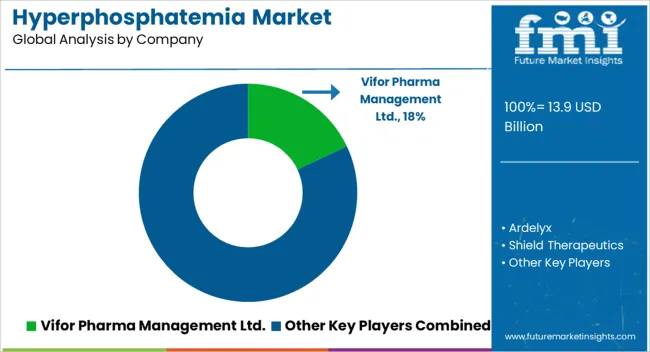
Several domestic and regional players are involved in the hyperphosphatemia market, which is highly fragmented and competitive. Hyperphosphatemia's major market players are investing in Research and Development to learn more about treatment options and determine their accuracy.
The global hyperphosphatemia market is estimated to be valued at USD 13.9 billion in 2025.
The market size for the hyperphosphatemia market is projected to reach USD 22.2 billion by 2035.
The hyperphosphatemia market is expected to grow at a 4.8% CAGR between 2025 and 2035.
The key product types in hyperphosphatemia market are calcium based phosphate binders, iron based phosphate binders, lanthanum carbonate and non-phosphate binders.
In terms of test type, phosphate level test segment to command 33.5% share in the hyperphosphatemia market in 2025.


Full Research Suite comprises of:
Market outlook & trends analysis
Interviews & case studies
Strategic recommendations
Vendor profiles & capabilities analysis
5-year forecasts
8 regions and 60+ country-level data splits
Market segment data splits
12 months of continuous data updates
DELIVERED AS:
PDF EXCEL ONLINE

Thank you!
You will receive an email from our Business Development Manager. Please be sure to check your SPAM/JUNK folder too.
Chat With
MaRIA