Inositol Market Size and Share Forecast Outlook 2025 to 2035

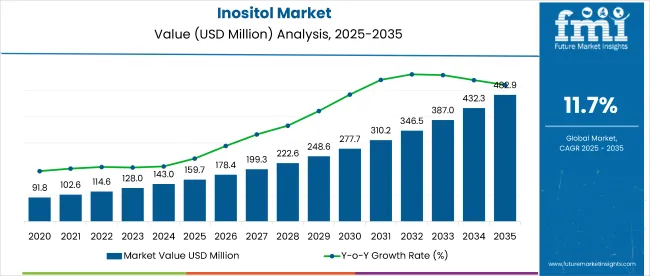
The global inositol market is valued at USD 159.7 million in 2025 and is expected to reach USD 482.9 million by 2035, reflecting a CAGR of 11.7%. Market expansion is driven by increased demand for inositol-based supplements, especially for managing PCOS, diabetes, and neurological health.
Quick Stats for Inositol Market

  • Market Value (2025): USD 159.7 million
  • Forecast Value (2035): USD 482.9 million
  • Forecast CAGR: 11.7%
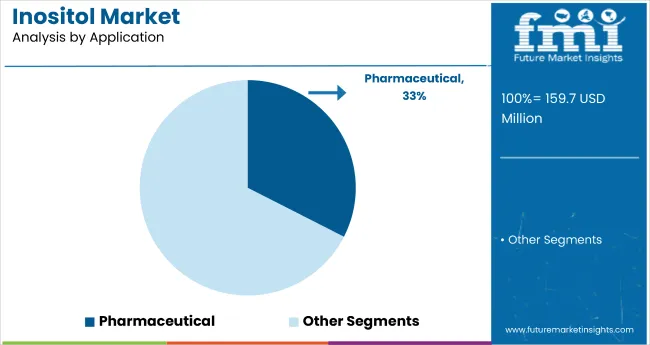
  • Application Leader in 2025: Pharmaceuticals (33% Market Share)
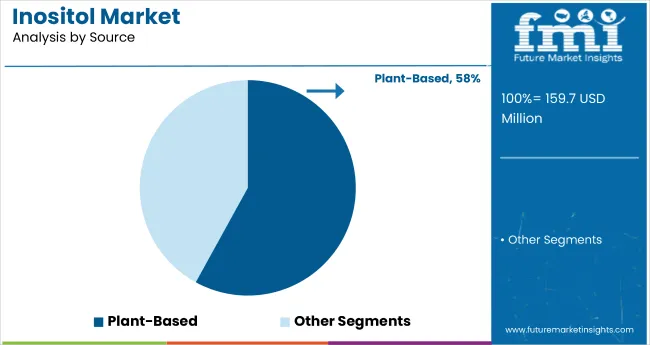
  • Top Source Segment: Plant-Based (58% Market Share in 2025)
  • Key Growth Region: East Asia (Japan is the fastest growing at 10.5% CAGR)

Inositol Market

Metric Value
Market Size (2025) USD 159.7 million
Market Size (2035) USD 482.9 million
CAGR (2025 to 2035) 11.7%

The market is also expected to benefit from technological advancements that enhance the bioavailability and efficacy of inositol supplements.The inositol market holds approximately 6.1% of the global pharmaceuticals market and around 4.9% of the dietary supplements market, reflecting its growing importance in therapeutic and metabolic health applications.

Within the food and beverage sector, its share stands at roughly 1.8%, supported by increasing demand for functional ingredients in wellness-oriented products. In the cosmetics and personal care space, inositol accounts for about 0.9%, while in animal feed, it contributes approximately 0.6%.

Government regulations impacting the market focus on the safety, efficacy, and labeling of nutraceutical and pharmaceutical products containing inositol. Stricter compliance standards for dietary supplements and functional ingredients are encouraging manufacturers to invest in clinical research and product transparency.

Moreover, governments in Asia are actively supporting the use of plant-based compounds in therapeutic applications, which is likely to boost inositol adoption across both preventive and clinical healthcare sectors.

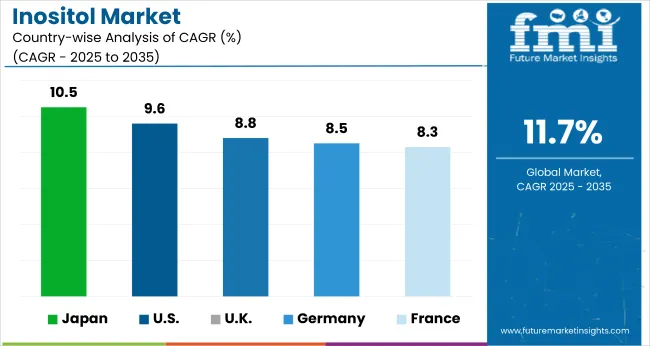
Japan is projected to be the fastest-growing market at a CAGR of 10.5% from 2025 to 2035, driven by its aging population and increasing demand for nutraceuticals and pharmaceutical-grade supplements.

Pharmaceutical will lead the application segment with a 33% market share in 2025, while, plant-based will lead the source segment with a 58% share.The USA and the UK markets are expected to grow at CAGRs of 9.6% and 8.8%, respectively.

Analyzing Inositol Market by Top Investment Segments

The inositol market is segmented into source type, application, and region. By source type, the market comprises plant-based and synthetic inositol. Based on application, the market is categorized into dietary supplements, beverages, feed industry, pharmaceutical industry, and other applications. Regionally, the market is classified into North America, Latin America, Western Europe, Eastern Europe, Balkans & Baltic, Russia & Belarus, Central Asia, East Asia, South Asia & Pacific, Middle East & Africa.
Plant-Based to Dominate the Source Segment with 58% Market Share in 2025

Inositol Market Analysis By Source

Plant-based is projected to lead the source segment, accounting for approximately 58% global market share in2025. Growth is driven by the increasing global shift toward natural, clean-label, and sustainable ingredients. Consumers are becoming more health-conscious and are seeking alternatives to synthetic compounds, particularly in the pharmaceutical, nutraceutical, and functional food industries.
  • The shift toward natural, clean-label, and sustainable ingredients is driving demand for plant-based inositol, especially in pharmaceutical, nutraceutical, and functional food sectors.
  • Consumers favor plant-derived inositol for its safety, minimal side effects, and suitability for vegetarian and vegan formulations.
  • Regulatory support for botanical and plant-based bioactives in major markets is reinforcing the adoption of plant-based sources.
  • Technological advancements and increased production capacity are enhancing the scalability and cost-efficiency of plant-based inositol.

Pharmaceutical Industry to Lead Application Segment With 33% in 2025

Inositol Market Analysis By Application

Pharmaceutical is expected to lead the application segment, accounting for 33% of the global market share in 2025. Growth is driven by the increasing utilization of inositol in the treatment of metabolic disorders such as diabetes, neurological conditions including anxiety and depression, and reproductive health issues like polycystic ovary syndrome (PCOS).

  • The growing prevalence of these health conditions worldwide is increasing the demand for effective and natural therapeutic agents. Significant investments in research and development are facilitating the discovery of new applications for inositol in drug formulations, thereby expanding its pharmaceutical use.
  • The dietary supplements segment is gaining momentum as consumers, especially millennials and older adults, prioritize preventive healthcare, mental wellness, and natural supplement use.

Top Inositol Market Dynamics

The global inositol market is growing steadily, driven by increasing demand for natural and plant-based supplements, rising awareness of metabolic and neurological health benefits, and advancements in pharmaceutical and nutraceutical formulations. Growth is further supported by expanding applications in dietary supplements, functional beverages, and treatments for conditions such as PCOS and diabetes.

Recent Trends in the Inositol Market

  • Rising demand for plant-based and natural inositol supplements is driving market growth.
  • The increasing prevalence of metabolic and neurological disorders is boosting pharmaceutical applications.
  • Growing consumer preference for preventive healthcare and mental wellness supports dietary supplement sales.
  • Advances in extraction and production technologies are improving inositol availability and cost-efficiency.
  • Expansion of e-commerce and digital health platforms is enhancing product accessibility globally.

Challenges in the Inositol Market

  • High production costs of plant-based inositol limit affordability in some regions.
  • Strict regulatory requirements for dietary supplements can delay product launches.
  • Side effects associated with excessive inositol consumption may hinder market acceptance.
  • Competition from synthetic alternatives offering lower price points affects market share.
  • Limited awareness in emerging markets restricts consumer adoption and growth potential.

Top Countries Supplying and Consuming Inositol Products

Country Wise Analysis Of Inositol Market

Japan leads the inositol market, driven by its aging population and a strong focus on healthcare innovation. The USA follows closely with a 9.6% CAGR, supported by advancements in dietary supplements and expanding e-commerce channels.

The UK is expected to grow at 8.8% CAGR, fueled by increasing mental health awareness and supplement adoption. Germany maintains steady growth at 8.5%, backed by stringent regulations and chronic disease management. France, with an 8.3% CAGR, benefits from rising demand for natural, plant-based, and organic health supplements.

The report covers an in-depth analysis of 40+ countries; with the five top-performing OECD nations highlighted below. 
In-depth Analysis of Inositol in the USA

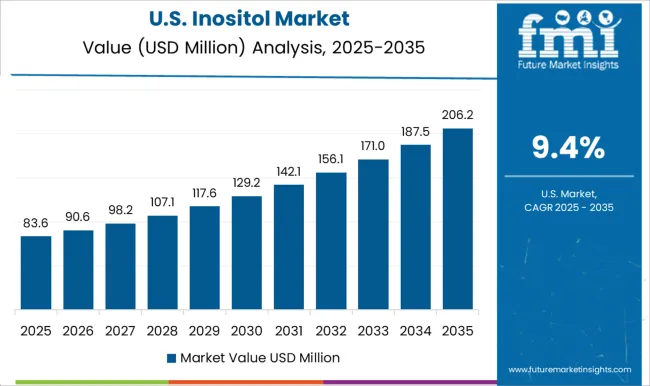
The USA inositol market is projected to grow at a CAGR of 9.6% from 2025 to 2035, driven by increasing consumer demand for dietary supplements and pharmaceutical products addressing metabolic and neurological disorders. The country benefits from advanced healthcare infrastructure and strong R&D investments, supporting innovation in inositol-based formulations.

  • Growing awareness of preventive health and wellness among consumers.
  • Strong regulatory framework encouraging supplement safety and efficacy.
  • Expansion of e-commerce platforms is boosting product accessibility.
  • High adoption of plant-based and clean-label supplements.
  • Leading companies such as DSM NV and OmniBiotics are investing heavily in innovation.

Growth Outlook for Inositol Products in the UK

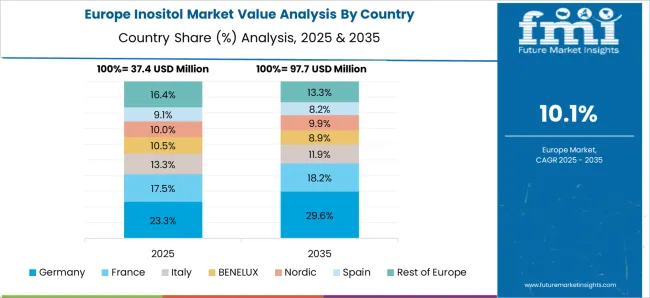
The sales of inositol products are expanding at a CAGR of 8.8% over the forecast period. Growth is driven by rising focus on mental health and preventive care among the population is driving demand for inositol supplements. Their calming effects, metabolic support, and clean-label compatibility make them ideal for inclusion in dietary supplements, functional foods, and wellness-focused pharmaceutical products.
  • Increasing consumer preference for natural and plant-based products.
  • Supportive policies for nutraceutical and pharmaceutical innovations.
  • Growth in online retailing and specialty health stores.
  • Rising awareness of PCOS and metabolic health issues.
  • Key players investing in research and product development.

Demand Trajectory of Inositol in Germany

The demand for inositol in Germany is projected to grow at a CAGR of 8.5% from 2025 to 2035, fueled by a mature healthcare system and strong consumer interest in dietary supplements. The country has strict regulatory standards, which ensure high-quality product offerings and drive demand for clinically proven inositol formulations.

  • High demand for pharmaceutical-grade inositol products.
  • Increasing focus on chronic disease management through supplements.
  • Well-established distribution networks including pharmacies and health stores.
  • Growing interest in preventive health and aging population care.
  • Major market players focusing on compliance and innovation.

Analysis of Inositol in France

The inositol market in France is projected to grow at a CAGR of 8.3% during the forecast period, supported by growing health consciousness and increasing use of dietary supplements for metabolic and neurological health. The market is benefiting from strong government campaigns promoting natural health products and functional foods.

  • Rising consumption of plant-based and organic supplements.
  • Expansion of modern retail and e-commerce channels.
  • Growing demand for mental health support supplements.
  • Increasing awareness of inositol benefits for reproductive health.
  • Presence of innovative supplement manufacturers driving growth.

Inositol Trends in Japan

The inositol market in Japan is projected to grow at a CAGR of 10.5% from 2025 to 2035. Growth is driven by a and advanced healthcare system support pharmaceutical and dietary supplement applications. Their proven role in supporting cognitive function, emotional balance, and metabolic health makes inositol products ideal for inclusion in aging care, brain health supplements, and functional nutrition formulas.
  • High adoption of nutraceuticals for aging-related health issues.
  • Government support for functional food and supplement industries.
  • Increasing consumer interest in natural health solutions.
  • Robust pharmaceutical research and clinical studies on inositol.

Leading Inositol Manufacturers and Suppliers

Inositol Market Analysis By Company

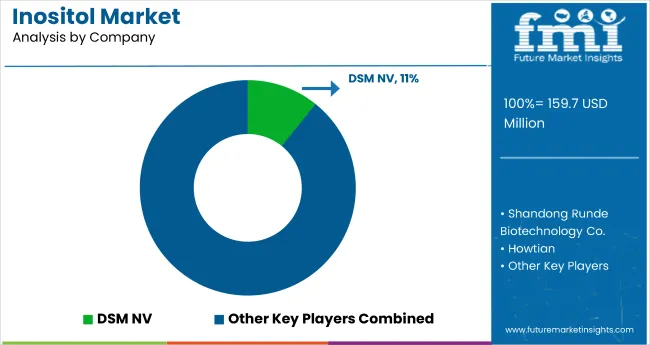
The global inositol market is moderately fragmented, with several key players competing through innovation, strategic partnerships, pricing strategies, and geographic expansion. Leading companies such as DSM NV, Charles Bowman & Company, T.J. Clark & Company, Shandong Runde Biotechnology, and How tian are focusing on expanding their product portfolios and investing in R&D to develop advanced inositol formulations targeting pharmaceutical, dietary supplement, and functional food applications. These companies also leverage partnerships and acquisitions to enhance distribution networks and broaden their global footprint, particularly in high-growth markets such as Asia-Pacific and North America.

Competitive strategies among top suppliers include developing plant-based and clean-label inositol products to meet the rising consumer demand for natural ingredients. Pricing competitiveness remains crucial as synthetic alternatives often challenge market share, prompting leading firms to emphasize product quality and certifications.

Expansion into emerging markets through localized manufacturing and stronger supply chain integration also forms a core part of the growth strategy. In addition, ongoing collaborations with healthcare providers and nutraceutical companies support product innovation tailored to therapeutic needs.

Inositol Market Report Scope

Report Attributes Details
Current Total Market Size (2025) USD 159.7 million
Projected Market Size (2035) USD 482.9 million
CAGR (2025 to 2035) 11.7%
Base Year for Estimation 2025
Historical Period 2020 to 2024
Projections Period 2025 to 2035
Market Analysis Parameters Revenue in USD million/Volume in metric tons
By Source Plant-Based and Synthetic
By Application Dietary Supplements, Beverages, Feed Industry, Pharmaceutical Industry, and Other Applications
Regions Covered North America, Latin America, Western Europe, Eastern Europe, Balkans & Baltic, Russia & Belarus, Central Asia, East Asia, South Asia & Pacific, Middle East & Africa
Countries Covered United States, Canada, United Kingdom, Germany, France, China, Japan, South Korea, Brazil, Australia, +40 countries 
Key Players DSM NV, Charles Bowman & Company, T.J. Clark & Company, Shandong Runde Biotechnology Co., Howtian, Biological E Ltd., Ronas Chemicals, Holland & Barrett, Phoenix Herb, and Asiamerica Group, Inc.
Additional Attributes Dollar sales by product type, share by functionality, regional demand growth, regulatory influence, clean-label trends, competitive benchmarking

Key Segmentation

By Source:

  • Plant Based Inositol
  • Synthetic Inositol

By Application:

  • Based Dietary Supplements
  • Beverages
  • Feed Industry
  • Pharmaceutical Industry
  • Other Applications of Inositol

By Region:

  • North America
  • Latin America
  • Europe
  • Asia Pacific
  • Middle East & Africa

Table of Content

  1. Executive Summary
    • Global Market Outlook
    • Demand-side Trends
    • Supply-side Trends
    • Technology Roadmap Analysis
    • Analysis and Recommendations
  2. Market Overview
    • Market Coverage/Taxonomy
    • Market Definition/Scope/Limitations
  3. Market Background
    • Market Dynamics
      • Drivers
      • Restraints
      • Opportunity
      • Trends
    • Scenario Forecast
      • Demand in Optimistic Scenario
      • Demand in Likely Scenario
      • Demand in Conservative Scenario
    • Opportunity Map Analysis
    • Product Life Cycle Analysis
    • Supply Chain Analysis
      • Supply Side Participants and their Roles
        • Producers
        • Mid-Level Participants (Traders/ Agents/ Brokers)
        • Wholesalers and Distributors
      • Value Added and Value Created at Node in the Supply Chain
      • List of Raw Material Suppliers
      • List of Existing and Potential Buyer’s
    • Investment Feasibility Matrix
    • Value Chain Analysis
      • Profit Margin Analysis
      • Wholesalers and Distributors
      • Retailers
    • PESTLE and Porter’s Analysis
    • Regulatory Landscape
      • By Key Regions
      • By Key Countries
    • Regional Parent Market Outlook
    • Production and Consumption Statistics
    • Import and Export Statistics
  4. Global Market Analysis 2020 to 2024 and Forecast, 2025 to 2035
    • Historical Market Size Value (USD Million) & Volume (Metric Tons) Analysis, 2020 to 2024
    • Current and Future Market Size Value (USD Million) & Volume (Metric Tons) Projections, 2025 to 2035
      • Y-o-Y Growth Trend Analysis
      • Absolute $ Opportunity Analysis
  5. Global Market Pricing Analysis 2020 to 2024 and Forecast 2025 to 2035
  6. Global Market Analysis 2020 to 2024 and Forecast 2025 to 2035, By Source
    • Introduction/Key Findings
    • Historical Market Size Value (USD Million) & Volume (Metric Tons) Analysis By Source, 2020 to 2024
    • Current and Future Market Size Value (USD Million) & Volume (Metric Tons) Analysis and Forecast By Source, 2025 to 2035
      • Plant Based
      • Synthetic
    • Y-o-Y Growth Trend Analysis By Source, 2020 to 2024
    • Absolute $ Opportunity Analysis By Source, 2025 to 2035
  7. Global Market Analysis 2020 to 2024 and Forecast 2025 to 2035, By Application
    • Introduction/Key Findings
    • Historical Market Size Value (USD Million) & Volume (Metric Tons) Analysis By Application, 2020 to 2024
    • Current and Future Market Size Value (USD Million) & Volume (Metric Tons) Analysis and Forecast By Application, 2025 to 2035
      • Based Dietary Supplements
      • Beverages
      • Feed Industry
      • Pharmaceutical Industry
      • Other Applications
        • Cosmetics & Personal Care
        • Infant Formula
        • Clinical Nutrition
        • Biotechnology & Fermentation
    • Y-o-Y Growth Trend Analysis By Application, 2020 to 2024
    • Absolute $ Opportunity Analysis By Application, 2025 to 2035
  8. Global Market Analysis 2020 to 2024 and Forecast 2025 to 2035, By Region
    • Introduction
    • Historical Market Size Value (USD Million) & Volume (Metric Tons) Analysis By Region, 2020 to 2024
    • Current Market Size Value (USD Million) & Volume (Metric Tons) Analysis and Forecast By Region, 2025 to 2035
      • North America
      • Latin America
      • Western Europe
      • Eastern Europe
      • East Asia
      • South Asia & Pacific
      • Middle East and Africa
    • Market Attractiveness Analysis By Region
  9. North America Market Analysis 2020 to 2024 and Forecast 2025 to 2035, By Country
    • Historical Market Size Value (USD Million) & Volume (Metric Tons) Trend Analysis By Market Taxonomy, 2020 to 2024
    • Market Size Value (USD Million) & Volume (Metric Tons) Forecast By Market Taxonomy, 2025 to 2035
      • By Country
        • USA
        • Canada
        • Mexico
      • By Source
      • By Application
    • Market Attractiveness Analysis
      • By Country
      • By Source
      • By Application
    • Key Takeaways
  10. Latin America Market Analysis 2020 to 2024 and Forecast 2025 to 2035, By Country
    • Historical Market Size Value (USD Million) & Volume (Metric Tons) Trend Analysis By Market Taxonomy, 2020 to 2024
    • Market Size Value (USD Million) & Volume (Metric Tons) Forecast By Market Taxonomy, 2025 to 2035
      • By Country
        • Brazil
        • Argentina
        • Rest of LATAM
      • By Source
      • By Application
    • Market Attractiveness Analysis
      • By Country
      • By Source
      • By Application
    • Key Takeaways
  11. Western Europe Market Analysis 2020 to 2024 and Forecast 2025 to 2035, By Country
    • Historical Market Size Value (USD Million) & Volume (Metric Tons) Trend Analysis By Market Taxonomy, 2020 to 2024
    • Market Size Value (USD Million) & Volume (Metric Tons) Forecast By Market Taxonomy, 2025 to 2035
      • By Country
        • Germany
        • Italy
        • France
        • UK
        • Spain
        • BENELUX
        • Nordic
        • Rest of W.Europe
      • By Source
      • By Application
    • Market Attractiveness Analysis
      • By Country
      • By Source
      • By Application
    • Key Takeaways
  12. Eastern Europe Market Analysis 2020 to 2024 and Forecast 2025 to 2035, By Country
    • Historical Market Size Value (USD Million) & Volume (Metric Tons) Trend Analysis By Market Taxonomy, 2020 to 2024
    • Market Size Value (USD Million) & Volume (Metric Tons) Forecast By Market Taxonomy, 2025 to 2035
      • By Country
        • Russia
        • Hungary
        • Poland
        • Balkan & Baltics
        • Rest of E. Europe
      • By Source
      • By Application
    • Market Attractiveness Analysis
      • By Country
      • By Source
      • By Application
    • Key Takeaways
  13. East Asia Market Analysis 2020 to 2024 and Forecast 2025 to 2035, By Country
    • Historical Market Size Value (USD Million) & Volume (Metric Tons) Trend Analysis By Market Taxonomy, 2020 to 2024
    • Market Size Value (USD Million) & Volume (Metric Tons) Forecast By Market Taxonomy, 2025 to 2035
      • By Country
        • China
        • Japan
        • South Korea
      • By Source
      • By Application
    • Market Attractiveness Analysis
      • By Country
      • By Source
      • By Application
    • Key Takeaways
  14. South Asia & Pacific Market Analysis 2020 to 2024 and Forecast 2025 to 2035, By Country
    • Historical Market Size Value (USD Million) & Volume (Metric Tons) Trend Analysis By Market Taxonomy, 2020 to 2024
    • Market Size Value (USD Million) & Volume (Metric Tons) Forecast By Market Taxonomy, 2025 to 2035
      • By Country
        • India
        • Australia & New Zealand
        • ASEAN
        • Rest of SAP
      • By Source
      • By Application
    • Market Attractiveness Analysis
      • By Country
      • By Source
      • By Application
    • Key Takeaways
  15. Middle East and Africa Market Analysis 2020 to 2024 and Forecast 2025 to 2035, By Country
    • Historical Market Size Value (USD Million) & Volume (Metric Tons) Trend Analysis By Market Taxonomy, 2020 to 2024
    • Market Size Value (USD Million) & Volume (Metric Tons) Forecast By Market Taxonomy, 2025 to 2035
      • By Country
        • GCC Countries
        • Northern Africa
        • South Africa
        • Turkiye
        • Rest of MEA
      • By Source
      • By Application
    • Market Attractiveness Analysis
      • By Country
      • By Source
      • By Application
    • Key Takeaways
  16. Key Countries Market Analysis
    • USA
      • Pricing Analysis
      • Market Share Analysis, 2024
        • By Source
        • By Application
    • Canada
      • Pricing Analysis
      • Market Share Analysis, 2024
        • By Source
        • By Application
    • Brazil
      • Pricing Analysis
      • Market Share Analysis, 2024
        • By Source
        • By Application
    • Mexico
      • Pricing Analysis
      • Market Share Analysis, 2024
        • By Source
        • By Application
    • Argentina
      • Pricing Analysis
      • Market Share Analysis, 2024
        • By Source
        • By Application
  17. Market Structure Analysis
    • Competition Dashboard
    • Competition Benchmarking
    • Market Share Analysis of Top Players
      • By Regional
      • By Source
      • By Application
  18. Competition Analysis
    • Competition Deep Dive
      • DSM NV
        • Overview
        • Product Portfolio
        • Profitability by Market Segments (Product/Age /Sales Channel/Region)
        • Sales Footprint
        • Strategy Overview
          • Marketing Strategy
          • Product Strategy
          • Channel Strategy
      • Charles Bowman & Company
        • Overview
        • Product Portfolio
        • Profitability by Market Segments (Product/Age /Sales Channel/Region)
        • Sales Footprint
        • Strategy Overview
          • Marketing Strategy
          • Product Strategy
          • Channel Strategy
      • T.J Clark & Company
        • Overview
        • Product Portfolio
        • Profitability by Market Segments (Product/Age /Sales Channel/Region)
        • Sales Footprint
        • Strategy Overview
          • Marketing Strategy
          • Product Strategy
          • Channel Strategy
      • Shandong Runde Biotechnology Co.
        • Overview
        • Product Portfolio
        • Profitability by Market Segments (Product/Age /Sales Channel/Region)
        • Sales Footprint
        • Strategy Overview
          • Marketing Strategy
          • Product Strategy
          • Channel Strategy
      • Howtian
        • Overview
        • Product Portfolio
        • Profitability by Market Segments (Product/Age /Sales Channel/Region)
        • Sales Footprint
        • Strategy Overview
          • Marketing Strategy
          • Product Strategy
          • Channel Strategy
      • Biological E ltd
        • Overview
        • Product Portfolio
        • Profitability by Market Segments (Product/Age /Sales Channel/Region)
        • Sales Footprint
        • Strategy Overview
          • Marketing Strategy
          • Product Strategy
          • Channel Strategy
      • Ronas Chemicals
        • Overview
        • Product Portfolio
        • Profitability by Market Segments (Product/Age /Sales Channel/Region)
        • Sales Footprint
        • Strategy Overview
          • Marketing Strategy
          • Product Strategy
          • Channel Strategy
      • Holland & Barrett
        • Overview
        • Product Portfolio
        • Profitability by Market Segments (Product/Age /Sales Channel/Region)
        • Sales Footprint
        • Strategy Overview
          • Marketing Strategy
          • Product Strategy
          • Channel Strategy
      • Phoenix Herb
        • Overview
        • Product Portfolio
        • Profitability by Market Segments (Product/Age /Sales Channel/Region)
        • Sales Footprint
        • Strategy Overview
          • Marketing Strategy
          • Product Strategy
          • Channel Strategy
      • Asiamerica Group, Inc.
        • Overview
        • Product Portfolio
        • Profitability by Market Segments (Product/Age /Sales Channel/Region)
        • Sales Footprint
        • Strategy Overview
          • Marketing Strategy
          • Product Strategy
          • Channel Strategy
  19. Assumptions & Acronyms Used
  20. Research Methodology

List of Tables

  • Table 1: Global Market Value (USD Million) Forecast by Region, 2020-2035
  • Table 2: Global Market Volume (Metric Tons) Forecast by Region, 2020-2035
  • Table 3: Global Market Value (USD Million) Forecast by Source, 2020-2035
  • Table 4: Global Market Volume (Metric Tons) Forecast by Source, 2020-2035
  • Table 5: Global Market Value (USD Million) Forecast by Application, 2020-2035
  • Table 6: Global Market Volume (Metric Tons) Forecast by Application, 2020-2035
  • Table 7: North America Market Value (USD Million) Forecast by Country, 2020-2035
  • Table 8: North America Market Volume (Metric Tons) Forecast by Country, 2020-2035
  • Table 9: North America Market Value (USD Million) Forecast by Source, 2020-2035
  • Table 10: North America Market Volume (Metric Tons) Forecast by Source, 2020-2035
  • Table 11: North America Market Value (USD Million) Forecast by Application, 2020-2035
  • Table 12: North America Market Volume (Metric Tons) Forecast by Application, 2020-2035
  • Table 13: Latin America Market Value (USD Million) Forecast by Country, 2020-2035
  • Table 14: Latin America Market Volume (Metric Tons) Forecast by Country, 2020-2035
  • Table 15: Latin America Market Value (USD Million) Forecast by Source, 2020-2035
  • Table 16: Latin America Market Volume (Metric Tons) Forecast by Source, 2020-2035
  • Table 17: Latin America Market Value (USD Million) Forecast by Application, 2020-2035
  • Table 18: Latin America Market Volume (Metric Tons) Forecast by Application, 2020-2035
  • Table 19: Western Europe Market Value (USD Million) Forecast by Country, 2020-2035
  • Table 20: Western Europe Market Volume (Metric Tons) Forecast by Country, 2020-2035
  • Table 21: Western Europe Market Value (USD Million) Forecast by Source, 2020-2035
  • Table 22: Western Europe Market Volume (Metric Tons) Forecast by Source, 2020-2035
  • Table 23: Western Europe Market Value (USD Million) Forecast by Application, 2020-2035
  • Table 24: Western Europe Market Volume (Metric Tons) Forecast by Application, 2020-2035
  • Table 25: Eastern Europe Market Value (USD Million) Forecast by Country, 2020-2035
  • Table 26: Eastern Europe Market Volume (Metric Tons) Forecast by Country, 2020-2035
  • Table 27: Eastern Europe Market Value (USD Million) Forecast by Source, 2020-2035
  • Table 28: Eastern Europe Market Volume (Metric Tons) Forecast by Source, 2020-2035
  • Table 29: Eastern Europe Market Value (USD Million) Forecast by Application, 2020-2035
  • Table 30: Eastern Europe Market Volume (Metric Tons) Forecast by Application, 2020-2035
  • Table 31: East Asia Market Value (USD Million) Forecast by Country, 2020-2035
  • Table 32: East Asia Market Volume (Metric Tons) Forecast by Country, 2020-2035
  • Table 33: East Asia Market Value (USD Million) Forecast by Source, 2020-2035
  • Table 34: East Asia Market Volume (Metric Tons) Forecast by Source, 2020-2035
  • Table 35: East Asia Market Value (USD Million) Forecast by Application, 2020-2035
  • Table 36: East Asia Market Volume (Metric Tons) Forecast by Application, 2020-2035
  • Table 37: South Asia & Pacific Market Value (USD Million) Forecast by Country, 2020-2035
  • Table 38: South Asia & Pacific Market Volume (Metric Tons) Forecast by Country, 2020-2035
  • Table 39: South Asia & Pacific Market Value (USD Million) Forecast by Source, 2020-2035
  • Table 40: South Asia & Pacific Market Volume (Metric Tons) Forecast by Source, 2020-2035
  • Table 41: South Asia & Pacific Market Value (USD Million) Forecast by Application, 2020-2035
  • Table 42: South Asia & Pacific Market Volume (Metric Tons) Forecast by Application, 2020-2035
  • Table 43: Middle East and Africa Market Value (USD Million) Forecast by Country, 2020-2035
  • Table 44: Middle East and Africa Market Volume (Metric Tons) Forecast by Country, 2020-2035
  • Table 45: Middle East and Africa Market Value (USD Million) Forecast by Source, 2020-2035
  • Table 46: Middle East and Africa Market Volume (Metric Tons) Forecast by Source, 2020-2035
  • Table 47: Middle East and Africa Market Value (USD Million) Forecast by Application, 2020-2035
  • Table 48: Middle East and Africa Market Volume (Metric Tons) Forecast by Application, 2020-2035

List of Figures

  • Figure 1: Global Market Volume (Metric Tons) Forecast 2020-2035
  • Figure 2: Global Market Pricing Analysis
  • Figure 3: Global Market Value (USD Million) Forecast 2020-2035
  • Figure 4: Global Market Value Share and BPS Analysis by Source, 2025 and 2035
  • Figure 5: Global Market Y-o-Y Growth Comparison by Source, 2025-2035
  • Figure 6: Global Market Attractiveness Analysis by Source
  • Figure 7: Global Market Value Share and BPS Analysis by Application, 2025 and 2035
  • Figure 8: Global Market Y-o-Y Growth Comparison by Application, 2025-2035
  • Figure 9: Global Market Attractiveness Analysis by Application
  • Figure 10: Global Market Value (USD Million) Share and BPS Analysis by Region, 2025 and 2035
  • Figure 11: Global Market Y-o-Y Growth Comparison by Region, 2025-2035
  • Figure 12: Global Market Attractiveness Analysis by Region
  • Figure 13: North America Market Incremental $ Opportunity, 2025-2035
  • Figure 14: Latin America Market Incremental $ Opportunity, 2025-2035
  • Figure 15: Western Europe Market Incremental $ Opportunity, 2025-2035
  • Figure 16: Eastern Europe Market Incremental $ Opportunity, 2025-2035
  • Figure 17: East Asia Market Incremental $ Opportunity, 2025-2035
  • Figure 18: South Asia & Pacific Market Incremental $ Opportunity, 2025-2035
  • Figure 19: Middle East and Africa Market Incremental $ Opportunity, 2025-2035
  • Figure 20: North America Market Value Share and BPS Analysis by Country, 2025 and 2035
  • Figure 21: North America Market Value Share and BPS Analysis by Source, 2025 and 2035
  • Figure 22: North America Market Y-o-Y Growth Comparison by Source, 2025-2035
  • Figure 23: North America Market Attractiveness Analysis by Source
  • Figure 24: North America Market Value Share and BPS Analysis by Application, 2025 and 2035
  • Figure 25: North America Market Y-o-Y Growth Comparison by Application, 2025-2035
  • Figure 26: North America Market Attractiveness Analysis by Application
  • Figure 27: Latin America Market Value Share and BPS Analysis by Country, 2025 and 2035
  • Figure 28: Latin America Market Value Share and BPS Analysis by Source, 2025 and 2035
  • Figure 29: Latin America Market Y-o-Y Growth Comparison by Source, 2025-2035
  • Figure 30: Latin America Market Attractiveness Analysis by Source
  • Figure 31: Latin America Market Value Share and BPS Analysis by Application, 2025 and 2035
  • Figure 32: Latin America Market Y-o-Y Growth Comparison by Application, 2025-2035
  • Figure 33: Latin America Market Attractiveness Analysis by Application
  • Figure 34: Western Europe Market Value Share and BPS Analysis by Country, 2025 and 2035
  • Figure 35: Western Europe Market Value Share and BPS Analysis by Source, 2025 and 2035
  • Figure 36: Western Europe Market Y-o-Y Growth Comparison by Source, 2025-2035
  • Figure 37: Western Europe Market Attractiveness Analysis by Source
  • Figure 38: Western Europe Market Value Share and BPS Analysis by Application, 2025 and 2035
  • Figure 39: Western Europe Market Y-o-Y Growth Comparison by Application, 2025-2035
  • Figure 40: Western Europe Market Attractiveness Analysis by Application
  • Figure 41: Eastern Europe Market Value Share and BPS Analysis by Country, 2025 and 2035
  • Figure 42: Eastern Europe Market Value Share and BPS Analysis by Source, 2025 and 2035
  • Figure 43: Eastern Europe Market Y-o-Y Growth Comparison by Source, 2025-2035
  • Figure 44: Eastern Europe Market Attractiveness Analysis by Source
  • Figure 45: Eastern Europe Market Value Share and BPS Analysis by Application, 2025 and 2035
  • Figure 46: Eastern Europe Market Y-o-Y Growth Comparison by Application, 2025-2035
  • Figure 47: Eastern Europe Market Attractiveness Analysis by Application
  • Figure 48: East Asia Market Value Share and BPS Analysis by Country, 2025 and 2035
  • Figure 49: East Asia Market Value Share and BPS Analysis by Source, 2025 and 2035
  • Figure 50: East Asia Market Y-o-Y Growth Comparison by Source, 2025-2035
  • Figure 51: East Asia Market Attractiveness Analysis by Source
  • Figure 52: East Asia Market Value Share and BPS Analysis by Application, 2025 and 2035
  • Figure 53: East Asia Market Y-o-Y Growth Comparison by Application, 2025-2035
  • Figure 54: East Asia Market Attractiveness Analysis by Application
  • Figure 55: South Asia & Pacific Market Value Share and BPS Analysis by Country, 2025 and 2035
  • Figure 56: South Asia & Pacific Market Value Share and BPS Analysis by Source, 2025 and 2035
  • Figure 57: South Asia & Pacific Market Y-o-Y Growth Comparison by Source, 2025-2035
  • Figure 58: South Asia & Pacific Market Attractiveness Analysis by Source
  • Figure 59: South Asia & Pacific Market Value Share and BPS Analysis by Application, 2025 and 2035
  • Figure 60: South Asia & Pacific Market Y-o-Y Growth Comparison by Application, 2025-2035
  • Figure 61: South Asia & Pacific Market Attractiveness Analysis by Application
  • Figure 62: Middle East and Africa Market Value Share and BPS Analysis by Country, 2025 and 2035
  • Figure 63: Middle East and Africa Market Value Share and BPS Analysis by Source, 2025 and 2035
  • Figure 64: Middle East and Africa Market Y-o-Y Growth Comparison by Source, 2025-2035
  • Figure 65: Middle East and Africa Market Attractiveness Analysis by Source
  • Figure 66: Middle East and Africa Market Value Share and BPS Analysis by Application, 2025 and 2035
  • Figure 67: Middle East and Africa Market Y-o-Y Growth Comparison by Application, 2025-2035
  • Figure 68: Middle East and Africa Market Attractiveness Analysis by Application
  • Figure 69: Global Market - Tier Structure Analysis
  • Figure 70: Global Market - Company Share Analysis

Frequently Asked Questions

What is the projected size of the global inositol market by 2035?

The market is expected to reach USD 482.9 million by 2035.

What is the CAGR of the inositol market from 2025 to 2035?

The market is forecasted to grow at a CAGR of 11.7%.

Which country holds the largest share of the inositol market in 2025?

Japan is projected to grow at a CAGR of 10.5% from 2025 to 2035.

What segment leads the inositol market by source segment in 2025?

Plant-based will lead the source segment, accounting for 58% of market share in 2025.

Which application segment dominates the inositol market?

The pharmaceutical industry segment dominates with a 33% share in 2025.

Future Market Insights

Inositol Market