Insights-As-A-Service Market Snapshot (2023 to 2033)

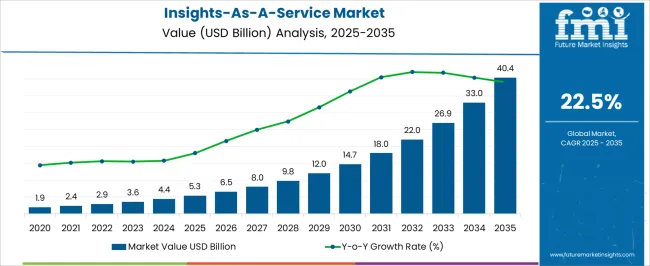
According to Future Market Insights, the insights-as-a-service market is expected to total US$ 3,493.2 million in 2023. From 2023 and 2033, the market is expected to register growth at a CAGR of 23.5% to reach a valuation of US$ 29,911 million.

As per research done by Future Market Research (FMI) on the insights-as-a-service market, it has been revealed that North America is the market leader with over 60% of the global share. Meanwhile, the report has identified the BFSI as the largest end user.

Report Attribute Details
Base year (2022) Market Value US$ 2,865.5 million
Projected year (2023) Market Value US$ 3,493.2 million
Projected year (2033) Market Value US$ 29,911 million
CAGR% (2023 to 2033) 23.5%

Don't pay for what you don't need

Customize your report by selecting specific countries or regions and save 30%!

Demand Analysis of Insights-as-a-Service from 2018 to 2022 Vs Market Outlook for 2023 to 2033

The global market for the insights-as-a-service market has grown at the rate of 21.4% from 2018 to 2022. Increasing the focus of businesses to scale up to achieve their business goals will result in higher prospects for growth.

A focus on improving customer lifecycle management among SMEs and large enterprises will result in increasing the application of insights-as-a-service across organizations.

FMI identifies Europe, followed by North America, as the leading market. Expansion in Europe is supported by the region’s developed infrastructure that encourages the adoption of advanced technologies such as the Internet of Things (IoT), artificial intelligence (AI), and machine learning (ML) in data analytics. Driven by these factors, the global market is projected to reach a valuation of US$ 29,911 million by 2033, rising at a CAGR of 23.5%.

Why is the Adoption of Insights-as-a-Service Increasing in Small and Mid-sized Businesses?

Cloud services and digital transformation help companies to increase agility, improve efficiencies and ROI, and curb unnecessary expenses in small and mid-sized enterprises.

The adoption of insights-as-a-service burgeoned as remote working became highly prevalent following the COVID-19 outbreak. This trend is expected to continue even as the pandemic passes, creating demand for remote and mobile access applications, services, systems, and data both in the cloud and on premise.

Sudip Saha
Sudip Saha

Principal Consultant

Talk to Analyst

Find your sweet spots for generating winning opportunities in this market.

How Businesses Leverage Insights-as-a-Service Platform to Achieve Business Goals?

In recent years, the growth of big data analytics has been significant. Insights-as-a-Service solutions provide insights to companies that help them to create unprecedented opportunities. It provides companies with predictive analytics and business intelligence with the help of company data such as stocks, financial data and results, keyword performance, employee details, and business process data.

Such insights help the company to increase the sales of products and services. It also uses different data types such as company data, usage data, and syndicated data, and provides insights on the ROI, and important decisions to be taken in the future. Therefore Insights-as-a-Service solutions help companies/SMEs to scale up to achieve their business goals in coming years fueling the demand for the insights-as-a-service platform.

Will IoT Integration Create Opportunities for Insights-as-a-Service Providers?

The rise in the adoption of IoT technology across diverse industries is expected to drive the demand for insights-as-a-service. Insights-as-a-service is a cloud based service offered to companies, which helps them to increase their ROI. Demand for insights-as-a-service solutions is expected to increase as a result of the integration of advanced technologies such as 5G and 4G Internet across industries.

As per the New Eclipse Foundation’s IoT commercial adoption survey, about 40% of industry leaders responding to the survey say that their organizations are using IoT solutions, and 22 percent more plan to deploy IoT in the coming years.

In addition, IoT investment is expected to increase as 40 percent of organizations are planning to spend more on IoT solutions from 2022 to 2023. Rising adoption of IoT ultimately propels the demand for insights-as-a-service solutions in coming years.

Get the data you need at a Fraction of the cost

Personalize your report by choosing insights you need
and save 40%!

Lower Up-front Cost and High ROI of Insights-as-a-Service Solutions to Push their Demand

IaaS is a cloud-mediated tool that interacts with a company and processes the data. It helps companies to provide insights and business intelligence in real time and figure out future steps. IaaS increases data prioritization from collected data and identifies challenges that need a company needs to overcome.

It focuses on the higher-level strategy and reduces the in-house cost which ultimately results in better decisions. IaaS provides the most effective path for the company to capture insights, which ultimately increases returns on all investments. Also, up-front cost of IaaS is lower as compared to traditional methods of data analysis. Owing to lower up-front costs and the high ROI of insights-as-a-service solutions, their demand is expected to rise.
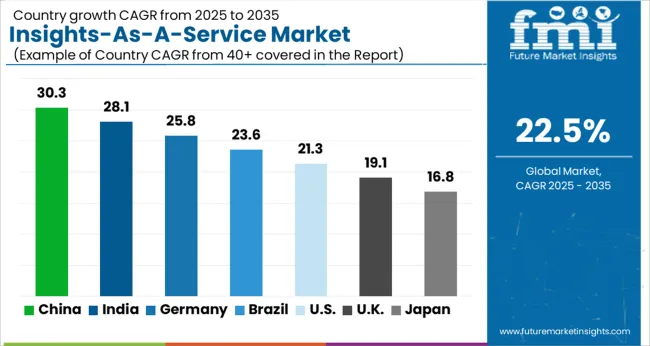
Country-wise insights

Why is Indonesia a Prominent Market for Insights-as-a-Service?

The Indonesia market is expected to be one of the leading markets for insights-as-a-service and is anticipated to surge at a CAGR of 35% over the forecasted period.

As per the Indonesian Internet Service Providers Association (APJII) survey, the number of internet users has increased by 14.6%. Also, the internet penetration rate of the country has increased from 64.8% to 73.7%. Thus increasing the internet penetration rate in the country will augment the demand for the insights-as-a-service offering.

Government support also will emerge as a chief growth driver. For instance, in August 2021, the Indonesia government announced the allocation of US$2.1 billion budget for Information and Communication Technology (ICT) development to accelerate the digital transformation.

Insights-as-a-service solutions are cloud based and the cloud is directly dependent on the availability of the infrastructure for internet connectivity. Thus, favorable initiatives adopted by the government are expected to fuel the demand for the insights-as-a-service in the country.

How will sales in the Insights-as-a-service market shape up in the United States?

Currently, the United States market accounts for the largest consumption of insights-as-a-service in North America and is expected to expand at a CAGR of around 23%.

Demand for insights-as-a-service is increasing in the United States due to factors such as increasing adoption of advanced technology like IoT, use of AI and ML in data analytics, and increasing investment in insights-as-a-service in the region. The United States has also developed infrastructure for the cloud based solutions.

The United States has a presence in major tech companies such as C3, AWS, and Google which promotes their products and analytics toolsets. These vendors offer cloud based solutions or services which help SMEs to grow at a significant rate. Thus rapid-adoption of cloud computing solutions in almost every sector ultimately fuels the demand for the insights-as-a-service offering.

Stringent rules and regulations of the United States government to develop ICT propels the demand for insights-as-a-service in the country. In June 2019, according to the United States Federal Cloud Computing Strategy, the government instituted the CloudFirst policy to accelerate the pace of cloud adoption. It also promotes the innovation, service management, and adoption of emerging advanced technologies. Such initiatives taken by the United States government are developing advanced technologies that fuel the demand for insights-as-a-service.

Why is Germany one of the prominent Markets for Insights-as-a-Service?

The German market accounts for the largest consumption of insights-as-a-service in Europe and is expected to expand at a CAGR of around 27% by 2033.

Germany has been forecast to register high adoption of advanced telecommunication infrastructure and technological innovations. This trend is more prevalent across large telecom companies in the country. Germany has developed infrastructure for the adoption of new technologies such as Artificial Intelligence (AI), Machine Learning (ML), and other digital technologies that are pushing the frontier of applications in the private, public, and social sectors in Germany. This in turn is driving the demand for insights-as-a-service solutions.

Category-wise Insights

Why are Insights-as-a-service Platforms highly Sought-after?

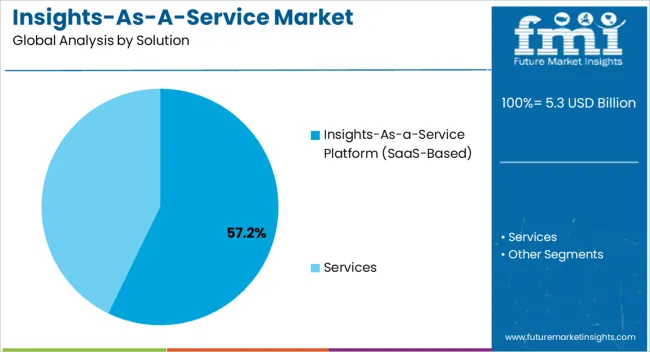
The segment insights-as-a-Service Platforms accounted for a market share of around 58.1% in 2022, owing to reasons such as the increase in adoption of IoT technology by many industries is expected to drive the demand for the insights-as-a-service market.

Why is Demand for Customer Analytics Rising?

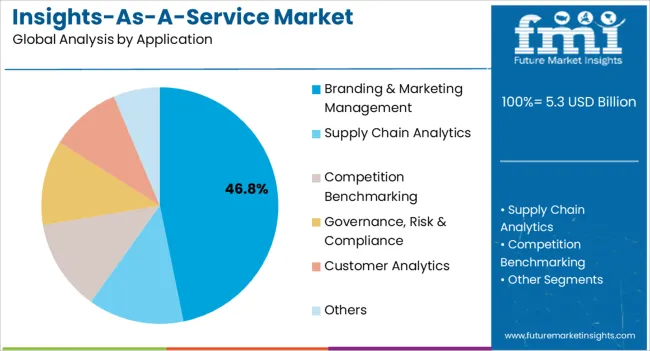
The customer analytics segment accounted for a market share of around 27.1% in 2022 owing to the emergence of new vendors in insights-as-a-service and the investment in cloud based offerings by the key vendors in recent years.

The use of insights-as-a-service solutions in industries such as business, finance, retail, media, and telecommunications has increased in recent years. As per the study, the investments towards other cloud-based and insights-as-a-service offerings are expected to increase wing to stringent government rules and regulations to promote start-ups in developed as well as developing countries.

Thus the emergence of new vendors and increasing investment in cloud based offerings by key players is expected to fuel the demand for insights-as-s-service solutions.

Why Do Large Enterprises Exhibit High Demand for Insights-as-s-Service?

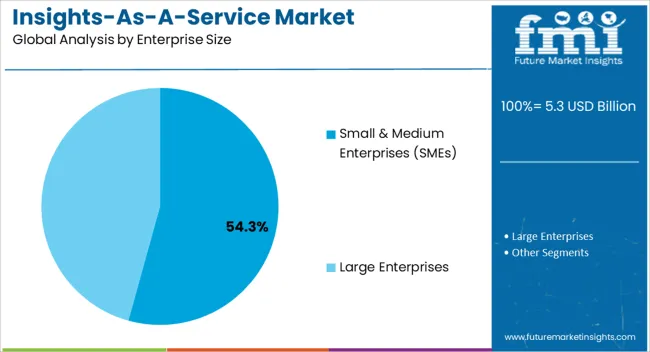
The large enterprises' segment is expected to contribute a maximum revenue share of 71.6% in the global demand for insights-as-s-Service in 2022.

IaaS provides the most effective path for the company to capture insights it ultimately increases the returns on all investments. In addition, up-front cost of IaaS is lower as compared to traditional methods of data analysis.

Thus owing to lower up-front cost and high ROI of insights-as-a-service solutions fuels the demand for insights-as-s-service in the large enterprise's segment.

Why is Demand Rising in the BFSI Sector?

The BFSI segment accounts for the largest consumption of insights-as-a-service and is expected to expand at a CAGR of around 19.6%. The BFSI segment held a 19.7% share of the total market share of insights-as-a-service in 2022.

There are many key vendors across the globe that offers insights-as-a-service solutions to clients and it helps to increase their ROI and customer lifecycle management. In recent years, along with such key vendors the emergence of new vendors in insights-as-a-service solutions has been increased and it’s been one of the driving factors for the BFSI segment.
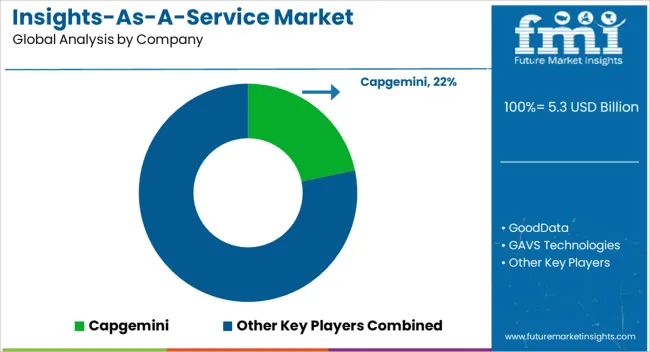
Competitive Landscape

Many key cloud-based service suppliers are inclined at investing heavily in innovation, research, and development practices to uncover increased applications of insights-as-a-service. With the use of technology, players are also focusing on ensuring safety, quality, and customer satisfaction for captivating an increased customer base.

  • In September 2021, Capgemini acquired VariQ. VariQ serves as a provider of software development, cybersecurity, and cloud services for federal government departments and agencies across the United States. Thus, it ultimately helps to enhance its insights as a service offering.
  • In October 2020, Oracle Corporation launched the Oracle Cloud Observability and Management Platform. It enables visibility and insight across cloud native and traditional technology, whether deployed in multicloud or on-premises environments, with broad, standards-based ecosystem support.
  • Management Controls Inc. (MCi), a renowned global producer of contractor spend management software, announced the introduction of its international managed service offering (MServ) in May 2023 to assist clients in focusing on their core business.
  • NTT Ltd., a major IT services and facilities provider, and Cisco, a global technology leader, announced a cooperation today to develop and implement integrated approaches that would enable organizations to increase operational efficiency and advanced objectives for sustainability.

Report Scope

Attribute Details
Market Value in 2023 US$ 3,493.2 million
Market Value in 2033 US$ 29,911 million
Market CAGR 2023 to 2033 23.5%
Forecast Period 2023 to 2033
Historical Data Available for 2018 to 2022
Market Analysis US$ Million for Value
Key regions covered
  • North America
  • Latin America
  • Europe
  • East Asia
  • South Asia
  • Oceania
  • Middle East & Africa
Key countries covered
  • United States
  • Canada
  • Germany
  • United Kingdom
  • France
  • Italy
  • Spain
  • India
  • Indonesia
  • Singapore
  • Thailand
  • China
  • Japan
  • South Korea
  • Australia
  • New Zealand
  • GCC Countries
  • South Africa
  • Israel
Key market segments covered
  • Solution
  • Application
  • Enterprise Size
  • Industry
  • Region
Key companies profiled
  • Capgemini
  • GoodData
  • GAVS Technologies
  • Oracle Corporation
  • IBM Corporation
  • Accenture
  • Crediwatch
  • Civica
  • Analytics Wise
  • Deloitte
  • thinkbridge Software
  • Totango
  • 9Lenses
  • JBara
  • ACTICO GmbH
Customization & Pricing Available upon request

Key Segments Covered in the Insights-as-a-Service Industry Survey

Solution:

  • Insights-as-a-Service Platform (SaaS-based)
  • Services
    • Consulting & Advisory
    • Implementation & Integration
    • Support & Maintenance

Application:

  • Branding & Marketing Management
  • Supply Chain Analytics
  • Competition Benchmarking
  • Governance, Risk & Compliance
  • Customer Analytics
  • Others

Enterprise Size:

  • Small & Medium Enterprises (SMEs)
  • Large Enterprises

Industry:

  • BFSI
  • Retail & CPG
  • IT & Telecom
  • Media & Entertainment
  • Education
  • Healthcare and Life Sciences
  • Government
  • Manufacturing
  • Others

Region:

  • North America
  • Latin America
  • Europe
  • East Asia
  • South Asia
  • Oceania
  • Middle East & Africa

Frequently Asked Questions

How Big is the Insights-as-a-service Market?

The market is valued at US$ 3,493.2 million in 2023.

Who are the Prominent Insights-as-a-service Industry Players?

Civica, Analytics Wise, Deloitte are the prominent industry players.

What is the Growth Forecast for the Insights-as-a-service Market?

The market is forecast to register a CAGR of 23.5% through 2033.

What is the Growth Forecast for the Insights-as-as-service Market in Germany?

The market is forecast to capture a 27% CAGR in Germany through 2033.

What was the Market Share of the Customer Analytics Segment in 2022?

The customer analytics segment accounted for a market share of around 27.1% in 2022.

Table of Content
1. Executive Summary
    1.1. Global Market Outlook
    1.2. Demand-side Trends
    1.3. Supply-side Trends
    1.4. Technology Roadmap Analysis
    1.5. Analysis and Recommendations
2. Market Overview
    2.1. Market Coverage / Taxonomy
    2.2. Market Definition / Scope / Limitations
3. Market Background
    3.1. Market Dynamics
        3.1.1. Drivers
        3.1.2. Restraints
        3.1.3. Opportunity
        3.1.4. Trends
    3.2. Scenario Forecast
        3.2.1. Demand in Optimistic Scenario
        3.2.2. Demand in Likely Scenario
        3.2.3. Demand in Conservative Scenario
    3.3. Opportunity Map Analysis
    3.4. Investment Feasibility Matrix
    3.5. PESTLE and Porter’s Analysis
    3.6. Regulatory Landscape
        3.6.1. By Key Regions
        3.6.2. By Key Countries
    3.7. Regional Parent Market Outlook
4. Global Market Analysis 2018 to 2022 and Forecast, 2023 to 2033
    4.1. Historical Market Size Value (US$ Million) Analysis, 2018 to 2022
    4.2. Current and Future Market Size Value (US$ Million) Projections, 2023 to 2033
        4.2.1. Y-o-Y Growth Trend Analysis
        4.2.2. Absolute $ Opportunity Analysis
5. Global Market Analysis 2018 to 2022 and Forecast 2023 to 2033, By Solution
    5.1. Introduction / Key Findings
    5.2. Historical Market Size Value (US$ Million) Analysis By Solution, 2018 to 2022
    5.3. Current and Future Market Size Value (US$ Million) Analysis and Forecast By Solution, 2023 to 2033
        5.3.1. Services
            5.3.1.1. Consulting & Advisory
            5.3.1.2. Implementation & Integration
            5.3.1.3. Support & Maintenance
        5.3.2. Platform (SaaS-based)
    5.4. Y-o-Y Growth Trend Analysis By Solution, 2018 to 2022
    5.5. Absolute $ Opportunity Analysis By Solution, 2023 to 2033
6. Global Market Analysis 2018 to 2022 and Forecast 2023 to 2033, By Application
    6.1. Introduction / Key Findings
    6.2. Historical Market Size Value (US$ Million) Analysis By Application, 2018 to 2022
    6.3. Current and Future Market Size Value (US$ Million) Analysis and Forecast By Application, 2023 to 2033
        6.3.1. Branding & Marketing Management
        6.3.2. Supply Chain Analytics
        6.3.3. Competition Benchmarking
        6.3.4. Governance, Risk & Compliance
        6.3.5. Customer Analytics
        6.3.6. Others
    6.4. Y-o-Y Growth Trend Analysis By Application, 2018 to 2022
    6.5. Absolute $ Opportunity Analysis By Application, 2023 to 2033
7. Global Market Analysis 2018 to 2022 and Forecast 2023 to 2033, By Enterprise Size
    7.1. Introduction / Key Findings
    7.2. Historical Market Size Value (US$ Million) Analysis By Enterprise Size, 2018 to 2022
    7.3. Current and Future Market Size Value (US$ Million) Analysis and Forecast By Enterprise Size, 2023 to 2033
        7.3.1. Small & Medium Enterprises (SMEs)
        7.3.2. Large Enterprises
    7.4. Y-o-Y Growth Trend Analysis By Enterprise Size, 2018 to 2022
    7.5. Absolute $ Opportunity Analysis By Enterprise Size, 2023 to 2033
8. Global Market Analysis 2018 to 2022 and Forecast 2023 to 2033, By Industry
    8.1. Introduction / Key Findings
    8.2. Historical Market Size Value (US$ Million) Analysis By Industry, 2018 to 2022
    8.3. Current and Future Market Size Value (US$ Million) Analysis and Forecast By Industry, 2023 to 2033
        8.3.1. BFSI
        8.3.2. Retail & CPG
        8.3.3. IT & Telecom
        8.3.4. Media & Entertainment
        8.3.5. Education
        8.3.6. Healthcare and Life Sciences
        8.3.7. Government
        8.3.8. Manufacturing
        8.3.9. Others
    8.4. Y-o-Y Growth Trend Analysis By Industry, 2018 to 2022
    8.5. Absolute $ Opportunity Analysis By Industry, 2023 to 2033
9. Global Market Analysis 2018 to 2022 and Forecast 2023 to 2033, By Region
    9.1. Introduction
    9.2. Historical Market Size Value (US$ Million) Analysis By Region, 2018 to 2022
    9.3. Current Market Size Value (US$ Million) Analysis and Forecast By Region, 2023 to 2033
        9.3.1. North America
        9.3.2. Latin America
        9.3.3. Europe
        9.3.4. South Asia
        9.3.5. East Asia
        9.3.6. Oceania
        9.3.7. MEA
    9.4. Market Attractiveness Analysis By Region
10. North America Market Analysis 2018 to 2022 and Forecast 2023 to 2033, By Country
    10.1. Historical Market Size Value (US$ Million) Trend Analysis By Market Taxonomy, 2018 to 2022
    10.2. Market Size Value (US$ Million) Forecast By Market Taxonomy, 2023 to 2033
        10.2.1. By Country
            10.2.1.1. The USA
            10.2.1.2. Canada
        10.2.2. By Solution
        10.2.3. By Application
        10.2.4. By Enterprise Size
        10.2.5. By Industry
    10.3. Market Attractiveness Analysis
        10.3.1. By Country
        10.3.2. By Solution
        10.3.3. By Application
        10.3.4. By Enterprise Size
        10.3.5. By Industry
    10.4. Key Takeaways
11. Latin America Market Analysis 2018 to 2022 and Forecast 2023 to 2033, By Country
    11.1. Historical Market Size Value (US$ Million) Trend Analysis By Market Taxonomy, 2018 to 2022
    11.2. Market Size Value (US$ Million) Forecast By Market Taxonomy, 2023 to 2033
        11.2.1. By Country
            11.2.1.1. Brazil
            11.2.1.2. Mexico
            11.2.1.3. Rest of Latin America
        11.2.2. By Solution
        11.2.3. By Application
        11.2.4. By Enterprise Size
        11.2.5. By Industry
    11.3. Market Attractiveness Analysis
        11.3.1. By Country
        11.3.2. By Solution
        11.3.3. By Application
        11.3.4. By Enterprise Size
        11.3.5. By Industry
    11.4. Key Takeaways
12. Europe Market Analysis 2018 to 2022 and Forecast 2023 to 2033, By Country
    12.1. Historical Market Size Value (US$ Million) Trend Analysis By Market Taxonomy, 2018 to 2022
    12.2. Market Size Value (US$ Million) Forecast By Market Taxonomy, 2023 to 2033
        12.2.1. By Country
            12.2.1.1. Germany
            12.2.1.2. United Kingdom
            12.2.1.3. France
            12.2.1.4. Spain
            12.2.1.5. Italy
            12.2.1.6. Rest of Europe
        12.2.2. By Solution
        12.2.3. By Application
        12.2.4. By Enterprise Size
        12.2.5. By Industry
    12.3. Market Attractiveness Analysis
        12.3.1. By Country
        12.3.2. By Solution
        12.3.3. By Application
        12.3.4. By Enterprise Size
        12.3.5. By Industry
    12.4. Key Takeaways
13. South Asia Market Analysis 2018 to 2022 and Forecast 2023 to 2033, By Country
    13.1. Historical Market Size Value (US$ Million) Trend Analysis By Market Taxonomy, 2018 to 2022
    13.2. Market Size Value (US$ Million) Forecast By Market Taxonomy, 2023 to 2033
        13.2.1. By Country
            13.2.1.1. India
            13.2.1.2. Malaysia
            13.2.1.3. Singapore
            13.2.1.4. Thailand
            13.2.1.5. Rest of South Asia
        13.2.2. By Solution
        13.2.3. By Application
        13.2.4. By Enterprise Size
        13.2.5. By Industry
    13.3. Market Attractiveness Analysis
        13.3.1. By Country
        13.3.2. By Solution
        13.3.3. By Application
        13.3.4. By Enterprise Size
        13.3.5. By Industry
    13.4. Key Takeaways
14. East Asia Market Analysis 2018 to 2022 and Forecast 2023 to 2033, By Country
    14.1. Historical Market Size Value (US$ Million) Trend Analysis By Market Taxonomy, 2018 to 2022
    14.2. Market Size Value (US$ Million) Forecast By Market Taxonomy, 2023 to 2033
        14.2.1. By Country
            14.2.1.1. China
            14.2.1.2. Japan
            14.2.1.3. South Korea
        14.2.2. By Solution
        14.2.3. By Application
        14.2.4. By Enterprise Size
        14.2.5. By Industry
    14.3. Market Attractiveness Analysis
        14.3.1. By Country
        14.3.2. By Solution
        14.3.3. By Application
        14.3.4. By Enterprise Size
        14.3.5. By Industry
    14.4. Key Takeaways
15. Oceania Market Analysis 2018 to 2022 and Forecast 2023 to 2033, By Country
    15.1. Historical Market Size Value (US$ Million) Trend Analysis By Market Taxonomy, 2018 to 2022
    15.2. Market Size Value (US$ Million) Forecast By Market Taxonomy, 2023 to 2033
        15.2.1. By Country
            15.2.1.1. Australia
            15.2.1.2. New Zealand
        15.2.2. By Solution
        15.2.3. By Application
        15.2.4. By Enterprise Size
        15.2.5. By Industry
    15.3. Market Attractiveness Analysis
        15.3.1. By Country
        15.3.2. By Solution
        15.3.3. By Application
        15.3.4. By Enterprise Size
        15.3.5. By Industry
    15.4. Key Takeaways
16. MEA Market Analysis 2018 to 2022 and Forecast 2023 to 2033, By Country
    16.1. Historical Market Size Value (US$ Million) Trend Analysis By Market Taxonomy, 2018 to 2022
    16.2. Market Size Value (US$ Million) Forecast By Market Taxonomy, 2023 to 2033
        16.2.1. By Country
            16.2.1.1. GCC Countries
            16.2.1.2. South Africa
            16.2.1.3. Israel
            16.2.1.4. Rest of MEA
        16.2.2. By Solution
        16.2.3. By Application
        16.2.4. By Enterprise Size
        16.2.5. By Industry
    16.3. Market Attractiveness Analysis
        16.3.1. By Country
        16.3.2. By Solution
        16.3.3. By Application
        16.3.4. By Enterprise Size
        16.3.5. By Industry
    16.4. Key Takeaways
17. Key Countries Market Analysis
    17.1. USA
        17.1.1. Pricing Analysis
        17.1.2. Market Share Analysis, 2022
            17.1.2.1. By Solution
            17.1.2.2. By Application
            17.1.2.3. By Enterprise Size
            17.1.2.4. By Industry
    17.2. Canada
        17.2.1. Pricing Analysis
        17.2.2. Market Share Analysis, 2022
            17.2.2.1. By Solution
            17.2.2.2. By Application
            17.2.2.3. By Enterprise Size
            17.2.2.4. By Industry
    17.3. Brazil
        17.3.1. Pricing Analysis
        17.3.2. Market Share Analysis, 2022
            17.3.2.1. By Solution
            17.3.2.2. By Application
            17.3.2.3. By Enterprise Size
            17.3.2.4. By Industry
    17.4. Mexico
        17.4.1. Pricing Analysis
        17.4.2. Market Share Analysis, 2022
            17.4.2.1. By Solution
            17.4.2.2. By Application
            17.4.2.3. By Enterprise Size
            17.4.2.4. By Industry
    17.5. Germany
        17.5.1. Pricing Analysis
        17.5.2. Market Share Analysis, 2022
            17.5.2.1. By Solution
            17.5.2.2. By Application
            17.5.2.3. By Enterprise Size
            17.5.2.4. By Industry
    17.6. United Kingdom
        17.6.1. Pricing Analysis
        17.6.2. Market Share Analysis, 2022
            17.6.2.1. By Solution
            17.6.2.2. By Application
            17.6.2.3. By Enterprise Size
            17.6.2.4. By Industry
    17.7. France
        17.7.1. Pricing Analysis
        17.7.2. Market Share Analysis, 2022
            17.7.2.1. By Solution
            17.7.2.2. By Application
            17.7.2.3. By Enterprise Size
            17.7.2.4. By Industry
    17.8. Spain
        17.8.1. Pricing Analysis
        17.8.2. Market Share Analysis, 2022
            17.8.2.1. By Solution
            17.8.2.2. By Application
            17.8.2.3. By Enterprise Size
            17.8.2.4. By Industry
    17.9. Italy
        17.9.1. Pricing Analysis
        17.9.2. Market Share Analysis, 2022
            17.9.2.1. By Solution
            17.9.2.2. By Application
            17.9.2.3. By Enterprise Size
            17.9.2.4. By Industry
    17.10. India
        17.10.1. Pricing Analysis
        17.10.2. Market Share Analysis, 2022
            17.10.2.1. By Solution
            17.10.2.2. By Application
            17.10.2.3. By Enterprise Size
            17.10.2.4. By Industry
    17.11. Malaysia
        17.11.1. Pricing Analysis
        17.11.2. Market Share Analysis, 2022
            17.11.2.1. By Solution
            17.11.2.2. By Application
            17.11.2.3. By Enterprise Size
            17.11.2.4. By Industry
    17.12. Singapore
        17.12.1. Pricing Analysis
        17.12.2. Market Share Analysis, 2022
            17.12.2.1. By Solution
            17.12.2.2. By Application
            17.12.2.3. By Enterprise Size
            17.12.2.4. By Industry
    17.13. Thailand
        17.13.1. Pricing Analysis
        17.13.2. Market Share Analysis, 2022
            17.13.2.1. By Solution
            17.13.2.2. By Application
            17.13.2.3. By Enterprise Size
            17.13.2.4. By Industry
    17.14. China
        17.14.1. Pricing Analysis
        17.14.2. Market Share Analysis, 2022
            17.14.2.1. By Solution
            17.14.2.2. By Application
            17.14.2.3. By Enterprise Size
            17.14.2.4. By Industry
    17.15. Japan
        17.15.1. Pricing Analysis
        17.15.2. Market Share Analysis, 2022
            17.15.2.1. By Solution
            17.15.2.2. By Application
            17.15.2.3. By Enterprise Size
            17.15.2.4. By Industry
    17.16. South Korea
        17.16.1. Pricing Analysis
        17.16.2. Market Share Analysis, 2022
            17.16.2.1. By Solution
            17.16.2.2. By Application
            17.16.2.3. By Enterprise Size
            17.16.2.4. By Industry
    17.17. Australia
        17.17.1. Pricing Analysis
        17.17.2. Market Share Analysis, 2022
            17.17.2.1. By Solution
            17.17.2.2. By Application
            17.17.2.3. By Enterprise Size
            17.17.2.4. By Industry
    17.18. New Zealand
        17.18.1. Pricing Analysis
        17.18.2. Market Share Analysis, 2022
            17.18.2.1. By Solution
            17.18.2.2. By Application
            17.18.2.3. By Enterprise Size
            17.18.2.4. By Industry
    17.19. GCC Countries
        17.19.1. Pricing Analysis
        17.19.2. Market Share Analysis, 2022
            17.19.2.1. By Solution
            17.19.2.2. By Application
            17.19.2.3. By Enterprise Size
            17.19.2.4. By Industry
    17.20. South Africa
        17.20.1. Pricing Analysis
        17.20.2. Market Share Analysis, 2022
            17.20.2.1. By Solution
            17.20.2.2. By Application
            17.20.2.3. By Enterprise Size
            17.20.2.4. By Industry
    17.21. Israel
        17.21.1. Pricing Analysis
        17.21.2. Market Share Analysis, 2022
            17.21.2.1. By Solution
            17.21.2.2. By Application
            17.21.2.3. By Enterprise Size
            17.21.2.4. By Industry
18. Market Structure Analysis
    18.1. Competition Dashboard
    18.2. Competition Benchmarking
    18.3. Market Share Analysis of Top Players
        18.3.1. By Regional
        18.3.2. By Solution
        18.3.3. By Application
        18.3.4. By Enterprise Size
        18.3.5. By Industry
19. Competition Analysis
    19.1. Competition Deep Dive
        19.1.1. Capgemini
            19.1.1.1. Overview
            19.1.1.2. Product Portfolio
            19.1.1.3. Profitability by Market Segments
            19.1.1.4. Sales Footprint
            19.1.1.5. Strategy Overview
                19.1.1.5.1. Marketing Strategy
        19.1.2. GoodData
            19.1.2.1. Overview
            19.1.2.2. Product Portfolio
            19.1.2.3. Profitability by Market Segments
            19.1.2.4. Sales Footprint
            19.1.2.5. Strategy Overview
                19.1.2.5.1. Marketing Strategy
        19.1.3. GAVS Technologies
            19.1.3.1. Overview
            19.1.3.2. Product Portfolio
            19.1.3.3. Profitability by Market Segments
            19.1.3.4. Sales Footprint
            19.1.3.5. Strategy Overview
                19.1.3.5.1. Marketing Strategy
        19.1.4. Oracle Corporation
            19.1.4.1. Overview
            19.1.4.2. Product Portfolio
            19.1.4.3. Profitability by Market Segments
            19.1.4.4. Sales Footprint
            19.1.4.5. Strategy Overview
                19.1.4.5.1. Marketing Strategy
        19.1.5. IBM Corporation
            19.1.5.1. Overview
            19.1.5.2. Product Portfolio
            19.1.5.3. Profitability by Market Segments
            19.1.5.4. Sales Footprint
            19.1.5.5. Strategy Overview
                19.1.5.5.1. Marketing Strategy
        19.1.6. Accenture
            19.1.6.1. Overview
            19.1.6.2. Product Portfolio
            19.1.6.3. Profitability by Market Segments
            19.1.6.4. Sales Footprint
            19.1.6.5. Strategy Overview
                19.1.6.5.1. Marketing Strategy
        19.1.7. Crediwatch
            19.1.7.1. Overview
            19.1.7.2. Product Portfolio
            19.1.7.3. Profitability by Market Segments
            19.1.7.4. Sales Footprint
            19.1.7.5. Strategy Overview
                19.1.7.5.1. Marketing Strategy
        19.1.8. Civica
            19.1.8.1. Overview
            19.1.8.2. Product Portfolio
            19.1.8.3. Profitability by Market Segments
            19.1.8.4. Sales Footprint
            19.1.8.5. Strategy Overview
                19.1.8.5.1. Marketing Strategy
        19.1.9. Analytics Wise
            19.1.9.1. Overview
            19.1.9.2. Product Portfolio
            19.1.9.3. Profitability by Market Segments
            19.1.9.4. Sales Footprint
            19.1.9.5. Strategy Overview
                19.1.9.5.1. Marketing Strategy
        19.1.10. Deloitte
            19.1.10.1. Overview
            19.1.10.2. Product Portfolio
            19.1.10.3. Profitability by Market Segments
            19.1.10.4. Sales Footprint
            19.1.10.5. Strategy Overview
                19.1.10.5.1. Marketing Strategy
        19.1.11. thinkbridge Software
            19.1.11.1. Overview
            19.1.11.2. Product Portfolio
            19.1.11.3. Profitability by Market Segments
            19.1.11.4. Sales Footprint
            19.1.11.5. Strategy Overview
                19.1.11.5.1. Marketing Strategy
        19.1.12. Totango
            19.1.12.1. Overview
            19.1.12.2. Product Portfolio
            19.1.12.3. Profitability by Market Segments
            19.1.12.4. Sales Footprint
            19.1.12.5. Strategy Overview
                19.1.12.5.1. Marketing Strategy
        19.1.13. 9Lenses
            19.1.13.1. Overview
            19.1.13.2. Product Portfolio
            19.1.13.3. Profitability by Market Segments
            19.1.13.4. Sales Footprint
            19.1.13.5. Strategy Overview
                19.1.13.5.1. Marketing Strategy
        19.1.14. JBara
            19.1.14.1. Overview
            19.1.14.2. Product Portfolio
            19.1.14.3. Profitability by Market Segments
            19.1.14.4. Sales Footprint
            19.1.14.5. Strategy Overview
                19.1.14.5.1. Marketing Strategy
        19.1.15. ACTICO GmbH
            19.1.15.1. Overview
            19.1.15.2. Product Portfolio
            19.1.15.3. Profitability by Market Segments
            19.1.15.4. Sales Footprint
            19.1.15.5. Strategy Overview
                19.1.15.5.1. Marketing Strategy
20. Assumptions & Acronyms Used
21. Research Methodology
Recommendations

Technology

Business Analytics BPO Services Market

October 2024

REP-GB-3348

300 pages

Technology

Digital Marketing Analytics Market

April 2024

REP-GB-7017

331 pages

Technology

Advanced Analytics Market

November 2023

REP-GB-5087

170 pages

Technology

Social Business Intelligence Market

November 2023

REP-GB-3182

234 pages

Explore Technology Insights

View Reports
Future Market Insights

Insights-As-A-Service Market

Schedule a Call