Interferons Market Size and Share Forecast Outlook (2022 to 2032)

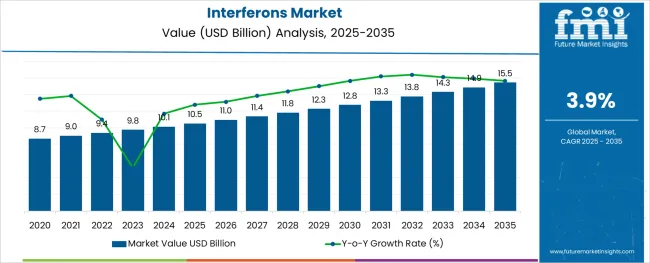
The global interferons market is set to reach a valuation of USD 9.4 Billion in 2022, and further expand at a CAGR of 3.9% in the forecast period from 2022 to 2032. The global market is anticipated to reach USD 13.8 Billion by the end of 2032.

Attribute Key Statistics
Global Interferons Market Estimated Size (2021E) USD 9.1 Billion
Projected Market Valuation (2022F) USD 9.4 Billion
Projected Market Valuation (2032F) USD 13.8 Billion
Value-based CAGR (2022 to 2032) 3.9%
Collective Value Share: Top 5 Countries (2021E) 58.2%

The interferons industry held approximately 5.0% of the global immunotherapy drugs market in 2021, which is worth USD 181.8 Billion.

The interferon market is expected to grow steadily as the prevalence of multiple sclerosis (MS) is increasing worldwide. According to the Multiple Sclerosis Trust (MST) data published in 2020, an estimated 2,500,000 individuals worldwide suffer from multiple sclerosis.

The organization further states that the number of women diagnosed with multiple sclerosis is increasing by 2 to 3 people every year. The prevalence of multiple sclerosis varies in various parts of the world.

According to MST, equatorial regions of Asia, Africa, and America have a low prevalence of multiple sclerosis, while Canada and Scotland have a high prevalence. These trends are projected to continue throughout the forecast period owing to a combination of environmental and genetic factors, thereby pushing demand for interferon-beta solutions.

The ongoing development of novel interferon beta is another vital factor that is expected to aid growth. Biogen Inc., for instance, obtained FDA approval in February 2021 for a novel intramuscular (IM) injectable route of administration for PLEGRIDY, which is a drug used to treat relapse forms of multiple sclerosis.

Relapsing multiple sclerosis patients receiving PLEGRIDY intramuscularly, are set to benefit from the drug's well-known efficacy and safety, as well as the potential of significantly reduced injection site hypersensitivity.

Such fast-track approvals by government organizations are likely to enhance the product offerings of key players and push sales of interferons in the market during the forecast period of 2022 to 2032.

Comparison of Interferons Demand Outlook (2017 to 2021) vs 2022 to 2032 Forecast

Interferon-beta is a naturally occurring protein that regulates the body's antiviral responses. The rising number of approvals of interferon-beta by organizations such as the Medicines and Healthcare Products Regulatory Agency (MHRA) and the Health Research Authority (HRA) is anticipated to spur growth. SNG001, for instance, is an interferon-beta-1a inhalation formulation that is nebulized directly into the lungs.

In addition, the increasing prevalence of various chronic diseases such as hepatitis B, hepatitis C, cancer, and multiple sclerosis in both developed and developing countries is expected to augment the market. More than fifteen human interferons are already available in the market and the number is expected to rise in the upcoming decade.

Owing to the aforementioned factors, the global interferons market is set to grow at a CAGR of 3.9% from 2022 to 2032.

Impact of Interferon Biosimilars on Market Expansion

As therapy with biologics is expensive, it is imposing significant financial pressure on the healthcare system globally. The increasing prevalence of cancer, hepatitis, and multiple sclerosis is creating a new opportunity for key players to assess biosimilar clinical applications.

On account of this, several pharmaceutical companies are developing interferon biosimilar medications to compete with or replace the original products, as well as more expensive brands. Increasing investments in Research and Development and ongoing advancements in technology are some of the other factors contributing to growth in the global interferons market.

Key Restraints Affecting Demand in the Interferons Market

The development process of interferons is more expensive than chemically-derived small molecules. Also, it involves higher operating costs and requires a larger capital investment. It is attributed to the need for premium-quality manufacturing techniques as biological medications are more complicated than small molecules.

Companies must submit in-depth information to prove the safety and effectiveness of biologics in pre-clinical and clinical studies in order to get approvals. Consequently, biologics licensing is a high cost incurring and time-consuming process, which may hamper growth.

Due to significant Research and Development costs and a lengthy testing and manufacturing process, marketed pharmaceuticals would be priced far higher than actual manufacturing costs. Therefore, demand for interferons may decline during the forecast period from 2022 to 2032.

Analysis of Top Countries Using Interferons

What Makes the USA the Dominant Market for Interferons?

High Prevalence of Cancer to Push Growth in the USA

The USA rules the North American interferons market and it generated a share of about 92.8% in 2021. The rising prevalence of cancer and hepatitis in the USA is one of the most significant factors that would foster growth in the country.

As per the Centers for Disease Control and Prevention (CDC), nearly 1,752,735 new cancer cases were reported in the USA in 2019 and about 599,589 people died of the disease in the same year. Thus, rising government support to healthcare facilities in terms of funding is expected to propel Research and Development activities in the USA for the launch of unique interferons.

Why is the United Kingdom Considered to Be a Lucrative Market for Interferons in Europe?

Rapid Acceptance of Human Interferons to Augment Growth

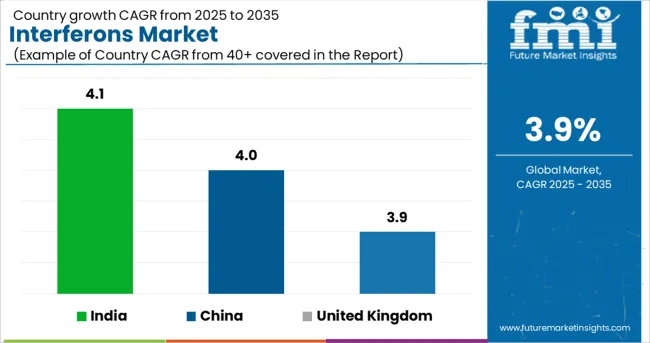
The United Kingdom is set to exhibit a CAGR of nearly 3.9% in the Europe interferons market during the forecast period. Government initiatives to increase healthcare expenditure and acceptance of interferon therapy in the country are likely to boost the market during the evaluation period from 2022 to 2032.

What Makes China an Emerging Market for Interferons?

Ongoing Trials to Develop Interferon Biosimilar Medications to Aid Growth

China held nearly 43.4% share in the East Asia interferons market in 2021 and is projected to grow at a CAGR of 4.0% during the forecast period. Growth is attributed to the increasing number of HCV cases in the country, which have been identified as a result of ongoing trials on various pharmacological candidates, including interferons.

Growing healthcare expenditure and rapid development of medical infrastructure are likely to propel market expansion in China over the next few years.

What is the India Interferons Market Outlook?

Manufacturers Are Developing Nebulized Products for TB Screening

India generated around 45.3% of the share in the South Asia interferons market in 2021 and is projected to showcase a CAGR of 4.1% during the forecast period. Growth is primarily attributed to surging awareness of the availability of advanced treatment options, including interferons among patients.

The ongoing development of relatively low-cost interferon-gamma release assays for latent tuberculosis infection screening is expected to drive the Indian market. These assays are set to be widely adopted in low- and middle-income parts of India.

Interferons Industry Analysis by Top Investment Segments

Which is the Highly Preferred Product in the Interferons Market?

Interferon-Beta to Gain Impetus with Usage in Multiple Sclerosis Treatment

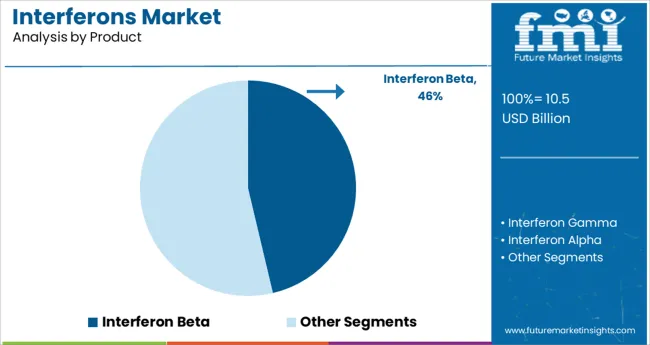
By product, the interferon beta segment held a share of around 47.2% in 2021 in the global interferons market. Interferon beta therapy is widely adopted for indications and management of multiple sclerosis, which would propel its demand. Also, such therapies have proven to be effective in the management of the disease.

Which Indication is Set to Gain Traction in the Interferons Market?

Patients of Multiple Sclerosis to Opt for Orally Administered Drugs

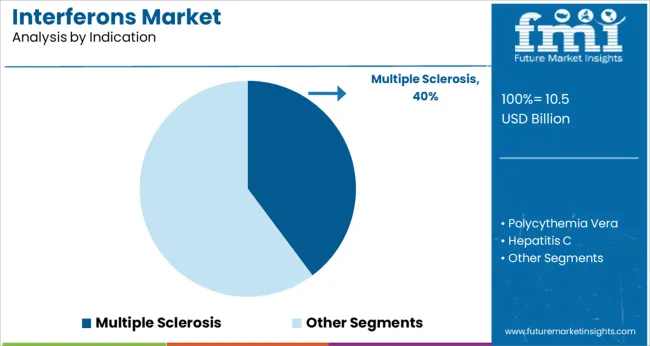
Based on indication, the multiple sclerosis segment held nearly 35.0% of the global interferons market share in 2021 and is expected to remain at the forefront throughout the forthcoming years. Rapid advancements in novel orally administered drugs approved for the treatment of multiple sclerosis are set to create new growth opportunities for key players in the market.

Which is the Leading End User in the Interferons Market?

Hospital Pharmacies to Push Demand for Biologics

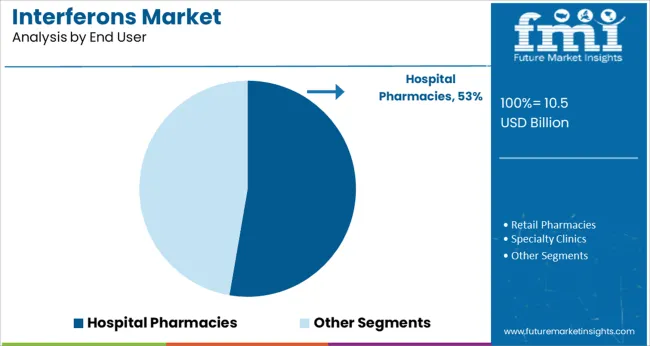
In terms of end use, the hospital pharmacies segment generated around 43.5% of the global interferons market share in 2021. Hospital pharmacies are considered to be the most lucrative segment in terms of dispensing prescribed medications and consumables to patients.

Several medicinal administrations require the presence of a trained physician. Therefore, a hospital setting is expected to gain traction in terms of sales and adoption of medicinal compounds by consumers.
Competitive Landscape of the Interferons Market

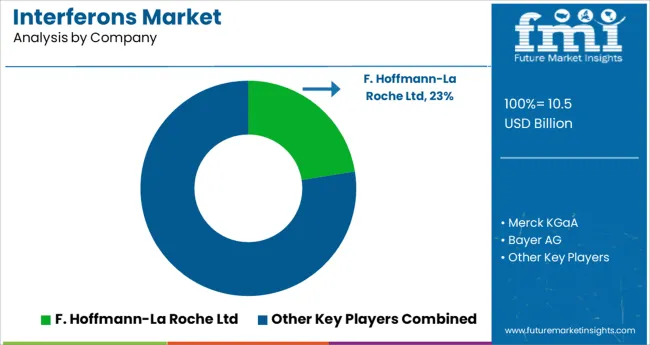
Key players in the global interferons market are focusing on collaborations, geographic expansions, and improvement of their product offerings to gain a competitive edge. These strategies will help market players to enhance product portfolios and strengthen their presence worldwide.

Given below are a few examples of key industry developments by renowned manufacturers:

  • In May 2021, Sandoz, a subsidiary of Novartis announced the expansion of its production capabilities in Europe to strengthen the European antibiotic manufacturing facility.
  • In December 2021, Biogen and TheraPanacea signed a new collaboration agreement to improve digital health for personalized medicine in neuroscience.

Scope and Coverage of the Interferons Market Report

Attribute Details
Estimated Market Size (2021) USD 9.1 Billion
Projected Market Valuation (2032) USD 13.8 Billion
Value-based CAGR (2022 to 2032) 3.9%
Forecast Period 2022 to 2032
Historical Data Available for 2017 to 2021
Market Analysis USD Million for Value
Key Regions Covered North America; Latin America; Europe; South Asia; East Asia; Oceania; and the Middle East & Africa
Key Countries Covered USA, Canada, Brazil, Mexico, Argentina, Germany, Italy, France, United Kingdom, Spain, BENELUX, Russia, China, Japan, South Korea, India, Thailand, Malaysia, Indonesia, Australia, New Zealand, GCC countries, Turkey, South Africa, and North Africa.
Key Market Segments Covered Product, Indication, End User, and Region
Key Companies Profiled Roche; Merck & Co.; Bristol-Myers Squibb; Biogen Inc.; Bayer AG; Zydus Cadila; Novartis AG; Pfizer Inc.; Biosidus; Synairgen; Nanogen; Amega Biotech; Rhein Minapharm Biogenetics; PROBIOMED; Schering-Plough Corporation; 3Sbio; F. Hoffmann La-Roche Ltd.

Top Segments Studied in the Interferons Market by Category

By Product:

  • Interferon Gamma
  • Interferon Beta
  • Interferon Alpha

By Indication:

  • Multiple Sclerosis
  • Polycythemia Vera
  • Hepatitis C
  • Melanoma
  • Chronic Granulomatous Disease (CGD)
  • Other Indications

By End User:

  • Hospital Pharmacies
  • Retail Pharmacies
  • Specialty Clinics
  • Online Pharmacies

By Region:

  • North America
  • Latin America
  • Europe
  • South Asia
  • East Asia
  • Oceania
  • The Middle East and Africa

Table of Content

  • 1. Executive Summary
  • 2. Market Overview
  • 3. Key Market Trends
  • 4. Key Success Factors
  • 5. Market Background
  • 6. Global Market Demand (in Value or Size in USD Billion) Analysis 2017 to 2021 and Forecast, 2022 to 2032
  • 7. Global Market Analysis 2017 to 2021 and Forecast 2022 to 2032, by Product
    • 7.1. Interferon Gamma
    • 7.2. Interferon Beta
    • 7.3. Interferon Alpha
  • 8. Global Market Analysis 2017 to 2021 and Forecast 2022 to 2032, By Indication
    • 8.1. Multiple Sclerosis
    • 8.2. Polycythemia Vera
    • 8.3. Hepatitis C
    • 8.4. Melanoma
    • 8.5. Chronic Granulomatous Disease (CGD)
    • 8.6. Other Indications
  • 9. Global Market Analysis 2017 to 2021 and Forecast 2022 to 2032, by End User
    • 9.1. Hospital Pharmacies
    • 9.2. Retail Pharmacies
    • 9.3. Specialty Clinics
    • 9.4. Online Pharmacies
  • 10. Global Market Analysis 2017 to 2021 and Forecast 2022 to 2032, by Region
    • 10.1. North America
    • 10.2. Latin America
    • 10.3. Europe
    • 10.4. East Asia
    • 10.5. South Asia
    • 10.6. Oceania
    • 10.7. Middle East and Africa
  • 11. North America Market Analysis 2017 to 2021 and Forecast 2022 to 2032
  • 12. Latin America Market Analysis 2017 to 2021 and Forecast 2022 to 2032
  • 13. Europe Market Analysis 2017 to 2021 and Forecast 2022 to 2032
  • 14. East Asia Market Analysis 2017 to 2021 and Forecast 2022 to 2032
  • 15. South Asia Market Analysis 2017 to 2021 and Forecast 2022 to 2032
  • 16. Oceania Market 2017 to 2021 and Forecast 2022 to 2032
  • 17. Middle East and Africa Market Analysis 2017 to 2021 and Forecast 2022 to 2032
  • 18. Market Structure Analysis
  • 19. Competition Analysis
    • 19.1. F. Hoffmann-La Roche Ltd
    • 19.2. Merck KGaA
    • 19.3. Bayer AG
    • 19.4. Biogen
    • 19.5. GenSci
    • 19.6. Sinovac
    • 19.7. BioLegend
    • 19.8. Invitrogen
    • 19.9. OriGene
    • 19.10. Biorbyt
    • 19.11. Qilu Pharmaceutical
    • 19.12. Shijiazhuang Pharmaceutical
    • 19.13. Amgen Inc
    • 19.14. Johnson & Johnson
    • 19.15. Kyowa Hakko Kirin
    • 19.16. Bristol-Myers Squibb
    • 19.17. Zydus Cadila
    • 19.18. Novartis AG
    • 19.19. Pfizer Inc
    • 19.20. Amega Biotech
    • 19.21. 3Sbio
    • 19.22. Biosidus
    • 19.23. Nanogen
  • 20. Assumptions and Acronyms Used
  • 21. Research Methodology

List of Tables

Table 01: Global Market Value (US$ Billion) Analysis 2017 to 2021 and Forecast 2022 to 2032, by Product

Table 02: Global Market Value (US$ Billion) Analysis 2017 to 2021 and Forecast 2022 to 2032, by Indication

Table 03: Global Market Value (US$ Billion) Analysis 2017 to 2021 and Forecast 2022 to 2032, by End User

Table 04: Global Market Value (US$ Billion) Analysis 2017 to 2021 and Forecast 2022 to 2032, by Region

Table 05: North America Market Value (US$ Billion) Analysis 2017 to 2021 and Forecast 2022 to 2032, by Country

Table 06: North America Market Value (US$ Billion) Analysis 2017 to 2021 and Forecast 2022 to 2032, by Product

Table 07: North America Market Value (US$ Billion) Analysis 2017 to 2021 and Forecast 2022 to 2032, by Indication

Table 08: North America Market Value (US$ Billion) Analysis 2017 to 2021 and Forecast 2022 to 2032, by End User

Table 09: Latin America Market Value (US$ Billion) Analysis 2017 to 2021 and Forecast 2022 to 2032, by Country

Table 10: Latin America Market Value (US$ Billion) Analysis 2017 to 2021 and Forecast 2022 to 2032, by Product

Table 11: Latin America Market Value (US$ Billion) Analysis 2017 to 2021 and Forecast 2022 to 2032, by Indication

Table 12: Latin America Market Value (US$ Billion) Analysis 2017 to 2021 and Forecast 2022 to 2032, by End User

Table 13: Europe Market Value (US$ Billion) Analysis 2017 to 2021 and Forecast 2022 to 2032, by Country

Table 14: Europe Market Value (US$ Billion) Analysis 2017 to 2021 and Forecast 2022 to 2032, by Product

Table 15: Europe Market Value (US$ Billion) Analysis 2017 to 2021 and Forecast 2022 to 2032, by Indication

Table 16: Europe Market Value (US$ Billion) Analysis 2017 to 2021 and Forecast 2022 to 2032, by End User

Table 17: South Asia Market Value (US$ Billion) Analysis 2017 to 2021 and Forecast 2022 to 2032, by Country

Table 18: South Asia Market Value (US$ Billion) Analysis 2017 to 2021 and Forecast 2022 to 2032, by Product

Table 19: South Asia Market Value (US$ Billion) Analysis 2017 to 2021 and Forecast 2022 to 2032, by Indication

Table 20: South Asia Market Value (US$ Billion) Analysis 2017 to 2021 and Forecast 2022 to 2032, by End User

Table 21: East Asia Market Value (US$ Billion) Analysis 2017 to 2021 and Forecast 2022 to 2032, by Country

Table 22: East Asia Market Value (US$ Billion) Analysis 2017 to 2021 and Forecast 2022 to 2032, by Product

Table 23: East Asia Market Value (US$ Billion) Analysis 2017 to 2021 and Forecast 2022 to 2032, by Indication

Table 24: East Asia Market Value (US$ Billion) Analysis 2017 to 2021 and Forecast 2022 to 2032, by End User

Table 25: Oceania Market Value (US$ Billion) Analysis 2017 to 2021 and Forecast 2022 to 2032, by Country

Table 26: Oceania Market Value (US$ Billion) Analysis 2017 to 2021 and Forecast 2022 to 2032, by Product

Table 27: Oceania Market Value (US$ Billion) Analysis 2017 to 2021 and Forecast 2022 to 2032, by Indication

Table 28: Oceania Market Value (US$ Billion) Analysis 2017 to 2021 and Forecast 2022 to 2032, by End User

Table 29: Middle East and Africa Market Value (US$ Billion) Analysis 2017 to 2021 and Forecast 2022 to 2032, by Country

Table 30: Middle East and Africa Market Value (US$ Billion) Analysis 2017 to 2021 and Forecast 2022 to 2032, by Product

Table 31: Middle East and Africa Market Value (US$ Billion) Analysis 2017 to 2021 and Forecast 2022 to 2032, by Indication

Table 32: Middle East and Africa Market Value (US$ Billion) Analysis 2017 to 2021 and Forecast 2022 to 2032, by End User

List of Figures

Figure 01: Global Market Value Analysis (US$ Billion), 2017 to 2021

Figure 02: Global Market Value Forecast (US$ Billion), 2022 to 2032

Figure 03: Global Market Absolute $ Opportunity, 2022 to 2032

Figure 04: Global Market Share Analysis (%), by Product, 2022 & 2032

Figure 05: Global Market Y-o-Y Analysis (%), by Product, 2022 to 2032

Figure 06: Global Market Attractiveness Analysis by Product, 2022 to 2032

Figure 07: Global Market Share Analysis (%), by Indication, 2022 & 2032

Figure 08: Global Market Y-o-Y Analysis (%), by Indication, 2022 to 2032

Figure 09: Global Market Attractiveness Analysis by Indication, 2022 to 2032

Figure 10: Global Market Share Analysis (%), by End User, 2019 & 2029

Figure 11: Global Market Y-o-Y Analysis (%), by End User, 2022 to 2032

Figure 12: Global Market Attractiveness Analysis by End User, 2022 to 2032

Figure 13: Global Market Share Analysis (%), by Region, 2022 & 2032

Figure 14: Global Market Y-o-Y Analysis (%), by Region, 2022 to 2032

Figure 15: Global Market Attractiveness Analysis, by Region, 2022 to 2032

Figure 16: North America Market Value Share, Product, 2022 (E)

Figure 17: North America Market Value Share, by Indication, 2022 (E)

Figure 18: North America Market Value Share, by End User, 2022 (E)

Figure 19: North America Market Value Share, by Country, 2022 (E)

Figure 20: North America Market Value Analysis (US$ Billion), 2017 to 2021

Figure 21: North America Market Value Forecast (US$ Billion), 2022 to 2032

Figure 22: North America Market Attractiveness Analysis by Product, 2022 to 2032

Figure 23: North America Market Attractiveness Analysis by Indication, 2022 to 2032

Figure 24: North America Market Attractiveness Analysis by End User, 2022 to 2032

Figure 25: North America Market Attractiveness Analysis by Country, 2022 to 2032

Figure 26: Latin America Market Value Share, Product, 2022 (E)

Figure 27: Latin America Market Value Share, by Indication, 2022 (E)

Figure 28: Latin America Market Value Share, by End User, 2022 (E)

Figure 29: Latin America Market Value Share, by Country, 2022 (E)

Figure 30: Latin America Market Value Analysis (US$ Billion), 2017 to 2021

Figure 31: Latin America Market Value Forecast (US$ Billion), 2022 to 2032

Figure 32: Latin America Market Attractiveness Analysis by Product, 2022 to 2032

Figure 33: Latin America Market Attractiveness Analysis by Indication, 2022 to 2032

Figure 34: Latin America Market Attractiveness Analysis by End User, 2022 to 2032

Figure 35: Latin America Market Attractiveness Analysis by Country, 2022 to 2032

Figure 36: Europe Market Value Share, Product, 2022 (E)

Figure 37: Europe Market Value Share, by Indication, 2022 (E)

Figure 38: Europe Market Value Share, by End User, 2022 (E)

Figure 39: Europe Market Value Share, by Country, 2022 (E)

Figure 40: Europe Market Value Analysis (US$ Billion), 2017 to 2021

Figure 41: Europe Market Value Forecast (US$ Billion), 2022 to 2032

Figure 42: Europe Market Attractiveness Analysis by Product, 2022 to 2032

Figure 43: Europe Market Attractiveness Analysis by Indication, 2022 to 2032

Figure 44: Europe Market Attractiveness Analysis by End User, 2022 to 2032

Figure 45: Europe Market Attractiveness Analysis by Country, 2022 to 2032

Figure 46: South Asia Market Value Share, Product, 2022 (E)

Figure 47: South Asia Market Value Share, by Indication, 2022 (E)

Figure 48: South Asia Market Value Share, by End User, 2022 (E)

Figure 49: South Asia Market Value Share, by Country, 2022 (E)

Figure 50: South Asia Market Value Analysis (US$ Billion), 2017 to 2021

Figure 51: South Asia Market Value Forecast (US$ Billion), 2022 to 2032

Figure 52: South Asia Market Attractiveness Analysis by Product, 2022 to 2032

Figure 53: South Asia Market Attractiveness Analysis by Indication, 2022 to 2032

Figure 54: South Asia Market Attractiveness Analysis by End User, 2022 to 2032

Figure 55: South Asia Market Attractiveness Analysis by Country, 2022 to 2032

Figure 56: East Asia Market Value Share, Product, 2022 (E)

Figure 57: East Asia Market Value Share, by Indication, 2022 (E)

Figure 58: East Asia Market Value Share, by End User, 2022 (E)

Figure 59: East Asia Market Value Share, by Country, 2022 (E)

Figure 60: East Asia Market Value Analysis (US$ Billion), 2017 to 2021

Figure 61: East Asia Market Value Forecast (US$ Billion), 2022 to 2032

Figure 62: East Asia Market Attractiveness Analysis by Product, 2022 to 2032

Figure 63: East Asia Market Attractiveness Analysis by Indication, 2022 to 2032

Figure 64: East Asia Market Attractiveness Analysis by End User, 2022 to 2032

Figure 65: East Asia Market Attractiveness Analysis by Country, 2022 to 2032

Figure 66: Oceania Market Value Share, Product, 2022 (E)

Figure 67: Oceania Market Value Share, by Indication, 2022 (E)

Figure 68: Oceania Market Value Share, by End User, 2022 (E)

Figure 69: Oceania Market Value Share, by Country, 2022 (E)

Figure 70: Oceania Market Value Analysis (US$ Billion), 2017 to 2021

Figure 71: Oceania Market Value Forecast (US$ Billion), 2022 to 2032

Figure 72: Oceania Market Attractiveness Analysis by Product, 2022 to 2032

Figure 73: Oceania Market Attractiveness Analysis by Indication, 2022 to 2032

Figure 74: Oceania Market Attractiveness Analysis by End User, 2022 to 2032

Figure 75: Oceania Market Attractiveness Analysis by Country, 2022 to 2032

Figure 76: Middle East and Africa Market Value Share, Product, 2022 (E)

Figure 77: Middle East and Africa Market Value Share, by Indication, 2022 (E)

Figure 78: Middle East and Africa Market Value Share, by End User, 2022 (E)

Figure 79: Middle East and Africa Market Value Share, by Country, 2022 (E)

Figure 80: Middle East and Africa Market Value Analysis (US$ Billion), 2017 to 2021

Figure 81: Middle East and Africa Market Value Forecast (US$ Billion), 2022 to 2032

Figure 82: Middle East and Africa Market Attractiveness Analysis by Product, 2022 to 2032

Figure 83: Middle East and Africa Market Attractiveness Analysis by Indication, 2022 to 2032

Figure 84: Middle East and Africa Market Attractiveness Analysis by End User, 2022 to 2032

Figure 85: Middle East and Africa Market Attractiveness Analysis by Country, 2022 to 2032

Figure 86: Global Market Value Proportion Analysis, by Countries, 2022

Figure 87: Global Market, Global Vs. Country Growth Y-o-Y (%) Comparison, 2022 to 2032

Figure 88: USA Market Share Analysis (%) by Product, 2022 & 2032

Figure 89: USA Market Share Analysis (%) by Indication, 2022 & 2032

Figure 90: USA Market Share Analysis (%) by End User, 2022 & 2032

Figure 91: Canada Market Share Analysis (%) by Product, 2022 & 2032

Figure 92: Canada Market Share Analysis (%) by Indication, 2022 & 2032

Figure 93: Canada Market Share Analysis (%) by End User, 2022 & 2032

Figure 94: Brazil Market Share Analysis (%) by Product, 2022 & 2032

Figure 95: Brazil Market Share Analysis (%) by Indication, 2022 & 2032

Figure 96: Brazil Market Share Analysis (%) by End User, 2022 & 2032

Figure 97: Mexico Market Share Analysis (%) by Product, 2022 & 2032

Figure 98: Mexico Market Share Analysis (%) by Indication, 2022 & 2032

Figure 99: Mexico Market Share Analysis (%) by End User, 2022 & 2032

Figure 100: Argentina Market Share Analysis (%) by Product, 2022 & 2032

Figure 101: Argentina Market Share Analysis (%) by Indication, 2022 & 2032

Figure 102: Argentina Market Share Analysis (%) by End User, 2022 & 2032

Figure 103: United Kingdom Market Share Analysis (%) by Product, 2022 & 2032

Figure 104: United Kingdom Market Share Analysis (%) by Indication, 2022 & 2032

Figure 105: United Kingdom Market Share Analysis (%) by End User, 2022 & 2032

Figure 106: Germany Market Share Analysis (%) by Product, 2022 & 2032

Figure 107: Germany Market Share Analysis (%) by Indication, 2022 & 2032

Figure 108: Germany Market Share Analysis (%) by End User, 2022 & 2032

Figure 109: Italy Market Share Analysis (%) by Product, 2022 & 2032

Figure 110: Italy Market Share Analysis (%) by Indication, 2022 & 2032

Figure 111: Italy Market Share Analysis (%) by End User, 2022 & 2032

Figure 112: France Market Share Analysis (%) by Product, 2022 & 2032

Figure 113: France Market Share Analysis (%) by Indication, 2022 & 2032

Figure 114: France Market Share Analysis (%) by End User, 2022 & 2032

Figure 115: Spain Market Share Analysis (%) by Product, 2022 & 2032

Figure 116: Spain Market Share Analysis (%) by Indication, 2022 & 2032

Figure 117: Spain Market Share Analysis (%) by End User, 2022 & 2032

Figure 118: Russia Market Share Analysis (%) by Product, 2022 & 2032

Figure 119: Russia Market Share Analysis (%) by Indication, 2022 & 2032

Figure 120: Russia Market Share Analysis (%) by End User, 2022 & 2032

Figure 121: China Market Share Analysis (%) by Product, 2022 & 2032

Figure 122: China Market Share Analysis (%) by Indication, 2022 & 2032

Figure 123: China Market Share Analysis (%) by End User, 2022 & 2032

Figure 124: Japan Market Share Analysis (%) by Product, 2022 & 2032

Figure 125: Japan Market Share Analysis (%) by Indication, 2022 & 2032

Figure 126: Japan Market Share Analysis (%) by End User, 2022 & 2032

Figure 127: South Korea Market Share Analysis (%) by Product, 2022 & 2032

Figure 128: South Korea Market Share Analysis (%) by Indication, 2022 & 2032

Figure 129: South Korea Market Share Analysis (%) by End User, 2022 & 2032

Figure 130: India Market Share Analysis (%) by Product, 2022 & 2032

Figure 131: India Market Share Analysis (%) by Indication, 2022 & 2032

Figure 132: India Market Share Analysis (%) by End User, 2022 & 2032

Figure 133: Thailand Market Share Analysis (%) by Product, 2022 & 2032

Figure 134: Thailand Market Share Analysis (%) by Indication, 2022 & 2032

Figure 135: Thailand Market Share Analysis (%) by End User, 2022 & 2032

Figure 136: Indonesia Market Share Analysis (%) by Product, 2022 & 2032

Figure 137: Indonesia Market Share Analysis (%) by Indication, 2022 & 2032

Figure 138: Indonesia Market Share Analysis (%) by End User, 2022 & 2032

Figure 139: Malaysia Market Share Analysis (%) by Product, 2022 & 2032

Figure 140: Malaysia Market Share Analysis (%) by Indication, 2022 & 2032

Figure 141: Malaysia Market Share Analysis (%) by End User, 2022 & 2032

Figure 142: Australia Market Share Analysis (%) by Product, 2022 & 2032

Figure 143: Australia Market Share Analysis (%) by Indication, 2022 & 2032

Figure 144: Australia Market Share Analysis (%) by End User, 2022 & 2032

Figure 145: New Zealand Market Share Analysis (%) by Product, 2022 & 2032

Figure 146: New Zealand Market Share Analysis (%) by Indication, 2022 & 2032

Figure 147: New Zealand Market Share Analysis (%) by End User, 2022 & 2032

Figure 148: South Africa Market Share Analysis (%) by Product, 2022 & 2032

Figure 149: South Africa Market Share Analysis (%) by Indication, 2022 & 2032

Figure 150: South Africa Market Share Analysis (%) by End User, 2022 & 2032

Figure 151: GCC Countries Market Share Analysis (%) by Product, 2022 & 2032

Figure 152: GCC Countries Market Share Analysis (%) by Indication, 2022 & 2032

Figure 153: GCC Countries Market Share Analysis (%) by End User, 2022 & 2032

Figure 154: Turkey Market Share Analysis (%) by Product, 2022 & 2032

Figure 155: Turkey Market Share Analysis (%) by Indication, 2022 & 2032

Figure 156: Turkey Market Share Analysis (%) by End User, 2022 & 2032

Figure 157: North Africa Market Share Analysis (%) by Product, 2022 & 2032

Figure 158: North Africa Market Share Analysis (%) by Indication, 2022 & 2032

Figure 159: North Africa Market Share Analysis (%) by End User, 2022 & 2032

Frequently Asked Questions

How much was the global interferons market worth in 2021?

The global interferons market was worth USD 9.1 Billion in 2021 and is set to expand 1.5X over the next ten years.

What is the sales forecast for interferons through 2032?

The interferons market is expected to reach USD 13.8 Billion by the end of 2032 and register a 3.9% CAGR from 2022 to 2032.

Which are the key trends shaping the interferons industry?

The increasing focus of companies on the development of novel interferon beta and ongoing Research and Development investments are some of the key trends shaping the interferons industry.

Which are the top 5 countries driving demand for interferons?

The USA, Germany, the United Kingdom, China, and Japan are the top 5 countries expected to drive demand for interferons.

What is the USA interferons market outlook?

The USA accounted for nearly 92.8% of the North American interferons market in 2021.

How is the interferons market progressing in Europe?

The Europe interferons market is expected to register growth at a CAGR of 3.7% over the next ten years.

Which countries are key producers of interferons products?

The USA, Germany, and Japan are key producers of interferon products.

Which are the key companies in the interferons market?

Roche, Merck & Co., Bristol-Myers Squibb, Biogen Inc., Bayer AG, Zydus Cadila, Novartis AG, Pfizer Inc., Biosidus, Synairgen, Nanogen, and Amega Biotech are the key companies in the interferons market.

Future Market Insights

Interferons Market