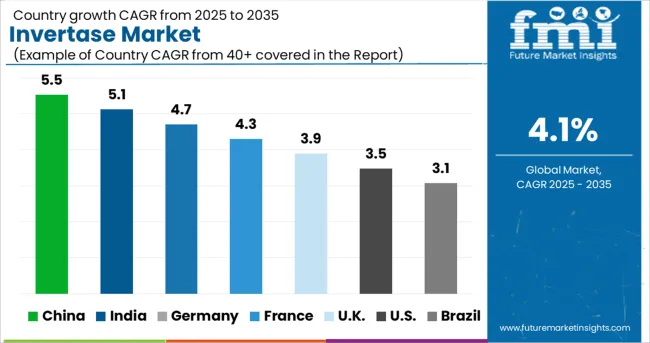
Invertase Market
Documented Antioxidant Functions and Strengthening of Body Immunity to widen Invertase Applications
Invertase Market by End user, Source, Distribution Channel & Region – Forecast 2023–2033
Invertase Market Outlook (2023-2033)
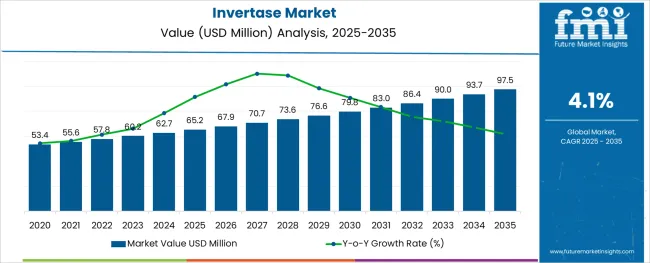
According to Future Market Insights research, during the projected period, the Invertase market is expected to grow at a CAGR of 5.30%. The market value is projected to increase from US$ 60.2Mn in 2023 to US$ 101.0 Mn by 2033. The Invertase market was valued at US$ 57.6 Mn at the end of 2021 and is anticipated to exhibit CAGR growth of 4.60% in 2016-2021.
Market Size Value in 2023 |
US$ 60.2 Mn |
Market Forecast Value in 2033 |
US$ 101.0 Mn |
Global Growth Rate (2023 to 2033) |
5.30% CAGR |
Forecast Period |
2023-2033 |
CAGR of UK in Europe |
4.10% |
Let us know your requirement to get
100% FREE customization
Introduction
Complex molecules called enzymes act as bio-catalysts in living tissue to improve metabolic processes. A carbohydrate enzyme that helps with digestion is invertase. Additionally known as beta-fructo-furanosidase. The Saccharomyces cerevisiae strain also referred to as baker's yeast, is the source of invertase. Fructose and glucose are produced when sucrose is broken down into its two parts with the help of invertase.
Once purified, it can be used alone or in conjunction with other enzymes. When combined, it facilitates the breakdown of starch, sugar, and other carbohydrate types. It is widely accessible from both plants and microorganisms. There are many uses for invertase.
It helps control osmosis and plant immune defenses in addition to helping humans have a better immune system and acting as an antioxidant. Additionally, because it is obtained naturally, using organic ingredients in meal preparation is a preferred option among meat producers.
Comparing historical outlook and projections for the world's Invertase
A new report published by Future market insights, titled, "Invertase Market -Global Opportunity Analysis and Industry Forecast, 2023-2033," projects the global Invertase market to reach US$101.0 Mn by 2033 and is expected to grow at a CAGR of 5.30% from 2023 to 2033.
Find your sweet spots for generating winning opportunities in this market.
Talk to AnalystCountry-wise Insights
What is the outlook of Asia – Pacific in the market of Invertase in the world?
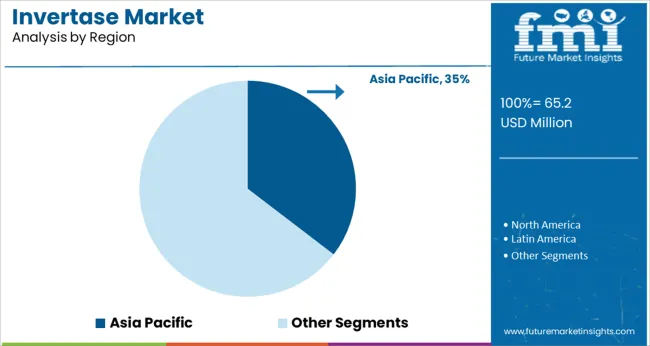
The Asia Pacific region offers a promising market for invertase since it provides an advantageous platform for studies and development. During the forecast timeframe, the Asia-Pacific bakery products market is expected to expand at a 6.6% CAGR. A burgeoning number of Western restaurants offering baked goods in metropolitan areas is also rapidly emerging, increasing demand for bakery products. This factor is expected to accelerate the expansion of the invertase market in this region.
Another significant driver of the market is a broader portfolio with several value-added products such as reduced sugar, enhanced nutrition, plant-based products, multiple distribution channels, and consumers' proclivity to buy off-the-shelf, particularly in this region's emerging markets.
What is the outlook of North America in the market of Invertase in the world?
Consumers prefer products that are naturally sourced, and since invertase is widely available in nature, industries in North America are using it to develop new food processing techniques.
Due to developments in food ingredients and technology, as well as rising regional consumption, the United States is anticipated to overwhelm the market in North America. The market is dominated by the United States, which is also driving the market's expansion in North America. With favorable annual growth during the forecast period, Canada is dominant due to a region's booming emerging economies and peoples' lifestyles. A market share of 38.0% of the worldwide invertase market is held by North America.
What is the outlook of Europe in the market of Invertase in the world?
The European invertase business has a well-developed supply chain, a wide range of products, effective distribution methods, and consumer preferences. Cakes, baked goods, and cookies are among the categories of decadence that have seen an increase in new innovation and product development.
The growth of the invertase industry in Europe, which would be cruising the expansion of the industry under consideration, is accelerated by rising consumer consciousness of health-conscious products and broadening demand for processed foods. Sales have increased as a result of several health claims related to bakery products, including "organic," "no flavorings," and "low/no/reduced allergen." On the global invertase market, Europe has a 24.5% market share.
Category-wise Insights
What are the major drivers for Invertase in Market?
Significant progress has been made in improving how different enzymes and their properties are operationally evaluated. The market for invertase is growing as a result. Invertase is widely utilized as an food ingredient and is frequently utilized as a invert sugar with in production of candy bars and commercial cooking due to its ability to retain humidity for extended periods of time.
It can be used to make a highly crystalline syrup, also known as inverted syrup, because it is hygroscopic. Invertase also facilitates the acquisition of alcohols, glycerin, and lactic acid during the sucrose fermentation process. The business for invertase enzymes has seemed to be experiencing opportunistic growth as a result of rising customer demands for novel solutions, particularly in the industries of food and beverages.
Additionally, invertase is used to improve digestion, boost the immune system, support antioxidants, and fight cancer. Invertase can also function in a variety of pH conditions. Its relevance to the pharmaceutical sector thus expands. As a result, numerous uses contribute to the invertase market's fast expansion.
What are the restraints different types of Invertase?
The invertase enzyme, on the other hand, can cause vomiting, diarrhea, and fatigue. Additionally, it may lead to diabetes, so invertase-containing products are not advised for diabetic patients.
As a result, in areas where the prevalence of diabetes is high, the growth of invertase sales may be constrained. Enzyme coupling is also fairly expensive. As a result, its applicability to various industries may decline, which would restrain the market's growth for invertase.

A unified Market Research Subscription Platform, built for today's disparate research needs.
Major segmentized utilization of Invertase
It can be discovered in many personal care items, such as hair products, shampoos, hair dyes, as well as styling products. Additionally, invertase is found in beauty products to help break down dry skin and hasten cell turnover. Cosmetics contain invertase as a food preservation and fragrance component. The products for personal care market are anticipated to experience significant demand as a result of the expansion in the invertase sector.
Plant invertase is a renowned class of enzymes that catalyzes the conversion of sucrose into glucose and fructose. They have been found in numerous plant tissues and are important for the growth and metabolism of plants. In the upcoming years, it is anticipated that the plant invertase market will grow.
Supermarket and Industrial Distributors Are Propelling the Growth Invertase in Market
The Invertase in market is expected to grow at a CAGR of 5.30% during the forecast period of 2023-2033. The growth of Invertase in the market is being propelled by supermarket and industrial distributors. It is a natural enzyme that is used as a food ingredient to sweeten food items, as well as for other applications such as brewing beer. Invertase has seen an increase in demand due to its wide range of uses and its ability to be tailored to suit various needs. Supermarket and industrial distributors are helping this growth by making it more accessible across the world.
Supermarket and industrial distributors have been introducing Invertase into their product portfolios, allowing customers greater access than ever before. Furthermore, these distributors are offering Invertase at competitive prices so that companies can purchase it with ease. This has resulted in increased availability of the enzyme for both commercial use and home cooking alike.
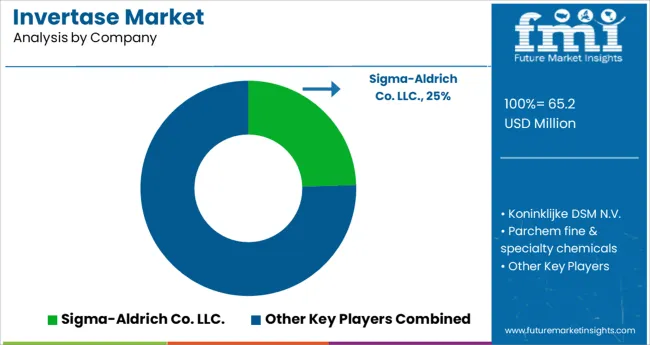
Competitive Landscape
To boost their sales and acquire a competitive advantage in the global invertase market, these major invertase providers are implementing a variety of strategies, including new product developments and approvals, partnerships, cooperation, acquisitions, mergers, etc.
For example, the EZ-Yeast TM Transformation Kit from MP Biomedical, which was introduced in June 2021, is designed for high-throughput transformation and can produce up to 103 transformants per g of plasmid DNA.
In order to satisfy any taste preferences, Koninklijke DSM launched the N.V.Maxarome line of specialized fermentation extracts in February 2022. These extracts feature taste-building elements that enhance the overall flavour and aroma and intensify salty, thick, and umami tastes.
Invertase Market Report Scope
Attribute |
Details |
Forecast Period |
2023-2033 |
Historical Data Available for |
2017-2023 |
Market Analysis |
US$ Mn for Value and Units for Volume |
Key Regions Covered |
|
Key Countries Covered |
|
Key Segments Covered |
|
Key Companies Profiled |
|
Report Coverage |
Market Forecast, Company Share Analysis, Competitive Landscape, DROT Analysis, Market Dynamics and Challenges, and Strategic Growth Initiatives |
Customization & Pricing |
Available upon Request |
Invertase Market is segmentation
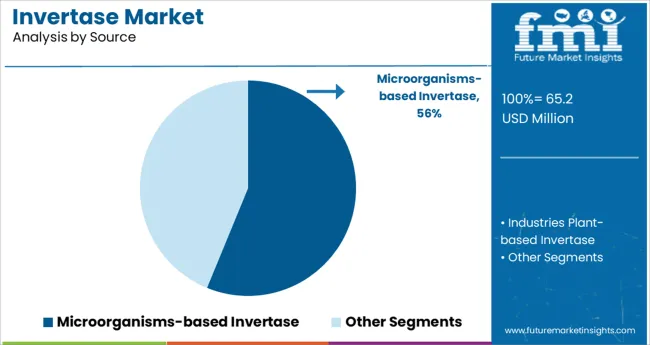
By Source the Invertase Market is segmented as:
- Industries Plant-based Invertase
- Microorganisms-based Invertase
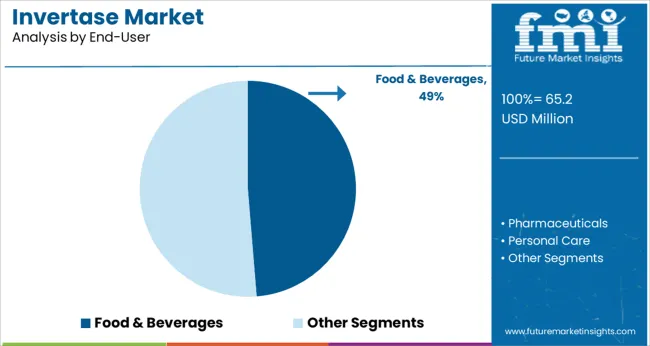
By End -User, the Invertase Market is segmented as:
- Food & Beverages
- Pharmaceuticals
- Personal Care
- Other
By Region, the Invertase Market is segmented as:
- North America
- Latin America
- Europe
- Asia Pacific
- Oceania
- MEA
By Distribution channel, the Invertase Market is segmented as:
- Convenience Store
- Hypermarket/Supermarket
- Online
- Direct Selling
Frequently Asked Questions
The global Invertase market will reach a valuation of US$ 60.2 Mn by the end of 2023.
The global Invertase market is forecasted to surpass US$ 101.0 Mn by the end of 2033.
USA, Germany, Japan, China, India, Australia, UK are the major countries driving demand for Invertase Market.
The US Invertase Market is contributing 33.70% of total value share in global market.
The Germany Invertase Market is contributing 25.30% of total value share in global market.
In Japan Invertase Market is contributing 6.70% of total market share which values in year 2023.
In India Invertase Market is contributing 3.60% of CAGR for latest period.
In China Invertase Market is contributing 6.30% of CAGR for latest period.
In Australia Invertase Market is contributing 2.40% of total value share in global market.
Table of Content
1. Executive Summary
1.1. Global Market Outlook
1.2. Demand-side Trends
1.3. Supply-side Trends
1.4. Technology Roadmap Analysis
1.5. Analysis and Recommendations
2. Market Overview
2.1. Market Coverage / Taxonomy
2.2. Market Definition / Scope / Limitations
3. Market Background
3.1. Market Dynamics
3.1.1. Drivers
3.1.2. Restraints
3.1.3. Opportunity
3.1.4. Trends
3.2. Scenario Forecast
3.2.1. Demand in Optimistic Scenario
3.2.2. Demand in Likely Scenario
3.2.3. Demand in Conservative Scenario
3.3. Opportunity Map Analysis
3.4. Investment Feasibility Matrix
3.5. PESTLE and Porter’s Analysis
3.6. Regulatory Landscape
3.6.1. By Key Regions
3.6.2. By Key Countries
3.7. Regional Parent Market Outlook
4. Global Market Analysis 2017-2022 and Forecast, 2023-2033
4.1. Historical Market Size Value (US$ Mn) Analysis, 2017-2022
4.2. Current and Future Market Size Value (US$ Mn) Projections, 2023-2033
4.2.1. Y-o-Y Growth Trend Analysis
4.2.2. Absolute $ Opportunity Analysis
5. Global Market Analysis 2017-2022 and Forecast 2023-2033, By Industry
5.1. Introduction / Key Findings
5.2. Historical Market Size Value (US$ Mn) Analysis By Industry, 2017-2022
5.3. Current and Future Market Size Value (US$ Mn) Analysis and Forecast By Industry, 2023-2033
5.3.1. Food & Beverages
5.3.2. Pharmaceuticals
5.3.3. Personal Care
5.3.4. Others
5.4. Y-o-Y Growth Trend Analysis By Industry, 2017-2022
5.5. Absolute $ Opportunity Analysis By Industry, 2023-2033
6. Global Market Analysis 2017-2022 and Forecast 2023-2033, By Source
6.1. Introduction / Key Findings
6.2. Historical Market Size Value (US$ Mn) Analysis By Source, 2017-2022
6.3. Current and Future Market Size Value (US$ Mn) Analysis and Forecast By Source, 2023-2033
6.3.1. Plant
6.3.2. Microorganisms
6.4. Y-o-Y Growth Trend Analysis By Source, 2017-2022
6.5. Absolute $ Opportunity Analysis By Source, 2023-2033
7. Global Market Analysis 2017-2022 and Forecast 2023-2033, By Region
7.1. Introduction
7.2. Historical Market Size Value (US$ Mn) Analysis By Region, 2017-2022
7.3. Current Market Size Value (US$ Mn) Analysis and Forecast By Region, 2023-2033
7.3.1. North America
7.3.2. Latin America
7.3.3. Europe
7.3.4. South Asia
7.3.5. East Asia
7.3.6. Oceania
7.3.7. MEA
7.4. Market Attractiveness Analysis By Region
8. North America Market Analysis 2017-2022 and Forecast 2023-2033, By Country
8.1. Historical Market Size Value (US$ Mn) Trend Analysis By Market Taxonomy, 2017-2022
8.2. Market Size Value (US$ Mn) Forecast By Market Taxonomy, 2023-2033
8.2.1. By Country
8.2.1.1. U.S.
8.2.1.2. Canada
8.2.2. By Industry
8.2.3. By Source
8.3. Market Attractiveness Analysis
8.3.1. By Country
8.3.2. By Industry
8.3.3. By Source
8.4. Key Takeaways
9. Latin America Market Analysis 2017-2022 and Forecast 2023-2033, By Country
9.1. Historical Market Size Value (US$ Mn) Trend Analysis By Market Taxonomy, 2017-2022
9.2. Market Size Value (US$ Mn) Forecast By Market Taxonomy, 2023-2033
9.2.1. By Country
9.2.1.1. Brazil
9.2.1.2. Mexico
9.2.1.3. Rest of Latin America
9.2.2. By Industry
9.2.3. By Source
9.3. Market Attractiveness Analysis
9.3.1. By Country
9.3.2. By Industry
9.3.3. By Source
9.4. Key Takeaways
10. Europe Market Analysis 2017-2022 and Forecast 2023-2033, By Country
10.1. Historical Market Size Value (US$ Mn) Trend Analysis By Market Taxonomy, 2017-2022
10.2. Market Size Value (US$ Mn) Forecast By Market Taxonomy, 2023-2033
10.2.1. By Country
10.2.1.1. Germany
10.2.1.2. U.K.
10.2.1.3. France
10.2.1.4. Spain
10.2.1.5. Italy
10.2.1.6. Rest of Europe
10.2.2. By Industry
10.2.3. By Source
10.3. Market Attractiveness Analysis
10.3.1. By Country
10.3.2. By Industry
10.3.3. By Source
10.4. Key Takeaways
11. South Asia Market Analysis 2017-2022 and Forecast 2023-2033, By Country
11.1. Historical Market Size Value (US$ Mn) Trend Analysis By Market Taxonomy, 2017-2022
11.2. Market Size Value (US$ Mn) Forecast By Market Taxonomy, 2023-2033
11.2.1. By Country
11.2.1.1. India
11.2.1.2. Malaysia
11.2.1.3. Singapore
11.2.1.4. Thailand
11.2.1.5. Rest of South Asia
11.2.2. By Industry
11.2.3. By Source
11.3. Market Attractiveness Analysis
11.3.1. By Country
11.3.2. By Industry
11.3.3. By Source
11.4. Key Takeaways
12. East Asia Market Analysis 2017-2022 and Forecast 2023-2033, By Country
12.1. Historical Market Size Value (US$ Mn) Trend Analysis By Market Taxonomy, 2017-2022
12.2. Market Size Value (US$ Mn) Forecast By Market Taxonomy, 2023-2033
12.2.1. By Country
12.2.1.1. China
12.2.1.2. Japan
12.2.1.3. South Korea
12.2.2. By Industry
12.2.3. By Source
12.3. Market Attractiveness Analysis
12.3.1. By Country
12.3.2. By Industry
12.3.3. By Source
12.4. Key Takeaways
13. Oceania Market Analysis 2017-2022 and Forecast 2023-2033, By Country
13.1. Historical Market Size Value (US$ Mn) Trend Analysis By Market Taxonomy, 2017-2022
13.2. Market Size Value (US$ Mn) Forecast By Market Taxonomy, 2023-2033
13.2.1. By Country
13.2.1.1. Australia
13.2.1.2. New Zealand
13.2.2. By Industry
13.2.3. By Source
13.3. Market Attractiveness Analysis
13.3.1. By Country
13.3.2. By Industry
13.3.3. By Source
13.4. Key Takeaways
14. MEA Market Analysis 2017-2022 and Forecast 2023-2033, By Country
14.1. Historical Market Size Value (US$ Mn) Trend Analysis By Market Taxonomy, 2017-2022
14.2. Market Size Value (US$ Mn) Forecast By Market Taxonomy, 2023-2033
14.2.1. By Country
14.2.1.1. GCC Countries
14.2.1.2. South Africa
14.2.1.3. Israel
14.2.1.4. Rest of MEA
14.2.2. By Industry
14.2.3. By Source
14.3. Market Attractiveness Analysis
14.3.1. By Country
14.3.2. By Industry
14.3.3. By Source
14.4. Key Takeaways
15. Key Countries Market Analysis
15.1. U.S.
15.1.1. Pricing Analysis
15.1.2. Market Share Analysis, 2021
15.1.2.1. By Industry
15.1.2.2. By Source
15.2. Canada
15.2.1. Pricing Analysis
15.2.2. Market Share Analysis, 2021
15.2.2.1. By Industry
15.2.2.2. By Source
15.3. Brazil
15.3.1. Pricing Analysis
15.3.2. Market Share Analysis, 2021
15.3.2.1. By Industry
15.3.2.2. By Source
15.4. Mexico
15.4.1. Pricing Analysis
15.4.2. Market Share Analysis, 2021
15.4.2.1. By Industry
15.4.2.2. By Source
15.5. Germany
15.5.1. Pricing Analysis
15.5.2. Market Share Analysis, 2021
15.5.2.1. By Industry
15.5.2.2. By Source
15.6. U.K.
15.6.1. Pricing Analysis
15.6.2. Market Share Analysis, 2021
15.6.2.1. By Industry
15.6.2.2. By Source
15.7. France
15.7.1. Pricing Analysis
15.7.2. Market Share Analysis, 2021
15.7.2.1. By Industry
15.7.2.2. By Source
15.8. Spain
15.8.1. Pricing Analysis
15.8.2. Market Share Analysis, 2021
15.8.2.1. By Industry
15.8.2.2. By Source
15.9. Italy
15.9.1. Pricing Analysis
15.9.2. Market Share Analysis, 2021
15.9.2.1. By Industry
15.9.2.2. By Source
15.10. India
15.10.1. Pricing Analysis
15.10.2. Market Share Analysis, 2021
15.10.2.1. By Industry
15.10.2.2. By Source
15.11. Malaysia
15.11.1. Pricing Analysis
15.11.2. Market Share Analysis, 2021
15.11.2.1. By Industry
15.11.2.2. By Source
15.12. Singapore
15.12.1. Pricing Analysis
15.12.2. Market Share Analysis, 2021
15.12.2.1. By Industry
15.12.2.2. By Source
15.13. Thailand
15.13.1. Pricing Analysis
15.13.2. Market Share Analysis, 2021
15.13.2.1. By Industry
15.13.2.2. By Source
15.14. China
15.14.1. Pricing Analysis
15.14.2. Market Share Analysis, 2021
15.14.2.1. By Industry
15.14.2.2. By Source
15.15. Japan
15.15.1. Pricing Analysis
15.15.2. Market Share Analysis, 2021
15.15.2.1. By Industry
15.15.2.2. By Source
15.16. South Korea
15.16.1. Pricing Analysis
15.16.2. Market Share Analysis, 2021
15.16.2.1. By Industry
15.16.2.2. By Source
15.17. Australia
15.17.1. Pricing Analysis
15.17.2. Market Share Analysis, 2021
15.17.2.1. By Industry
15.17.2.2. By Source
15.18. New Zealand
15.18.1. Pricing Analysis
15.18.2. Market Share Analysis, 2021
15.18.2.1. By Industry
15.18.2.2. By Source
15.19. GCC Countries
15.19.1. Pricing Analysis
15.19.2. Market Share Analysis, 2021
15.19.2.1. By Industry
15.19.2.2. By Source
15.20. South Africa
15.20.1. Pricing Analysis
15.20.2. Market Share Analysis, 2021
15.20.2.1. By Industry
15.20.2.2. By Source
15.21. Israel
15.21.1. Pricing Analysis
15.21.2. Market Share Analysis, 2021
15.21.2.1. By Industry
15.21.2.2. By Source
16. Market Structure Analysis
16.1. Competition Dashboard
16.2. Competition Benchmarking
16.3. Market Share Analysis of Top Players
16.3.1. By Regional
16.3.2. By Industry
16.3.3. By Source
17. Competition Analysis
17.1. Competition Deep Dive
17.1.1. Sigma-Aldrich Co. LLC.
17.1.1.1. Overview
17.1.1.2. Product Portfolio
17.1.1.3. Profitability by Market Segments
17.1.1.4. Sales Footprint
17.1.1.5. Strategy Overview
17.1.1.5.1. Marketing Strategy
17.1.2. Koninklijke DSM N.V.
17.1.2.1. Overview
17.1.2.2. Product Portfolio
17.1.2.3. Profitability by Market Segments
17.1.2.4. Sales Footprint
17.1.2.5. Strategy Overview
17.1.2.5.1. Marketing Strategy
17.1.3. Parchem fine & specialty chemicals
17.1.3.1. Overview
17.1.3.2. Product Portfolio
17.1.3.3. Profitability by Market Segments
17.1.3.4. Sales Footprint
17.1.3.5. Strategy Overview
17.1.3.5.1. Marketing Strategy
17.1.4. SternEnzym GmbH & Co. KG
17.1.4.1. Overview
17.1.4.2. Product Portfolio
17.1.4.3. Profitability by Market Segments
17.1.4.4. Sales Footprint
17.1.4.5. Strategy Overview
17.1.4.5.1. Marketing Strategy
17.1.5. Kerry Inc.
17.1.5.1. Overview
17.1.5.2. Product Portfolio
17.1.5.3. Profitability by Market Segments
17.1.5.4. Sales Footprint
17.1.5.5. Strategy Overview
17.1.5.5.1. Marketing Strategy
17.1.6. Meteoric Exim Private Limited
17.1.6.1. Overview
17.1.6.2. Product Portfolio
17.1.6.3. Profitability by Market Segments
17.1.6.4. Sales Footprint
17.1.6.5. Strategy Overview
17.1.6.5.1. Marketing Strategy
17.1.7. MP Biomedicals, LLC.
17.1.7.1. Overview
17.1.7.2. Product Portfolio
17.1.7.3. Profitability by Market Segments
17.1.7.4. Sales Footprint
17.1.7.5. Strategy Overview
17.1.7.5.1. Marketing Strategy
17.1.8. BIO-CAT
17.1.8.1. Overview
17.1.8.2. Product Portfolio
17.1.8.3. Profitability by Market Segments
17.1.8.4. Sales Footprint
17.1.8.5. Strategy Overview
17.1.8.5.1. Marketing Strategy
17.1.9. Megazyme Inc.
17.1.9.1. Overview
17.1.9.2. Product Portfolio
17.1.9.3. Profitability by Market Segments
17.1.9.4. Sales Footprint
17.1.9.5. Strategy Overview
17.1.9.5.1. Marketing Strategy
17.1.10. Fidopharma
17.1.10.1. Overview
17.1.10.2. Product Portfolio
17.1.10.3. Profitability by Market Segments
17.1.10.4. Sales Footprint
17.1.10.5. Strategy Overview
17.1.10.5.1. Marketing Strategy
18. Assumptions & Acronyms Used
19. Research Methodology
Let us know your requirement to get
100% FREE customization
List of Tables
Table 1: Global Market Value (US$ Mn) Forecast by Region, 2017-2033
Table 2: Global Market Value (US$ Mn) Forecast by Industry, 2017-2033
Table 3: Global Market Value (US$ Mn) Forecast by Source, 2017-2033
Table 4: North America Market Value (US$ Mn) Forecast by Country, 2017-2033
Table 5: North America Market Value (US$ Mn) Forecast by Industry, 2017-2033
Table 6: North America Market Value (US$ Mn) Forecast by Source, 2017-2033
Table 7: Latin America Market Value (US$ Mn) Forecast by Country, 2017-2033
Table 8: Latin America Market Value (US$ Mn) Forecast by Industry, 2017-2033
Table 9: Latin America Market Value (US$ Mn) Forecast by Source, 2017-2033
Table 10: Europe Market Value (US$ Mn) Forecast by Country, 2017-2033
Table 11: Europe Market Value (US$ Mn) Forecast by Industry, 2017-2033
Table 12: Europe Market Value (US$ Mn) Forecast by Source, 2017-2033
Table 13: South Asia Market Value (US$ Mn) Forecast by Country, 2017-2033
Table 14: South Asia Market Value (US$ Mn) Forecast by Industry, 2017-2033
Table 15: South Asia Market Value (US$ Mn) Forecast by Source, 2017-2033
Table 16: East Asia Market Value (US$ Mn) Forecast by Country, 2017-2033
Table 17: East Asia Market Value (US$ Mn) Forecast by Industry, 2017-2033
Table 18: East Asia Market Value (US$ Mn) Forecast by Source, 2017-2033
Table 19: Oceania Market Value (US$ Mn) Forecast by Country, 2017-2033
Table 20: Oceania Market Value (US$ Mn) Forecast by Industry, 2017-2033
Table 21: Oceania Market Value (US$ Mn) Forecast by Source, 2017-2033
Table 22: MEA Market Value (US$ Mn) Forecast by Country, 2017-2033
Table 23: MEA Market Value (US$ Mn) Forecast by Industry, 2017-2033
Table 24: MEA Market Value (US$ Mn) Forecast by Source, 2017-2033
Find your sweet spots for generating winning opportunities in this market.
Talk to AnalystList of Charts
Figure 1: Global Market Value (US$ Mn) by Industry, 2023-2033
Figure 2: Global Market Value (US$ Mn) by Source, 2023-2033
Figure 3: Global Market Value (US$ Mn) by Region, 2023-2033
Figure 4: Global Market Value (US$ Mn) Analysis by Region, 2017-2033
Figure 5: Global Market Value Share (%) and BPS Analysis by Region, 2023-2033
Figure 6: Global Market Y-o-Y Growth (%) Projections by Region, 2023-2033
Figure 7: Global Market Value (US$ Mn) Analysis by Industry, 2017-2033
Figure 8: Global Market Value Share (%) and BPS Analysis by Industry, 2023-2033
Figure 9: Global Market Y-o-Y Growth (%) Projections by Industry, 2023-2033
Figure 10: Global Market Value (US$ Mn) Analysis by Source, 2017-2033
Figure 11: Global Market Value Share (%) and BPS Analysis by Source, 2023-2033
Figure 12: Global Market Y-o-Y Growth (%) Projections by Source, 2023-2033
Figure 13: Global Market Attractiveness by Industry, 2023-2033
Figure 14: Global Market Attractiveness by Source, 2023-2033
Figure 15: Global Market Attractiveness by Region, 2023-2033
Figure 16: North America Market Value (US$ Mn) by Industry, 2023-2033
Figure 17: North America Market Value (US$ Mn) by Source, 2023-2033
Figure 18: North America Market Value (US$ Mn) by Country, 2023-2033
Figure 19: North America Market Value (US$ Mn) Analysis by Country, 2017-2033
Figure 20: North America Market Value Share (%) and BPS Analysis by Country, 2023-2033
Figure 21: North America Market Y-o-Y Growth (%) Projections by Country, 2023-2033
Figure 22: North America Market Value (US$ Mn) Analysis by Industry, 2017-2033
Figure 23: North America Market Value Share (%) and BPS Analysis by Industry, 2023-2033
Figure 24: North America Market Y-o-Y Growth (%) Projections by Industry, 2023-2033
Figure 25: North America Market Value (US$ Mn) Analysis by Source, 2017-2033
Figure 26: North America Market Value Share (%) and BPS Analysis by Source, 2023-2033
Figure 27: North America Market Y-o-Y Growth (%) Projections by Source, 2023-2033
Figure 28: North America Market Attractiveness by Industry, 2023-2033
Figure 29: North America Market Attractiveness by Source, 2023-2033
Figure 30: North America Market Attractiveness by Country, 2023-2033
Figure 31: Latin America Market Value (US$ Mn) by Industry, 2023-2033
Figure 32: Latin America Market Value (US$ Mn) by Source, 2023-2033
Figure 33: Latin America Market Value (US$ Mn) by Country, 2023-2033
Figure 34: Latin America Market Value (US$ Mn) Analysis by Country, 2017-2033
Figure 35: Latin America Market Value Share (%) and BPS Analysis by Country, 2023-2033
Figure 36: Latin America Market Y-o-Y Growth (%) Projections by Country, 2023-2033
Figure 37: Latin America Market Value (US$ Mn) Analysis by Industry, 2017-2033
Figure 38: Latin America Market Value Share (%) and BPS Analysis by Industry, 2023-2033
Figure 39: Latin America Market Y-o-Y Growth (%) Projections by Industry, 2023-2033
Figure 40: Latin America Market Value (US$ Mn) Analysis by Source, 2017-2033
Figure 41: Latin America Market Value Share (%) and BPS Analysis by Source, 2023-2033
Figure 42: Latin America Market Y-o-Y Growth (%) Projections by Source, 2023-2033
Figure 43: Latin America Market Attractiveness by Industry, 2023-2033
Figure 44: Latin America Market Attractiveness by Source, 2023-2033
Figure 45: Latin America Market Attractiveness by Country, 2023-2033
Figure 46: Europe Market Value (US$ Mn) by Industry, 2023-2033
Figure 47: Europe Market Value (US$ Mn) by Source, 2023-2033
Figure 48: Europe Market Value (US$ Mn) by Country, 2023-2033
Figure 49: Europe Market Value (US$ Mn) Analysis by Country, 2017-2033
Figure 50: Europe Market Value Share (%) and BPS Analysis by Country, 2023-2033
Figure 51: Europe Market Y-o-Y Growth (%) Projections by Country, 2023-2033
Figure 52: Europe Market Value (US$ Mn) Analysis by Industry, 2017-2033
Figure 53: Europe Market Value Share (%) and BPS Analysis by Industry, 2023-2033
Figure 54: Europe Market Y-o-Y Growth (%) Projections by Industry, 2023-2033
Figure 55: Europe Market Value (US$ Mn) Analysis by Source, 2017-2033
Figure 56: Europe Market Value Share (%) and BPS Analysis by Source, 2023-2033
Figure 57: Europe Market Y-o-Y Growth (%) Projections by Source, 2023-2033
Figure 58: Europe Market Attractiveness by Industry, 2023-2033
Figure 59: Europe Market Attractiveness by Source, 2023-2033
Figure 60: Europe Market Attractiveness by Country, 2023-2033
Figure 61: South Asia Market Value (US$ Mn) by Industry, 2023-2033
Figure 62: South Asia Market Value (US$ Mn) by Source, 2023-2033
Figure 63: South Asia Market Value (US$ Mn) by Country, 2023-2033
Figure 64: South Asia Market Value (US$ Mn) Analysis by Country, 2017-2033
Figure 65: South Asia Market Value Share (%) and BPS Analysis by Country, 2023-2033
Figure 66: South Asia Market Y-o-Y Growth (%) Projections by Country, 2023-2033
Figure 67: South Asia Market Value (US$ Mn) Analysis by Industry, 2017-2033
Figure 68: South Asia Market Value Share (%) and BPS Analysis by Industry, 2023-2033
Figure 69: South Asia Market Y-o-Y Growth (%) Projections by Industry, 2023-2033
Figure 70: South Asia Market Value (US$ Mn) Analysis by Source, 2017-2033
Figure 71: South Asia Market Value Share (%) and BPS Analysis by Source, 2023-2033
Figure 72: South Asia Market Y-o-Y Growth (%) Projections by Source, 2023-2033
Figure 73: South Asia Market Attractiveness by Industry, 2023-2033
Figure 74: South Asia Market Attractiveness by Source, 2023-2033
Figure 75: South Asia Market Attractiveness by Country, 2023-2033
Figure 76: East Asia Market Value (US$ Mn) by Industry, 2023-2033
Figure 77: East Asia Market Value (US$ Mn) by Source, 2023-2033
Figure 78: East Asia Market Value (US$ Mn) by Country, 2023-2033
Figure 79: East Asia Market Value (US$ Mn) Analysis by Country, 2017-2033
Figure 80: East Asia Market Value Share (%) and BPS Analysis by Country, 2023-2033
Figure 81: East Asia Market Y-o-Y Growth (%) Projections by Country, 2023-2033
Figure 82: East Asia Market Value (US$ Mn) Analysis by Industry, 2017-2033
Figure 83: East Asia Market Value Share (%) and BPS Analysis by Industry, 2023-2033
Figure 84: East Asia Market Y-o-Y Growth (%) Projections by Industry, 2023-2033
Figure 85: East Asia Market Value (US$ Mn) Analysis by Source, 2017-2033
Figure 86: East Asia Market Value Share (%) and BPS Analysis by Source, 2023-2033
Figure 87: East Asia Market Y-o-Y Growth (%) Projections by Source, 2023-2033
Figure 88: East Asia Market Attractiveness by Industry, 2023-2033
Figure 89: East Asia Market Attractiveness by Source, 2023-2033
Figure 90: East Asia Market Attractiveness by Country, 2023-2033
Figure 91: Oceania Market Value (US$ Mn) by Industry, 2023-2033
Figure 92: Oceania Market Value (US$ Mn) by Source, 2023-2033
Figure 93: Oceania Market Value (US$ Mn) by Country, 2023-2033
Figure 94: Oceania Market Value (US$ Mn) Analysis by Country, 2017-2033
Figure 95: Oceania Market Value Share (%) and BPS Analysis by Country, 2023-2033
Figure 96: Oceania Market Y-o-Y Growth (%) Projections by Country, 2023-2033
Figure 97: Oceania Market Value (US$ Mn) Analysis by Industry, 2017-2033
Figure 98: Oceania Market Value Share (%) and BPS Analysis by Industry, 2023-2033
Figure 99: Oceania Market Y-o-Y Growth (%) Projections by Industry, 2023-2033
Figure 100: Oceania Market Value (US$ Mn) Analysis by Source, 2017-2033
Figure 101: Oceania Market Value Share (%) and BPS Analysis by Source, 2023-2033
Figure 102: Oceania Market Y-o-Y Growth (%) Projections by Source, 2023-2033
Figure 103: Oceania Market Attractiveness by Industry, 2023-2033
Figure 104: Oceania Market Attractiveness by Source, 2023-2033
Figure 105: Oceania Market Attractiveness by Country, 2023-2033
Figure 106: MEA Market Value (US$ Mn) by Industry, 2023-2033
Figure 107: MEA Market Value (US$ Mn) by Source, 2023-2033
Figure 108: MEA Market Value (US$ Mn) by Country, 2023-2033
Figure 109: MEA Market Value (US$ Mn) Analysis by Country, 2017-2033
Figure 110: MEA Market Value Share (%) and BPS Analysis by Country, 2023-2033
Figure 111: MEA Market Y-o-Y Growth (%) Projections by Country, 2023-2033
Figure 112: MEA Market Value (US$ Mn) Analysis by Industry, 2017-2033
Figure 113: MEA Market Value Share (%) and BPS Analysis by Industry, 2023-2033
Figure 114: MEA Market Y-o-Y Growth (%) Projections by Industry, 2023-2033
Figure 115: MEA Market Value (US$ Mn) Analysis by Source, 2017-2033
Figure 116: MEA Market Value Share (%) and BPS Analysis by Source, 2023-2033
Figure 117: MEA Market Y-o-Y Growth (%) Projections by Source, 2023-2033
Figure 118: MEA Market Attractiveness by Industry, 2023-2033
Figure 119: MEA Market Attractiveness by Source, 2023-2033
Figure 120: MEA Market Attractiveness by Country, 2023-2033
Need specific information?
Request CustomizationExplore Food and Beverage Insights
View Reports