The janitorial sinks market size is expected to grow. Growing emphasis on hygiene, sanitation and workplace safety regulations is driving the adoption of janitorial sinks in various establishments. Moreover, to boost efficiency, product developers are adopting next-gen technologies and materials, while sink companies are continuing to develop products with an increased focus on durability and water-saving technologies, contributing to higher demand.
And the combination of stainless steel, along with corrosion-resistant coatings, is now allowing for even greater longevity, and making these sinks even more desirable for high-traffic environments. Custom-contoured designs are another major trend, allowing manufacturers to accommodate the needs of different industries.
In 2025, the janitorial sinks market was valued at approximately USD 915.72 million. By 2035, it is projected to reach USD 1,655.46 million, reflecting a compound annual growth rate (CAGR) of 6.1%. The increasing adoption of janitorial sinks in healthcare facilities, hotels, food processing units, and educational institutions is a significant driver of market expansion.
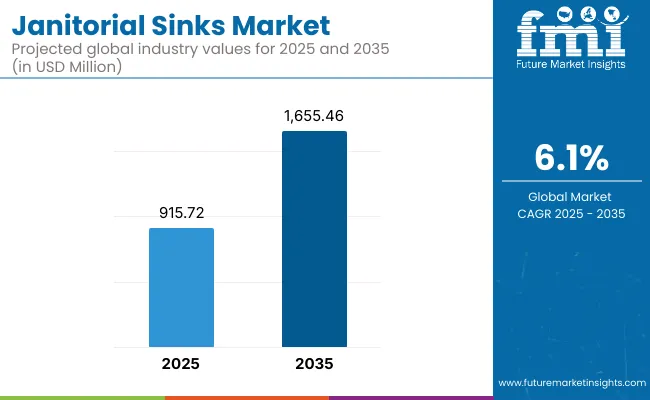
Moreover, the demand for hands-free and sensor-based janitorial sinks is gaining traction, reducing cross-contamination risks. The integration of eco-friendly materials and water-efficient fixtures is expected to support market sustainability, while stringent government regulations regarding workplace hygiene are further fueling growth.
North America continues to hold a major share in the janitorial sinks market, owing to stringent workplace hygiene regulations, rising awareness amongst end users towards hygiene, and increasing demand from healthcare and hospitality sectors. In the United States and Canada, the growing number of janitorial sink installation in commercial kitchens, hospitals and schools, is largely driven by hygienic regulations.
Touchless faucet technology, antimicrobial coatings, and high-efficiency drainage systems are also being credited with driving further innovation, and adoption. Moreover, government initiatives aimed at promoting public health and cleanliness in workplaces are motivating businesses to purchase high-end hygiene equipment, thereby driving market growth.
The regulation of hygiene policies in the EU and commercial and institutional facility adoption are driving European janitorial sinks market growth. Germany, the United Kingdom and France lead the pack in the adoption of jerk cabinets, ergonomic orient, water saving and easy to use material.
Increasing demand for environment-friendly and recyclable sink materials will shape buying trends, and the expansion of the food processing and pharmaceutical industry will continue to spur demand. Further, the key trend enhancing the development of intelligent sinks with automatic shut-off features is the effort to minimize water waste in janitorial functions.
This region is a key market for janitorial sinks, owing to the rapid urbanization, increasing infrastructure investments, and growing sanitation awareness. In countries like China, India, Japan, and South Korea, demand for janitorial sinks is rapidly growing in hospitals, restaurants, and industrial places.
The increasing number of hospitality chains, rising number of healthcare establishments and stringent government regulations regarding compliance of hygiene are also responsible for driving the market. Similarly, smart janitorial sink designs are saving space for the smaller commercial setups due to innovations in stainless steel technology.
Janitorial sinks to gain traction across different industry verticals, technological developments, and increasing awareness regarding sanitation will continue to bolster the janitorial sinks market in the upcoming decade. Technological advancements such as antimicrobial coatings, sensor-based faucets, and water-efficient drainage solutions will continue to drive growth in this marketplace and revolutionize hygiene solutions in commercial and institutional environments.
Challenge
High Installation and Maintenance Costs
High installation and maintenance costs are barriers to adoption, particularly among smaller organizations. For instance, commercial janitorial sinks are made from durable materials, like stainless steel, with heavy-duty plumbing connections, resulting in higher initial investment. Also, other operational costs arise from clogging, corrosion, and hygiene compliance maintenance. To reduce long-term costs, companies need to investigate cost-effective materials, employ self-clean mechanisms, and invest in efficient drainage systems.
Stringent Hygiene and Compliance Regulations
Janitorial sinks, particularly in commercial and healthcare applications, are subject to stringent hygiene and sanitation regulations that can complicate compliance; however, challenges exist. Government regulations like OSHA (Occupational Safety and Health Administration) and NSF International set rigorous installation and maintenance standards.
Non-compliance could mean businesses face penalties and reputational damage. Cleaning side decision- organizations have to gear up as far as antimicrobial covering, hands free spigot arrangements and computerized disinfection.
Opportunity
Growing Demand for Hygienic and Smart Sinks
An increase in hygienic requirements for commercial spaces, such as restaurants, hospitals, and industrial facilities, is driving demand for advanced janitorial sinks. Touchless technology, temperature regulation and automatic soap dispensers are all proving popular, too, in the realm of smart sinks. IoT-enabled janitorial sinks with real-time water usage monitoring and self-cleaning features will put businesses investing in them ahead of their competitors on the changing market landscape.
Sustainability and Water-Saving Innovations
The move toward sustainable options starts with manufacturers who need to work to create water-saving janitorial sinks. Low-flow faucets, to water recycling mechanisms and eco-friendly drainage systems are among those innovations that are picking up pace.
They also often include energy-efficient water heaters and filtration systems to ensure that janitorial sink solutions are as sustainable as possible. Environmentally conscious buyers will prefer companies that focus on green technologies and certifications for water conservation.
The Janitorial sinks market has experienced significant growth from 2020 to 2024, with a focus on hygiene, ease of use, and durability. There was a shift towards sinks that had anti-microbial coatings and water-efficient features, due to increased awareness for sanitation. Nonetheless, market growth was challenged by supply chain distortions, variable raw material prices, and regulatory compliance.
During the 2025 to 2035 outlook period, the market is likely to witness further innovations through automation, smart water management, and sustainability-driven designs. Future growth will be spurred by AI-based sink monitoring systems, water recycling capabilities, and integration with facility management applications. An extensive analysis of the global competitive landscape reveals that manufacturer’s intent on focusing on digital transformation, eco-friendly materials, and enhanced hygiene solutions will become the key players.
Market Shifts: A Comparative Analysis (2020 to 2024 vs. 2025 to 2035)
| Market Shift | 2020 to 2024 Trends |
|---|---|
| Regulatory Landscape | Compliance with hygiene and safety regulations |
| Technological Advancements | Introduction of touchless faucets and antimicrobial coatings |
| Industry Adoption | Increased demand in healthcare and foodservice sectors |
| Supply Chain and Sourcing | Dependence on traditional stainless steel materials |
| Market Competition | Dominance of established plumbing and fixture brands |
| Market Growth Drivers | Heightened hygiene awareness and efficiency needs |
| Sustainability and Energy Efficiency | Initial focus on low-flow water usage |
| Integration of Smart Monitoring | Limited use of digital tracking in sink usage |
| Advancements in Product Innovation | Focus on hygiene-centric sink designs |
| Market Shift | 2025 to 2035 Projections |
|---|---|
| Regulatory Landscape | AI-driven compliance monitoring and automated cleaning |
| Technological Advancements | Expansion of smart sinks with IoT and real-time analytics |
| Industry Adoption | Widespread adoption in commercial and industrial spaces |
| Supply Chain and Sourcing | Shift toward eco-friendly and recyclable materials |
| Market Competition | Rise of smart technology-driven sink manufacturers |
| Market Growth Drivers | AI-integrated water conservation and sustainable solutions |
| Sustainability and Energy Efficiency | Large-scale adoption of water recycling and conservation |
| Integration of Smart Monitoring | AI-powered water efficiency monitoring and leak detection |
| Advancements in Product Innovation | Development of smart, self-cleaning, and sensor-equipped sinks |
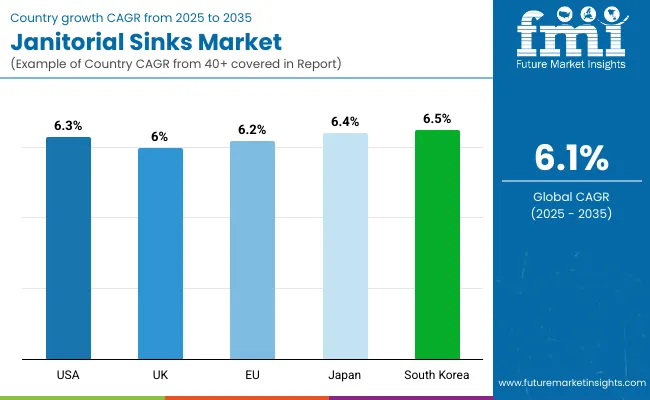
Janitorial sinks are widely produced and consumed within the USA at commercial and industrial scales as seen across the healthcare, hospitality, food service industry, among others. Strict hygiene and sanitation regulations placing pressure on businesses to invest in a quality janitorial sink with enhanced durability and efficiency.
The increasing demand for stainless steel and corrosion-resistant materials is contributing to the market growth as well. And the growth of smart plumbing solutions such as hands-free or sensor-enabled sinks is also driving adoption. Janitorial sinks continue to experience steady demand driven by the pipeline of commercial real estate and construction projects.
| Country | CAGR (2025 to 2035) |
|---|---|
| USA | 6.3% |
The janitorial sinks market in the United Kingdom is expanding steadily on the back of increasing awareness about hygiene and rise in investments in commercial infrastructure. Furthermore, there is increasing demand for segment-2 sinks with a preference for space-saving options, especially in applications such as health care, education and hospitality.
This is because a new generation of sinks including eco-friendly, water-saving models is gaining ground in the home design world. Government initiatives to promote hygiene and sanitation in public places are likely to further drive the demand. Increased penetration of online retail channels has resulted in easier access to a range of janitorial sink solutions for businesses, which is another factor driving the growth of the market.
| Country | CAGR (2025 to 2035) |
|---|---|
| UK | 6.0% |
The janitorial sinks market in the European Union is expected to grow at a moderate pace due to growing hygiene and sustainability initiatives. The rising trend for ergonomic and heavy-duty janitorial sinks in the food and beverage, healthcare, and manufacturing industry is driving the demand for commercial janitorial sinks in the countries of Germany, France, and Italy.
In addition, the increase in water conservation and energy-efficient plumbing systems is also dominating product innovations. Furthermore, the increasing prevalence of modular commercial kitchen setups and industrial cleaning facilities is acting as a catalyst for market expansion. Effective key manufacturers and implementation of premium grade materials in different applications is also a factor that will propel the market growth.
| Region | CAGR (2025 to 2035) |
|---|---|
| European Union (EU) | 6.2% |
Growing significance of high hygiene practices across enterprises is propelling the demand for janitorial sinks in Japan. Demand for the market is being driven by the country’s aged infrastructure as well as ongoing renovations in commercial buildings. There is also growing market demand for compact and technology-rich sinks with advanced sanitation features like antibacterial protective coatings and touchless operation.
Japan has an even more aggressive focus on water efficiency, considerations that drive innovative plumbing products. Especially in high-traffic environments like hospitals and food processing units, the increasing utilization of stainless steel and corrosion-resistant materials is another factor propelling market growth.
| Country | CAGR (2025 to 2035) |
|---|---|
| Japan | 6.4% |
Hygienic and growing market for Janitorial sinks in South Korea: South Korea janitorial sinks market has soared with the rapid expansion of commercial construction and strict sanitary regulations. The booming food service, health care and industrial markets in the country are major drivers of demand for long-lasting and high-performing janitorial sinks.
Market growth is driven by the adoption of advanced automated cleaning technology systems. Moreover, the government was promoting eco-friendly building codes and water-saving fixtures which prompted the adoption of green janitorial sinks. The increasing preference for smart plumbing solutions and innovative sink designs that are known to be space-friendly are also aiding market growth.
| Country | CAGR (2025 to 2035) |
|---|---|
| South Korea | 6.5% |
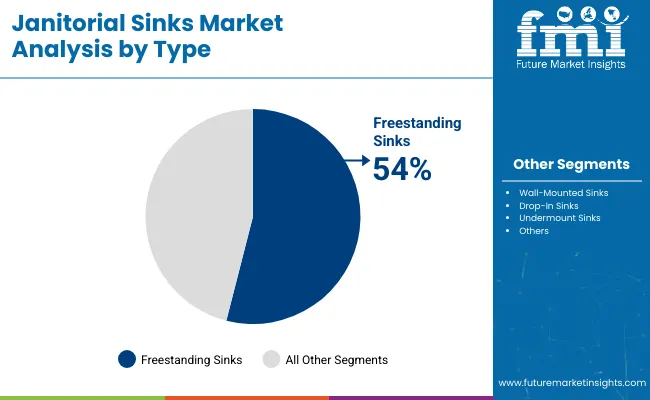
| Type | Market Share (2025) |
|---|---|
| Freestanding Sinks | 54% |
Freestanding sinks are expected to account for a significant share of the janitorial sinks market owing to their flexibility and ease of installation, along with, suitability for heavy-duty cleaning applications. These sinks are commonly found in commercial spaces such as hospitals, restaurants, and industrial facilities, providing high-capacity cleaning. Freestanding models provide superior stability and better access than wall-mounted or undercount sinks, which makes them a favorite among janitorial and maintenance crews.
The market share of freestanding sinks in institutional and public facilities is also being propelled by the rising adoption of these types of sinks. Additionally, sink design is progressing with features to improve splash prevention frequency and drainage performance in settings ranging from school bathrooms to family kitchens. The increasing modularization of commercial kitchens or modular workspace further increased the demand for freestanding sinks owing to their versatility and efficient space usage across commercial facilities.
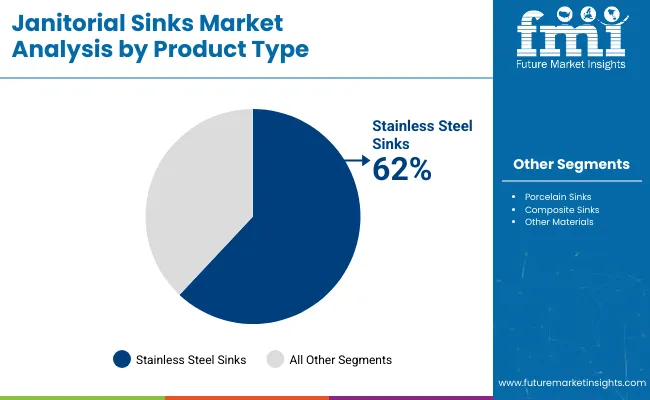
| Material | Market Share (2025) |
|---|---|
| Stainless Steel Sinks | 62% |
Among these material type, stainless steel sinks has a significant share of the overall janitorial sinks market due to its ability to endure with high strength, corrosion resistance and maintenance free characteristics. There are commonly used in commercial and industrial sectors that require longevity and hygiene. Stainless steel sinks are less prone to breaking than porcelain or composite variants, making them a widely popular option for use in high-traffic settings like schools, healthcare centers, and the food service industry.
The rising demand for environmentally friendly and recyclable materials further drives the adoption of stainless steel sinks. Moreover, stainless steel sink production techniques, including noise reduction technology and enhanced finishing methods are becoming more advanced, which is profiting their appeal even more and also achieving wider market penetration. Stainless steel sinks are increasingly popular amidst the movement towards green building initiatives and LEED certifications, as their sustainable and long-lasting nature contributes to modern environmental goals.
The Janitorial sinks market is a growing sector, driven by an increase in the demand for cleaner and more durable cleaning products in commercial and industrial settings. Factors such as the burgeoning emphasis on sanitation, work premises hygiene regulations, and sustainable materials are contributing to the market at a slower pace.
Manufacturers are investing in stainless steel, antimicrobial coatings, and ergonomic designs to promote products with longevity and efficiency. It also maintains a global Compound Annual Growth Rate (CAGR) of 6.1% and companies are now progressively focusing on meeting the evolving standards of the industry by introducing customization, water-sensitive features, and smart draining systems. Furthermore, market growth is also driven by the increasing adoption of utility sinks in healthcare, hospitality, and institutional facilities.
Market Share Analysis by Company
| Company Name | Estimated Market Share (%) |
|---|---|
| Just Manufacturing | 18-22% |
| Elkay Manufacturing | 14-18% |
| Moen Incorporated | 12-16% |
| Advance Tabco | 10-14% |
| T&S Brass and Bronze Works | 8-12% |
| Other Companies (combined) | 25-35% |
| Company Name | Key Offerings/Activities |
|---|---|
| Just Manufacturing | In 2025, Just Manufacturing launched a new series of antimicrobial-coated janitorial sinks, enhancing hygiene and reducing bacterial growth. |
| Elkay Manufacturing | In 2024, Elkay Manufacturing expanded its stainless steel utility sink range, emphasizing durability and water-saving features. |
| Moen Incorporated | In 2025, Moen Incorporated introduced sensor-operated janitorial sinks, improving efficiency and reducing water waste. |
| Advance Tabco | In 2024, Advance Tabco developed heavy-duty floor-mounted sinks with ergonomic designs for commercial cleaning applications. |
| T&S Brass and Bronze Works | In 2025, T&S Brass and Bronze Works launched smart drainage solutions for janitorial sinks, improving water flow and clog prevention. |
Key Company Insights
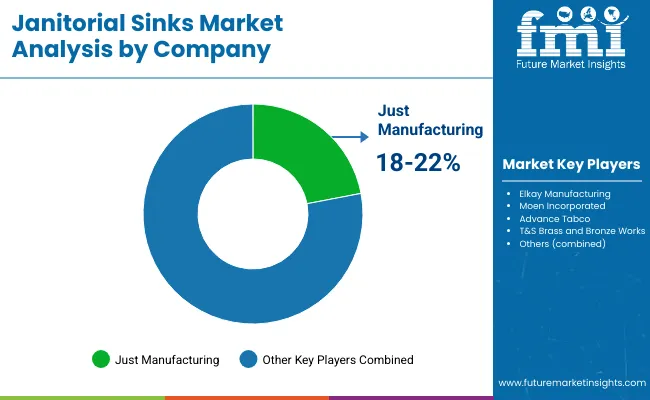
Just Manufacturing (18-22%)
Marketed under the Just Manufacturing name, the janitorial sinks feature antimicrobial stainless steel construction for hygiene and durability. It takes care of regulatory compliance through innovative coatings and exotic production. With emphasis on made to order designs and water efficient technology, Just Manufacturing's innovation promises market leadership.
Elkay Manufacturing (14-18%)
The Elkay brand is known for its long-lasting stainless-steel sinks that are both water saving and ergonomic for increased efficiency. Deliveries of products become a key area for expanding our product offering into commercial and industrial applications, serving sustainability projects and advanced water filtration in parallel.
Moen Incorporated (12-16%)
Moen is a leading innovator in sensor-based and touchless janitorial sink technology for time and water savings and increased user convenience. The company specializes in smart plumbing innovations that cater to heavy-duty construction materials for long-lasting durability in high-usage environments.
Advance Tabco (10-14%)
Advance Tabco specializes in heavy-duty, floor-mount sinks and are designed for ergonomic, space-saving applications. Designed for high-traffic commercial facilities, the company's products feature durable construction, seamless welding, salt air/sea and corrosion resistance.
T&S Brass and Bronze Works (8-12%)
Known for its innovative drainage and faucet systems that enhance water efficiency and facilitate maintenance, T&S Brass and Bronze Works has a strong history of leadership and expertise. To top it all off, the company’s smart sink solutions and brass-based components deliver higher durability and performance even in the most demanding janitorial environments.
Other Key Players (25-35% Combined)
Other manufacturers who offer specialized and innovative solutions to cover the janitorial sinks market are:
The overall market size for janitorial sinks market was USD 915.72 million in 2025.
The janitorial sinks market expected to reach USD 1,655.46 million in 2035.
Increasing hygiene regulations, rising demand in commercial and industrial facilities, growing construction activities, expanding hospitality sector, and advancements in durable and ergonomic sink designs will drive market demand.
The top 5 countries which drives the development of janitorial sinks market are USA, UK, Europe Union, Japan and South Korea.
Stainless steel sinks driving market growth to command significant share over the assessment period.


Our Research Products

The "Full Research Suite" delivers actionable market intel, deep dives on markets or technologies, so clients act faster, cut risk, and unlock growth.

The Leaderboard benchmarks and ranks top vendors, classifying them as Established Leaders, Leading Challengers, or Disruptors & Challengers.

Locates where complements amplify value and substitutes erode it, forecasting net impact by horizon

We deliver granular, decision-grade intel: market sizing, 5-year forecasts, pricing, adoption, usage, revenue, and operational KPIs—plus competitor tracking, regulation, and value chains—across 60 countries broadly.

Spot the shifts before they hit your P&L. We track inflection points, adoption curves, pricing moves, and ecosystem plays to show where demand is heading, why it is changing, and what to do next across high-growth markets and disruptive tech

Real-time reads of user behavior. We track shifting priorities, perceptions of today’s and next-gen services, and provider experience, then pace how fast tech moves from trial to adoption, blending buyer, consumer, and channel inputs with social signals (#WhySwitch, #UX).

Partner with our analyst team to build a custom report designed around your business priorities. From analysing market trends to assessing competitors or crafting bespoke datasets, we tailor insights to your needs.
Supplier Intelligence
Discovery & Profiling
Capacity & Footprint
Performance & Risk
Compliance & Governance
Commercial Readiness
Who Supplies Whom
Scorecards & Shortlists
Playbooks & Docs
Category Intelligence
Definition & Scope
Demand & Use Cases
Cost Drivers
Market Structure
Supply Chain Map
Trade & Policy
Operating Norms
Deliverables
Buyer Intelligence
Account Basics
Spend & Scope
Procurement Model
Vendor Requirements
Terms & Policies
Entry Strategy
Pain Points & Triggers
Outputs
Pricing Analysis
Benchmarks
Trends
Should-Cost
Indexation
Landed Cost
Commercial Terms
Deliverables
Brand Analysis
Positioning & Value Prop
Share & Presence
Customer Evidence
Go-to-Market
Digital & Reputation
Compliance & Trust
KPIs & Gaps
Outputs
Full Research Suite comprises of:
Market outlook & trends analysis
Interviews & case studies
Strategic recommendations
Vendor profiles & capabilities analysis
5-year forecasts
8 regions and 60+ country-level data splits
Market segment data splits
12 months of continuous data updates
DELIVERED AS:
PDF EXCEL ONLINE
Hand Sinks Market - Hygiene & Compliance in Foodservice 2025 to 2035
Underbar Sinks Market - Space-Saving & Functional Bar Solutions 2025 to 2035
Compartment Sinks Market - Hygiene & Efficient Kitchen Workflow 2025 to 2035

Thank you!
You will receive an email from our Business Development Manager. Please be sure to check your SPAM/JUNK folder too.
Chat With
MaRIA