The liposomal doxorubicin market is expected to expand significantly from USD 1.3 billion in 2025 to USD 2.40 billion by 2035, growing at a CAGR of 6.3%.
This robust growth is driven by increased prevalence of cancers treatable with liposomal doxorubicin, ongoing advancements in drug delivery technologies, and expanding healthcare infrastructure in emerging markets. The market’s growth is also supported by strong demand for branded drugs, which account for the majority share due to trust in efficacy and safety profiles.
By 2030, the market is projected to reach USD 1.8 billion, highlighting strong mid-term growth. This expansion reflects the continuous adoption of liposomal formulations in oncology treatment protocols and increasing patient awareness. Over 2025-2035, the market is poised to achieve an absolute growth of USD 1.0 billion, underscoring the rising reliance on targeted chemotherapy options and ongoing innovation in liposomal drug delivery systems worldwide.
Leading companies such as Cadila Pharmaceuticals, Johnson & Johnson Services Inc., Cipla Limited, GlaxoSmithKline plc., and Merck & Co. are consolidating their positions in the liposomal doxorubicin market by strengthening product portfolios and advancing next-generation chemotherapy formulations. Their focus includes improving liposomal drug delivery systems, enhancing targeted therapy efficacy, and minimizing adverse effects such as cardiotoxicity, enabling stronger market penetration across developed healthcare systems and emerging regions. By investing in innovation, reliability, and cost-effective treatments, these players are expanding access for cancer patients while capturing growth opportunities in the specialized oncology drug segment.
The market holds a critical position in oncology therapeutics, with branded formulations representing nearly 87.0% of market share due to their established safety and effectiveness profiles. Hospital pharmacies, accounting for 62.0% of distribution, remain central to patient care and drug administration in cancer treatment protocols. This sector contributes substantially to the broader oncology pharmaceuticals landscape, driven by rising cancer prevalence, advancements in nanodrug delivery technologies, and increasing healthcare infrastructure in emerging markets.
The market is evolving with innovations such as improved liposome coatings, personalized medicine approaches, and combination therapies that enhance therapeutic precision, reduce side effects, and improve overall patient outcomes. Companies are strengthening their portfolios with smarter formulations aiming to increase drug bioavailability and target tumor sites more effectively. Strategic collaborations with oncology centers, research institutions, and healthcare providers are enhancing drug accessibility and positioning advanced liposomal doxorubicin formulations as essential treatment options for breast cancer, ovarian cancer, Kaposi’s sarcoma, and other malignancies globally.
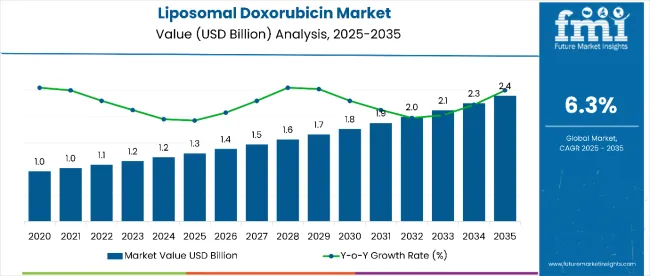
| Metric | Value |
|---|---|
| Market Value in 2025 | USD 1.3 billion |
| Market Value in 2035 | USD 2.4 billion |
| CAGR (2025 to 2035) | 6.3% |
The market is experiencing robust growth driven by several critical factors. Primarily, the rising prevalence of various cancers, including breast cancer, ovarian cancer, and Kaposi’s sarcoma, fuels demand for effective chemotherapy options. Liposomal doxorubicin offers targeted drug delivery, enhancing therapeutic efficacy while reducing systemic toxicity, which appeals to both healthcare providers and patients seeking safer treatment alternatives.
Advancements in nanotechnology and drug delivery systems have significantly improved the formulation of liposomal doxorubicin, enabling prolonged circulation time in the bloodstream and increased accumulation at tumor sites. These innovations contribute to better clinical outcomes and reduced adverse effects, driving wider adoption of liposomal formulations over conventional chemotherapy.
The dominance of branded drugs, trusted for consistent quality and clinical evidence, further propels market growth. Hospital pharmacies, as principal distribution channels with specialized oncology expertise, facilitate proper administration and monitoring, supporting patient safety and increasing market penetration.
The market is segmented by type, application, distribution channel, and region. By type, the market is bifurcated into branded and generic. Based on application, the market is divided into breast cancer, ovarian cancer, AIDS-related Kaposi's sarcoma, multiple myeloma, and other solid tumors (lung cancer, pancreatic cancer, and sarcomas). In terms of distribution channel, the market is categorized into hospital pharmacies, retail pharmacies, and mail-order pharmacies. Regionally, the market is classified into North America, Latin America, Western Europe, Eastern Europe, South Asia and Pacific, East Asia, and the Middle East and Africa.
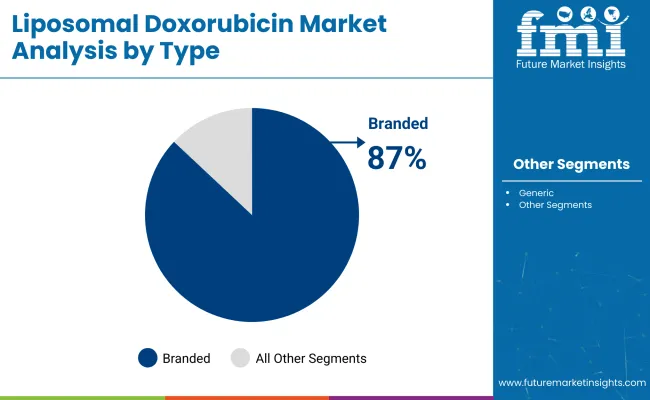
The branded segment in the liposomal doxorubicin market stands out as the most lucrative, commanding an estimated market share of 87% in 2025. This dominance is largely attributable to the strong trust healthcare professionals and patients place in branded products due to their consistent formulation, proven clinical efficacy, and established safety profiles backed by extensive research and development. Branded liposomal doxorubicin formulations benefit from robust regulatory approvals and widespread clinical adoption, which further enhances their market position.
In-depth analysis reveals that branded drugs often come with comprehensive clinical trial data reinforcing their effectiveness in treating cancers like breast cancer and ovarian cancer, where liposomal doxorubicin is predominantly used. Additionally, branded products typically provide superior support services, including better patient management, physician education, and pharmacovigilance, contributing to improved patient outcomes and adherence.
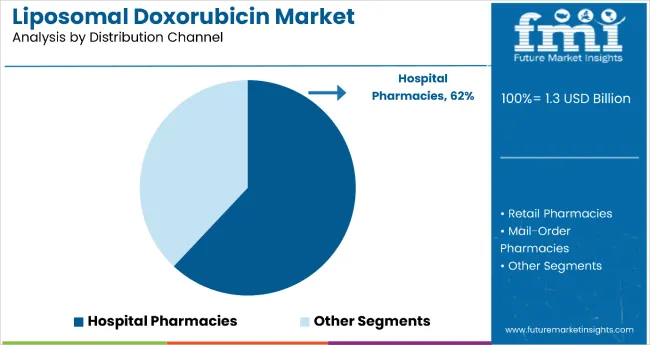
In 2025, hospital pharmacies represent the most lucrative distribution channel in the liposomal doxorubicin market, accounting for an 62% share. Hospital pharmacies are critical hubs for distributing and administering liposomal doxorubicin, as it is primarily used in controlled clinical settings requiring specialized oncology expertise. These pharmacies are staffed with trained pharmacists and healthcare providers who manage complex chemotherapy regimens, ensuring optimal dosing, safety monitoring, and patient care.
In-depth analysis reveals that hospital pharmacies benefit from direct integration with cancer treatment protocols, making them the preferred channel for liposomal doxorubicin delivery. They enable immediate availability and administration of the drug in infusion centers, which is essential due to the intravenous route and careful management needed for patients undergoing chemotherapy. Furthermore, hospitals offer comprehensive patient support services, including monitoring adverse effects and providing education, which enhances treatment adherence. Retail and mail-order pharmacies, while growing, face limitations due to these clinical requirements.
From 2025 to 2035, market growth will be driven by increasing cancer diagnosis rates globally, rising prevalence of breast, ovarian, and other solid tumors, and expanding healthcare infrastructure, especially in emerging markets. Technological advancements in liposomal drug delivery systems enhance targeted therapy with reduced toxicity, encouraging wider clinical adoption. Growing patient awareness and demand for safer chemotherapy options are further fueling market expansion. However, high treatment costs and stringent regulatory requirements remain challenges hindering faster growth.
Health Awareness and Clinical Innovation Boost Liposomal Doxorubicin Market Growth
Increasing awareness among oncologists and patients about the benefits of liposomal doxorubicin over conventional formulations is a major growth driver. Advanced clinical data supporting improved efficacy and safety profiles promote its inclusion in treatment guidelines. Innovations in nanotechnology, personalized therapy approaches, and combination treatments improve patient outcomes and reduce side effects. Expansion of hospital pharmacies and specialized oncology centers ensures efficient drug distribution and administration, further supporting market penetration.
Innovation and Sustainability Expanding Liposomal Doxorubicin Market Opportunities
Continuous innovation in liposomal encapsulation technology, such as enhanced targeting and controlled release, is broadening market opportunities. Development of next-generation liposomal formulations aims to improve bioavailability and reduce cardiotoxicity. Pharmaceutical companies focus on sustainable manufacturing practices and compliance with evolving regulatory standards. Patient-centric approaches, including enhanced safety monitoring and support programs, are becoming key differentiators. These trends collectively drive long-term growth potential and reinforce the market’s resilience globally.
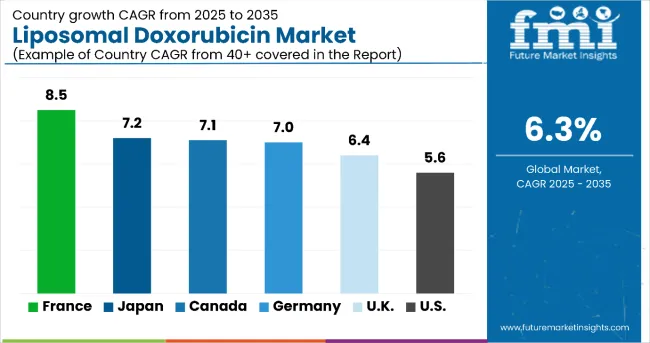
| Countries | CAGR (%) |
|---|---|
| France | 8.5 |
| Japan | 7.2 |
| Canada | 7.1 |
| Germany | 7.0 |
| United Kingdom | 6.4 |
| United States | 5.6 |
The liposomal doxorubicin market shows diverse growth across countries, driven by healthcare infrastructure, cancer rates, and government policies. France leads with an 8.5% CAGR due to strong healthcare investment and cancer screening programs. Japan follows at 7.2%, supported by an aging population and medical innovation. Canada and Germany grow at around 7.0%, backed by solid healthcare systems and R&D. The UK expands steadily at 6.4% with NHS support. Italy grows moderately at 5.9%, aided by oncology infrastructure, while the mature USA market grows at 5.6%, fueled by research funding and healthcare coverage. These rates reveal regional opportunities and market dynamics.
The report covers an in-depth analysis of 40+ countries; six top-performing OECD countries are highlighted below.
Revenue from the liposomal doxorubicin in Canada is witnessing strong growth with a CAGR of 7.1%, fueled by increasing cancer prevalence and progressive healthcare policies. The country’s well-established healthcare system supports the wide adoption of advanced chemotherapy drugs such as liposomal doxorubicin. Government initiatives and cancer awareness programs are enhancing patient access and physician acceptance. Investment in oncology research and clinical trials facilitates innovation and improved treatment outcomes. The prominence of hospital pharmacies ensures effective distribution and administration. Emerging partnerships between pharmaceutical companies and healthcare providers strengthen supply chain reliability. Continuous improvements in regulatory frameworks contribute to faster approvals and market entry. These factors collectively support sustained market expansion and position Canada as a key player in global liposomal doxorubicin demand.
Revenue from liposomal doxorubicin in Japan is projected to grow at a CAGR of 7.2%, driven by its aging population and advanced medical infrastructure. The growing incidence of cancers necessitating liposomal doxorubicin boosts demand. Strong government investment in healthcare innovation accelerates drug development and clinical adoption. Partnerships between pharma companies and research centers enable cutting-edge nanomedicine breakthroughs. Hospital pharmacies play a pivotal role in drug distribution and patient care, ensuring seamless treatment access. Regulatory agencies streamline approvals for innovative formulations. Increased patient awareness and advocacy contribute to market growth. Japan's commitment to personalized oncology therapies further propels liposomal doxorubicin adoption. The country remains instrumental in setting regional industry standards and expanding liposomal drug utilization.
Revenue from the liposomal doxorubicin in Germany grows at a CAGR of 7.0%, supported by a robust pharmaceutical sector and strict regulatory standards. High-quality manufacturing capabilities and ongoing R&D investments underpin drug innovation and availability. The country’s reimbursement policies encourage clinical utilization of advanced chemotherapy options. Hospital and retail pharmacies ensure widespread distribution. There is strong healthcare provider acceptance of targeted liposomal formulations due to demonstrated clinical benefits. Germany acts as a hub for oncology clinical trials enhancing market penetration. Collaborative efforts between government agencies and industry stakeholders foster a conducive environment for market growth. These structural elements collectively sustain Germany’s leading position in liposomal doxorubicin adoption.
Demand for liposomal doxorubicin in the UK, growing at a CAGR of 6.4%, benefits from NHS support for innovative cancer treatments and cost-effective therapy strategies. National research initiatives advance understanding of liposomal drug benefits. Patient-focused healthcare policies enable improved treatment access. Partnerships between pharma firms and oncology centers facilitate localized drug supply. Hospital pharmacies remain the cornerstone of distribution and patient management. Rising patient advocacy increases demand for safer chemotherapy alternatives. The UK prioritizes quality of life improvements, fueling interest in targeted liposomal therapies. These strategies enable steady market development within the country.
Demand for liposomal doxorubicin in France leads with an 8.5% CAGR, driven by significant government investments in healthcare and oncology innovation. Rising breast and ovarian cancer rates increase the demand for liposomal doxorubicin. Extensive screening and awareness programs support early diagnosis and treatment uptake. Pharmaceutical innovation is encouraged through government grants and policies. Hospital pharmacy networks enable efficient drug distribution and administration. Patient assistance programs improve access and adherence. Collaborative R&D efforts foster continuous product improvements. France’s strategic focus on advanced therapies positions it as a high-growth market for liposomal doxorubicin.
Demand for liposomal doxorubicin in the USA, with a CAGR of 5.6%, reflects a mature yet expanding landscape fueled by substantial oncology research investments. Regulatory agencies promote access to novel liposomal formulations. Health insurance coverage extends treatment affordability. Extensive healthcare networks ensure broad drug distribution. Patient and physician awareness campaigns improve market penetration. Emerging pipeline candidates drive continuous innovation. Collaborative healthcare-provider partnerships facilitate treatment adherence. These factors collectively contribute to steady market growth and leadership in liposomal chemotherapy.
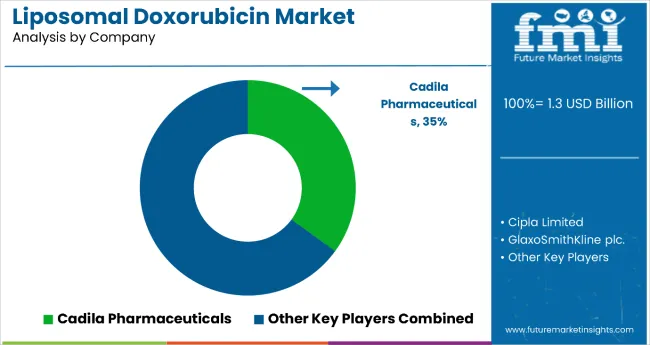
The Liposomal Doxorubicin Market is expanding steadily as oncology treatment paradigms shift toward targeted and less toxic drug delivery systems. Leading companies such as Johnson & Johnson Services Inc. and Merck & Co. Inc. are at the forefront of advancing liposomal formulations that enhance the bioavailability of doxorubicin while minimizing cardiotoxic side effects. GlaxoSmithKline plc continues to strengthen its oncology pipeline through investments in nanotechnology-based therapeutics and collaborations focused on improving liposomal drug stability and controlled release mechanisms.
Cipla Limited and Cadila Pharmaceuticals Ltd. are leveraging their strong manufacturing capabilities to introduce cost-effective liposomal doxorubicin products, making cancer therapies more accessible in emerging markets. The growing prevalence of breast, ovarian, and multiple myeloma cancers, along with improved healthcare infrastructure in developing economies, is boosting product adoption across hospital and specialty pharmacy channels.
The industry is also witnessing increased regulatory support for liposomal formulations due to their enhanced therapeutic index and patient compliance benefits. With ongoing clinical research and strategic partnerships between pharmaceutical companies and research institutions, the market is set to witness further innovation, particularly in long-circulating and tumor-targeted liposomal variants designed to improve survival outcomes and reduce adverse effects.
| Items | Values |
|---|---|
| Quantitative Units (2025) | USD 1.3 billion |
| Type | Branded, Generic |
| Application | Breast Cancer, Ovarian Cancer, AIDS-related Kaposi's Sarcoma, Multiple Myeloma, Other Solid Tumors (including lung, pancreatic, sarcomas) |
| Distribution Channel | Hospital Pharmacies, Retail Pharmacies, Mail-Order Pharmacies |
| Regions Covered | North America, Latin America, Western Europe, Eastern Europe, South Asia and Pacific, East Asia, Middle East and Africa |
| Countries Covered | United States, Canada, United Kingdom, Germany, France, Italy, Japan, China, India, Brazil, Australia, and 40+ countries |
| Key Companies Profiled |
Cadila Pharmaceuticals Ltd., Johnson & Johnson Services Inc., Cipla Limited, GlaxoSmithKline plc, Merck & Co. Inc. |
| Additional Attributes | Revenue by type and application; regional demand trends; competitive landscape; adoption of advanced liposomal formulations; innovations in drug delivery; healthcare infrastructure expansion; rising cancer prevalence; patient awareness; oncology facility growth worldwide |
The global liposomal doxorubicin market is estimated to be valued at USD 1.3 billion in 2025.
The market size for liposomal doxorubicin is projected to reach USD 2.4 billion by 2035.
The liposomal doxorubicin market is expected to grow at a 6.3% CAGR between 2025 and 2035.
The branded segment is projected to lead in the liposomal doxorubicin market with 87% market share in 2025.
In terms of distribution, hospital pharmacies are projected to command 62% share in the liposomal doxorubicin market in 2025.


Full Research Suite comprises of:
Market outlook & trends analysis
Interviews & case studies
Strategic recommendations
Vendor profiles & capabilities analysis
5-year forecasts
8 regions and 60+ country-level data splits
Market segment data splits
12 months of continuous data updates
DELIVERED AS:
PDF EXCEL ONLINE

Thank you!
You will receive an email from our Business Development Manager. Please be sure to check your SPAM/JUNK folder too.
Chat With
MaRIA