Lutein Market Size and Share Forecast Outlook 2025 to 2035

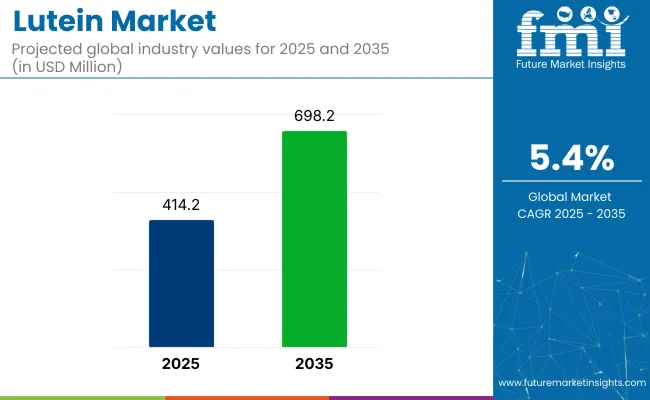
The lutein market is projected to grow from USD 414.2 million in 2025 to USD 698.2 million by 2035, registering a CAGR of 5.4%.
Quick Stats for lutein market

  • Market Value (2025): USD 414.2 million
  • Forecast Value (2035): USD 698.2 million
  • Forecast CAGR: 5.4%
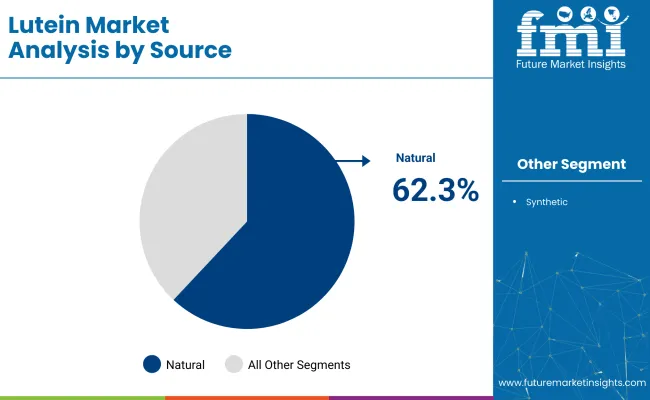
  • Source Leaderin 2025: Natural (62.3% market share)
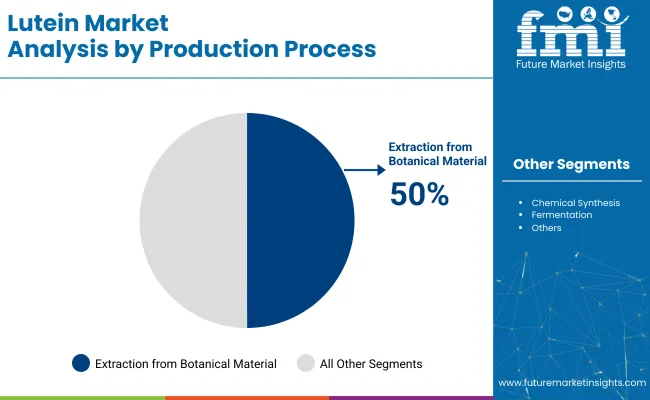
  • TopProduction Process Segment: Extraction from Botanical Material (50% share)
  • Key Growth Region: North America (USA is the fastest-growing market with 5.5% CAGR)

Lutein Market

Metric Value
Industry Size (2025) USD 414.2 Million
Industry Value (2035) USD 698.2 Million
CAGR (2025 to 2035) 5.4%

The market expansion is driven by rising consumer awareness regarding eye health, increasing demand for natural ingredients in dietary supplements and functional foods, and expanding applications in pharmaceuticals and personal care products. The demand is increasing by innovations in extraction techniques and the growing trend towards clean-label and plant-based formulations.

The market holds an approximately 100% share within the carotenoid-based eye health supplements segment, underscoring its central role in this field. It contributes around 10-12% to the functional food ingredients market, where it plays a significant role in fortification and antioxidant applications.

In the dietary supplements market, its share is approximately 4-6%, emphasizing its importance as a specialized ingredient. Within the natural colorants market, it accounts for roughly 3-5%, supporting its use as a natural yellow-orange pigment in food and beverages.

Government regulations impacting the market focus on improving extraction efficiency, purity, and bioavailability. Advancements such as supercritical CO2 extraction, microencapsulation technologies, and lipid-based delivery systems are enhancing lutein stability, solubility, and absorption in human diets.

These technological developments are being integrated with sustainability-focused sourcing, particularly marigold flower cultivation, to ensure consistent supply and minimal environmental impact, thereby enhancing market penetration and meeting regulatory standards for natural products.

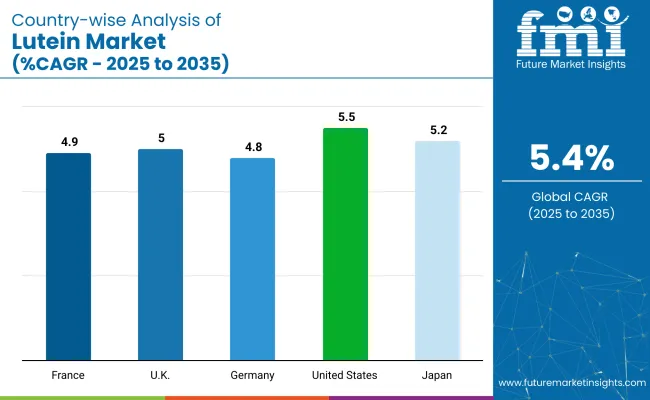
The USA is expected to be the fastest-growing market, with a projected CAGR of 5.5% from 2025 to 2035. The natural will dominate the source segment, accounting for over 62.3% of the market share in 2025. Powder and crystalline forms will lead the form segment, capturing 35.6% of the market share in 2025. Japan is forecasted to grow at a CAGR of 5.2%, while France is projected to grow at a CAGR of 4.9%.

Analyzing Lutein Market by Top Investment Segments

The lutein market is segmented by source, form, production process, application, and region. By source, the market is bifurcated into natural and synthetic. Based on form, the market is categorized into powder &crystalline, oil suspension, beadlet, and emulsion.

By production process, the market is segmented into chemical synthesis, extraction from botanical material, fermentation, and algae route. In terms of application, the market is divided into food, beverages, dietary supplements, animal feed, pharmaceuticals, and cosmetics & personal care products. Regionally, the market is classified into North America, Latin America, Western Europe, Eastern Europe, Balkans & Baltic, Russia & Belarus, Central Asia, East Asia, South Asia & Pacific, and Middle East & Africa.

Natural to Lead the Source Segment with Over 62.3% Market Share

Natural is projected to lead the source segment, accounting for over 62.3% of the global market share by 2025. Derived mainly from marigold flowers, natural lutein is preferred due to its clean-label positioning, non-GMO status, and superior bioavailability compared to synthetic alternatives.
  • Consumer preference for plant-based and clean-label products is driving natural lutein demand.
  • Manufacturers are investing in sustainable marigold cultivation to ensure consistent raw material supply.

Lutein Market By Source

Powder and Crystalline to Dominate Form Segment with Approximately 35.6% Market Share

Powder and crystalline are expected to lead the form segment, accounting for approximately 35.6% market share in 2025. These forms are widely used due to their stability, ease of formulation, and compatibility with multiple end-use applications.

  • Powdered lutein is preferred for dietary supplements, functional beverages, and food fortification.
  • Microencapsulation techniques are enhancing lutein stability and controlled release in formulations.

Extraction from Botanical Material to Lead Production Process Segment with Over 50% Market Share

Extraction from botanical materials is projected to lead the production process segment, accounting for over 50% of the global market share by 2025. This process is widely adopted due to its alignment with natural ingredient trends and consumer preference for plant-derived products.
  • Advanced extraction methods such as supercritical CO₂ and solvent-free techniques enhance yield and purity.
  • Manufacturers are focusing on eco-friendly extraction to reduce environmental impact.

Lutein Market By Production Process

Dietary Supplements to Dominate Application Segment with Approximately 40% Market Share

Dietary supplements are expected to lead the application segment, accounting for approximately 40% market share in 2025. Rising consumer awareness about eye health, cognitive benefits, and antioxidant properties is driving the inclusion of lutein in supplements.

  • Lutein is incorporated in eye health formulations targeting age-related macular degeneration prevention.
  • Combination products with zeaxanthin and omega-3s are gaining popularity for holistic eye care.

Top Lutein Market Dynamics

The lutein market has been experiencing steady growth, driven by increasing consumer awareness of eye health benefits, rising demand for natural and plant-based ingredients in dietary supplements and functional foods, and advancements in extraction and formulation technologies enhancing bioavailability and stability.

Recent Trends in the Lutein Market

  • Growing incorporation of lutein in functional foods and beverages, such as fortified dairy products and nutritional drinks.
  • Advancements in supercritical CO₂ extraction and microencapsulation technologies to improve lutein purity and stability.

Challenges in the Lutein Market

  • High production costs of natural lutein compared to synthetic alternatives affect pricing strategies.
  • Limited consumer awareness in developing regions regarding the health benefits of lutein supplements.

Top Countries Exporting, Distributing, and Supplying Lutein

Country Wise Analysis Of Lutein Market

The USA leads with a CAGR of 5.5%, driven by strong demand in dietary supplements and functional foods. While the Japan market is growing at 5.2% CAGR, UK at 5% CAGR, Germany at 4.8%, and France at 4.9% CAGR.

The USA shows the highest growth, while Germany records the lowest CAGR among these leading countries in the lutein market. These countries play a vital role in regulating, supplying, and distributing lutein globally, with structured regulatory frameworks and strong cross-border supply chains.

While, the USA leads in volume and innovation; Japan’s market is shaped by healthcare-driven demand. Together, the UK, Germany, and France collectively support market expansion through innovation in nutraceutical applications, functional foods, and export-grade formulations aligned with clean-label and wellness trends.

The report covers an in-depth analysis of 40+ countries; five top-performing OECD countries are highlighted below.

In-depth Analysis of Lutein Demand in the USA

The demand for lutein in the USA is projected to grow at a CAGR of 5.5% from 2025 to 2035. Growth is driven by increasing awareness of eye health benefits, rising dietary supplement consumption, and food fortification trends.

  • Strong demand for lutein-based eye health supplements among aging populations.
  • Integration into functional foods, beverages, and dairy products is expanding.

Growth Outlook for Lutein in the UK

The UK lutein revenue is forecast to expand at a CAGR of 5% over the forecast period. Demand is driven by clean-label dietary supplement trends, high awareness of lutein’s eye health benefits, and fortified food innovations.

  • Fortified cereals, bakery products, and beverages are primary growth drivers.
  • Rising demand for vegan, plant-based lutein supplements supports market expansion.

Expansion Trends for the Lutein in Germany

The demand for lutein in Germany is projected to expand at a CAGR of 4.8% between 2025 and 2035. Growth is supported by advanced food ingredient technologies, high focus on natural antioxidants, and increasing dietary supplement usage.

  • Manufacturers are incorporating lutein into functional dairy and confectionery products.
  • Demand for natural colorants in food and beverage applications is rising.

Steady Expansion of Lutein in France

The French lutein market is expected to grow at a CAGR of 4.9% from 2025 to 2035. Growth is driven by increasing demand for plant-based supplements, expanding eye health product portfolios, and clean-label consumer trends.

  • Rising popularity of lutein-enriched dietary supplements for eye and skin health.
  • Investments in sustainable marigold cultivation for natural lutein sourcing are increasing.

Lutein Sales Analysis in Japan

The sales of lutein in Japan are forecast to grow at a CAGR of 5.2% during the forecast period. Growth is driven by an aging population, high consumer awareness of eye health, and integration of lutein into functional foods and nutraceuticals.

  • Lutein-based eye health supplements remain in high demand among elderly consumers.
  • Functional beverages and fortified dairy products with lutein are gaining market share.

Leading Lutein Suppliers and Distributors

The lutein market is moderately consolidated, with global leaders and regional firms shaping competition through advanced extraction methods, microencapsulation technologies, and a growing range of applications in dietary supplements, functional foods, and personal care formulations.

Tier-one companies such as DSM Nutritional Products, BASF SE, Kemin Industries, Chr. Hansen Holding, and Allied Biotech Corporation focus heavily on proprietary extraction and purification techniques that ensure high-purity lutein with superior bioavailability. These players have also prioritized formulation stability, enabling broader product integration in heat- and light-sensitive delivery systems.

Strategic investments in clean-label ingredients and vertical integration help secure reliable sourcing, particularly from marigold flowers. In parallel, regional firms across Asia and Latin America are enhancing competitive intensity through cost-efficient production and tailored blends. Partnerships with contract manufacturers and branded nutraceutical companies are also growing, expanding lutein’s presence in eye health, skincare, and anti-aging applications across major global markets.

Recent Lutein Industry News

  • In May 2024, OmniActive Health Technologies partnered with the Council of Responsible Nutrition to promote awareness of lutein and zeaxanthin's role in prenatal health at ACOG’s Annual Clinical & Scientific Meeting among maternal healthcare professionals.

Lutein Market Report Scope

Report Attributes Details
Current Total Market Size (2025) USD 414.2 million
Projected Market Size (2035) USD 698.2 million
CAGR (2025 to 2035) 5.4%
Base Year for Estimation 2024
Historical Period 2019 to 2024
Projections Period 2025 to 2035
Report Parameters Revenue in USD million/Volume in tons
By Source Natural and Synthetic
By Form Powder and Crystalline, Oil Suspension, Beadlet, and Emulsion
By Production Process Chemical Synthesis, Extraction from Botanical Material, Fermentation, and Algae Route
By Application Food, Beverages, Dietary Supplements, Animal Feed, Pharmaceuticals, and Cosmetics & Personal Care Products
Regions Covered North America, Latin America, Western Europe, Eastern Europe, Balkans & Baltic, Russia & Belarus, Central Asia, East Asia, South Asia & Pacific, and Middle East & Africa
Countries Covered United States, Canada, United Kingdom, Germany, France, China, Japan, South Korea, Brazil, Australia
Key Players DSM Nutritional Products, BASF SE, Kemin Industries, Chr. Hansen Holding, Allied Biotech Corporation, E.I.D. Parry (India) Ltd., OmniActive Health, Zhejiang Medicine Co., Ltd., Fenchem Biotek Ltd., PIVEG, Inc., Valensa International, Lycored Limited, Synthite Industries, Vidya Herbs Pvt. Ltd.
Additional Attributes Market share analysis by source and form, country-wise CAGR analysis, and supplier positioning insights

Key Segments

By Source:

As per Source, the industry has been categorized into Natural, and Synthetic.

By Form:

As per Form, the industry has been categorized into Powder and Crystalline, Oil Suspension, Beadlet, and Emulsion.

By Production Process:

As per Production Process, the industry has been categorized into Chemical Synthesis, Extraction from Botanical Material, Fermentation, and Algae Route.

By Application:

This segment is further categorized into Food, Beverages, Dietary Supplements, Animal Feed, Pharmaceuticals, and Cosmetics & Personal Care Products.

By Region:

Industry analysis has been carried out in key countries of North America, Latin America, Western Europe, Eastern Europe, East Asia, South Asia & Pacific, Central Asia, Russia and Belarus, Balkan & Baltics, and the Middle East & Africa.

Table of Content

  1. Executive Summary
    • Global Market Outlook
    • Demand-side Trends
    • Supply-side Trends
    • Technology Roadmap Analysis
    • Analysis and Recommendations
  2. Market Overview
    • Market Coverage / Taxonomy
    • Market Definition / Scope / Limitations
  3. Market Background
    • Market Dynamics
      • Drivers
      • Restraints
      • Opportunity
      • Trends
    • Scenario Forecast
      • Demand in Optimistic Scenario
      • Demand in Likely Scenario
      • Demand in Conservative Scenario
    • Opportunity Map Analysis
    • Product Life Cycle Analysis
    • Supply Chain Analysis
      • Supply Side Participants and their Roles
        • Producers
        • Mid-Level Participants (Traders/ Agents/ Brokers)
        • Wholesalers and Distributors
      • Value Added and Value Created at Node in the Supply Chain
      • List of Raw Material Suppliers
      • List of Existing and Potential Buyer’s
    • Investment Feasibility Matrix
    • Value Chain Analysis
      • Profit Margin Analysis
      • Wholesalers and Distributors
      • Retailers
    • PESTLE and Porter’s Analysis
    • Regulatory Landscape
      • By Key Regions
      • By Key Countries
    • Regional Parent Market Outlook
    • Production and Consumption Statistics
    • Import and Export Statistics
  4. Global Market Analysis 2020 to 2024 and Forecast, 2025 to 2035
    • Historical Market Size Value (USD Million) & Volume (Tons) Analysis, 2020 to 2024
    • Current and Future Market Size Value (USD Million) & Volume (Tons) Projections, 2025 to 2035
      • Y-o-Y Growth Trend Analysis
      • Absolute $ Opportunity Analysis
  5. Global Market Pricing Analysis 2020 to 2024 and Forecast 2025 to 2035
  6. Global Market Analysis 2020 to 2024 and Forecast 2025 to 2035, By Source
    • Introduction / Key Findings
    • Historical Market Size Value (USD Million) & Volume (Tons) Analysis By Source, 2020 to 2024
    • Current and Future Market Size Value (USD Million) & Volume (Tons) Analysis and Forecast By Source, 2025 to 2035
      • Natural
      • Synthetic
    • Y-o-Y Growth Trend Analysis By Source, 2020 to 2024
    • Absolute $ Opportunity Analysis By Source, 2025 to 2035
  7. Global Market Analysis 2020 to 2024 and Forecast 2025 to 2035, By Form
    • Introduction / Key Findings
    • Historical Market Size Value (USD Million) & Volume (Tons) Analysis By Form, 2020 to 2024
    • Current and Future Market Size Value (USD Million) & Volume (Tons) Analysis and Forecast By Form, 2025 to 2035
      • Powder and Crystalline
      • Oil Suspension
      • Beadlet
      • Emulsion
    • Y-o-Y Growth Trend Analysis By Form, 2020 to 2024
    • Absolute $ Opportunity Analysis By Form, 2025 to 2035
  8. Global Market Analysis 2020 to 2024 and Forecast 2025 to 2035, By Production Process
    • Introduction / Key Findings
    • Historical Market Size Value (USD Million) & Volume (Tons) Analysis By Production Process, 2020 to 2024
    • Current and Future Market Size Value (USD Million) & Volume (Tons) Analysis and Forecast By Production Process, 2025 to 2035
      • Chemical Synthesis
      • Extraction from Botanical Material
      • Fermentation
      • Algae Route
    • Y-o-Y Growth Trend Analysis By Production Process, 2020 to 2024
    • Absolute $ Opportunity Analysis By Production Process, 2025 to 2035
  9. Global Market Analysis 2020 to 2024 and Forecast 2025 to 2035, By Application
    • Introduction / Key Findings
    • Historical Market Size Value (USD Million) & Volume (Tons) Analysis By Application, 2020 to 2024
    • Current and Future Market Size Value (USD Million) & Volume (Tons) Analysis and Forecast By Application, 2025 to 2035
      • Food
      • Beverages
      • Dietary Supplements
      • Animal Feed
      • Pharmaceuticals
      • Cosmetics & Personal Care Products
    • Y-o-Y Growth Trend Analysis By Application, 2020 to 2024
    • Absolute $ Opportunity Analysis By Application, 2025 to 2035
  10. Global Market Analysis 2020 to 2024 and Forecast 2025 to 2035, By Region
    • Introduction
    • Historical Market Size Value (USD Million) & Volume (Tons) Analysis By Region, 2020 to 2024
    • Current Market Size Value (USD Million) & Volume (Tons) Analysis and Forecast By Region, 2025 to 2035
      • North America
      • Latin America
      • Western Europe
      • Eastern Europe
      • East Asia
      • South Asia & Pacific
      • Middle East and Africa
    • Market Attractiveness Analysis By Region
  11. North America Market Analysis 2020 to 2024 and Forecast 2025 to 2035, By Country
    • Historical Market Size Value (USD Million) & Volume (Tons) Trend Analysis By Market Taxonomy, 2020 to 2024
    • Market Size Value (USD Million) & Volume (Tons) Forecast By Market Taxonomy, 2025 to 2035
      • By Country
        • USA
        • Canada
        • Mexico
      • By Source
      • By Form
      • By Production Process
      • By Application
    • Market Attractiveness Analysis
      • By Country
      • By Source
      • By Form
      • By Production Process
      • By Application
    • Key Takeaways
  12. Latin America Market Analysis 2020 to 2024 and Forecast 2025 to 2035, By Country
    • Historical Market Size Value (USD Million) & Volume (Tons) Trend Analysis By Market Taxonomy, 2020 to 2024
    • Market Size Value (USD Million) & Volume (Tons) Forecast By Market Taxonomy, 2025 to 2035
      • By Country
        • Brazil
        • Argentina
        • Rest of LATAM
      • By Source
      • By Form
      • By Production Process
      • By Application
    • Market Attractiveness Analysis
      • By Country
      • By Source
      • By Form
      • By Production Process
      • By Application
    • Key Takeaways
  13. Western Europe Market Analysis 2020 to 2024 and Forecast 2025 to 2035, By Country
    • Historical Market Size Value (USD Million) & Volume (Tons) Trend Analysis By Market Taxonomy, 2020 to 2024
    • Market Size Value (USD Million) & Volume (Tons) Forecast By Market Taxonomy, 2025 to 2035
      • By Country
        • Germany
        • Italy
        • France
        • UK
        • Spain
        • BENELUX
        • Nordic
        • Rest of W.Europe
      • By Source
      • By Form
      • By Production Process
      • By Application
    • Market Attractiveness Analysis
      • By Country
      • By Source
      • By Form
      • By Production Process
      • By Application
    • Key Takeaways
  14. Eastern Europe Market Analysis 2020 to 2024 and Forecast 2025 to 2035, By Country
    • Historical Market Size Value (USD Million) & Volume (Tons) Trend Analysis By Market Taxonomy, 2020 to 2024
    • Market Size Value (USD Million) & Volume (Tons) Forecast By Market Taxonomy, 2025 to 2035
      • By Country
        • Russia
        • Hungary
        • Poland
        • Balkan & Baltics
        • Rest of E. Europe
      • By Source
      • By Form
      • By Production Process
      • By Application
    • Market Attractiveness Analysis
      • By Country
      • By Source
      • By Form
      • By Production Process
      • By Application
    • Key Takeaways
  15. East Asia Market Analysis 2020 to 2024 and Forecast 2025 to 2035, By Country
    • Historical Market Size Value (USD Million) & Volume (Tons) Trend Analysis By Market Taxonomy, 2020 to 2024
    • Market Size Value (USD Million) & Volume (Tons) Forecast By Market Taxonomy, 2025 to 2035
      • By Country
        • China
        • Japan
        • South Korea
      • By Source
      • By Form
      • By Production Process
      • By Application
    • Market Attractiveness Analysis
      • By Country
      • By Source
      • By Form
      • By Production Process
      • By Application
    • Key Takeaways
  16. South Asia & Pacific Market Analysis 2020 to 2024 and Forecast 2025 to 2035, By Country
    • Historical Market Size Value (USD Million) & Volume (Tons) Trend Analysis By Market Taxonomy, 2020 to 2024
    • Market Size Value (USD Million) & Volume (Tons) Forecast By Market Taxonomy, 2025 to 2035
      • By Country
        • India
        • Australia & New Zealand
        • ASEAN
        • Rest of SAP
      • By Source
      • By Form
      • By Production Process
      • By Application
    • Market Attractiveness Analysis
      • By Country
      • By Source
      • By Form
      • By Production Process
      • By Application
    • Key Takeaways
  17. Middle East and Africa Market Analysis 2020 to 2024 and Forecast 2025 to 2035, By Country
    • Historical Market Size Value (USD Million) & Volume (Tons) Trend Analysis By Market Taxonomy, 2020 to 2024
    • Market Size Value (USD Million) & Volume (Tons) Forecast By Market Taxonomy, 2025 to 2035
      • By Country
        • GCC Countries
        • Northern Africa
        • South Africa
        • Turkiye
        • Rest of MEA
      • By Source
      • By Form
      • By Production Process
      • By Application
    • Market Attractiveness Analysis
      • By Country
      • By Source
      • By Form
      • By Production Process
      • By Application
    • Key Takeaways
  18. Key Countries Market Analysis
    • USA
      • Pricing Analysis
      • Market Share Analysis, 2024
        • By Source
        • By Form
        • By Production Process
        • By Application
    • Canada
      • Pricing Analysis
      • Market Share Analysis, 2024
        • By Source
        • By Form
        • By Production Process
        • By Application
    • Brazil
      • Pricing Analysis
      • Market Share Analysis, 2024
        • By Source
        • By Form
        • By Production Process
        • By Application
    • Mexico
      • Pricing Analysis
      • Market Share Analysis, 2024
        • By Source
        • By Form
        • By Production Process
        • By Application
    • Argentina
      • Pricing Analysis
      • Market Share Analysis, 2024
        • By Source
        • By Form
        • By Production Process
        • By Application
  19. Market Structure Analysis
    • Competition Dashboard
    • Competition Benchmarking
    • Market Share Analysis of Top Players
      • By Regional
      • By Source
      • By Form
      • By Production Process
      • By Application
  20. Competition Analysis
    • Competition Deep Dive
      • DSM Nutritional Products
        • Overview
        • Product Portfolio
        • Profitability by Market Segments (Product/Age /Sales Channel/Region)
        • Sales Footprint
        • Strategy Overview
          • Marketing Strategy
          • Product Strategy
          • Channel Strategy
      • BASF SE
        • Overview
        • Product Portfolio
        • Profitability by Market Segments (Product/Age /Sales Channel/Region)
        • Sales Footprint
        • Strategy Overview
          • Marketing Strategy
          • Product Strategy
          • Channel Strategy
      • Kemin Industries
        • Overview
        • Product Portfolio
        • Profitability by Market Segments (Product/Age /Sales Channel/Region)
        • Sales Footprint
        • Strategy Overview
          • Marketing Strategy
          • Product Strategy
          • Channel Strategy
      • Chr. Hansen Holding
        • Overview
        • Product Portfolio
        • Profitability by Market Segments (Product/Age /Sales Channel/Region)
        • Sales Footprint
        • Strategy Overview
          • Marketing Strategy
          • Product Strategy
          • Channel Strategy
      • Allied Biotech Corporation
        • Overview
        • Product Portfolio
        • Profitability by Market Segments (Product/Age /Sales Channel/Region)
        • Sales Footprint
        • Strategy Overview
          • Marketing Strategy
          • Product Strategy
          • Channel Strategy
      • E.I.D. Parry (India) Ltd.
        • Overview
        • Product Portfolio
        • Profitability by Market Segments (Product/Age /Sales Channel/Region)
        • Sales Footprint
        • Strategy Overview
          • Marketing Strategy
          • Product Strategy
          • Channel Strategy
      • OMillioniActive Health
        • Overview
        • Product Portfolio
        • Profitability by Market Segments (Product/Age /Sales Channel/Region)
        • Sales Footprint
        • Strategy Overview
          • Marketing Strategy
          • Product Strategy
          • Channel Strategy
      • Zhejiang Medicine Co., Ltd.
        • Overview
        • Product Portfolio
        • Profitability by Market Segments (Product/Age /Sales Channel/Region)
        • Sales Footprint
        • Strategy Overview
          • Marketing Strategy
          • Product Strategy
          • Channel Strategy
      • Fenchem Biotek Ltd.
        • Overview
        • Product Portfolio
        • Profitability by Market Segments (Product/Age /Sales Channel/Region)
        • Sales Footprint
        • Strategy Overview
          • Marketing Strategy
          • Product Strategy
          • Channel Strategy
      • PIVEG, Inc.
        • Overview
        • Product Portfolio
        • Profitability by Market Segments (Product/Age /Sales Channel/Region)
        • Sales Footprint
        • Strategy Overview
          • Marketing Strategy
          • Product Strategy
          • Channel Strategy
      • Valensa International
        • Overview
        • Product Portfolio
        • Profitability by Market Segments (Product/Age /Sales Channel/Region)
        • Sales Footprint
        • Strategy Overview
          • Marketing Strategy
          • Product Strategy
          • Channel Strategy
      • Lycored Limited
        • Overview
        • Product Portfolio
        • Profitability by Market Segments (Product/Age /Sales Channel/Region)
        • Sales Footprint
        • Strategy Overview
          • Marketing Strategy
          • Product Strategy
          • Channel Strategy
      • Synthite Industries
        • Overview
        • Product Portfolio
        • Profitability by Market Segments (Product/Age /Sales Channel/Region)
        • Sales Footprint
        • Strategy Overview
          • Marketing Strategy
          • Product Strategy
          • Channel Strategy
      • Vidya Herbs Pvt. Ltd.
        • Overview
        • Product Portfolio
        • Profitability by Market Segments (Product/Age /Sales Channel/Region)
        • Sales Footprint
        • Strategy Overview
          • Marketing Strategy
          • Product Strategy
          • Channel Strategy
      • DDW The Color House
        • Overview
        • Product Portfolio
        • Profitability by Market Segments (Product/Age /Sales Channel/Region)
        • Sales Footprint
        • Strategy Overview
          • Marketing Strategy
          • Product Strategy
          • Channel Strategy
      • INNOBIO Corporation
        • Overview
        • Product Portfolio
        • Profitability by Market Segments (Product/Age /Sales Channel/Region)
        • Sales Footprint
        • Strategy Overview
          • Marketing Strategy
          • Product Strategy
          • Channel Strategy
      • Divi’s Nutraceuticals
        • Overview
        • Product Portfolio
        • Profitability by Market Segments (Product/Age /Sales Channel/Region)
        • Sales Footprint
        • Strategy Overview
          • Marketing Strategy
          • Product Strategy
          • Channel Strategy
      • Algae Health Sciences
        • Overview
        • Product Portfolio
        • Profitability by Market Segments (Product/Age /Sales Channel/Region)
        • Sales Footprint
        • Strategy Overview
          • Marketing Strategy
          • Product Strategy
          • Channel Strategy
      • Fuji Chemical Industry Co.
        • Overview
        • Product Portfolio
        • Profitability by Market Segments (Product/Age /Sales Channel/Region)
        • Sales Footprint
        • Strategy Overview
          • Marketing Strategy
          • Product Strategy
          • Channel Strategy
      • Jarrow Formulas
        • Overview
        • Product Portfolio
        • Profitability by Market Segments (Product/Age /Sales Channel/Region)
        • Sales Footprint
        • Strategy Overview
          • Marketing Strategy
          • Product Strategy
          • Channel Strategy
  21. Assumptions & Acronyms Used
  22. Research Methodology

List of Tables

  • Table 1: Global Market Value (USD Million) Forecast by Region, 2020-2035
  • Table 2: Global Market Volume (Tons) Forecast by Region, 2020-2035
  • Table 3: Global Market Value (USD Million) Forecast by Source, 2020-2035
  • Table 4: Global Market Volume (Tons) Forecast by Source, 2020-2035
  • Table 5: Global Market Value (USD Million) Forecast by Form, 2020-2035
  • Table 6: Global Market Volume (Tons) Forecast by Form, 2020-2035
  • Table 7: Global Market Value (USD Million) Forecast by Production Process, 2020-2035
  • Table 8: Global Market Volume (Tons) Forecast by Production Process, 2020-2035
  • Table 9: Global Market Value (USD Million) Forecast by Application, 2020-2035
  • Table 10: Global Market Volume (Tons) Forecast by Application, 2020-2035
  • Table 11: North America Market Value (USD Million) Forecast by Country, 2020-2035
  • Table 12: North America Market Volume (Tons) Forecast by Country, 2020-2035
  • Table 13: North America Market Value (USD Million) Forecast by Source, 2020-2035
  • Table 14: North America Market Volume (Tons) Forecast by Source, 2020-2035
  • Table 15: North America Market Value (USD Million) Forecast by Form, 2020-2035
  • Table 16: North America Market Volume (Tons) Forecast by Form, 2020-2035
  • Table 17: North America Market Value (USD Million) Forecast by Production Process, 2020-2035
  • Table 18: North America Market Volume (Tons) Forecast by Production Process, 2020-2035
  • Table 19: North America Market Value (USD Million) Forecast by Application, 2020-2035
  • Table 20: North America Market Volume (Tons) Forecast by Application, 2020-2035
  • Table 21: Latin America Market Value (USD Million) Forecast by Country, 2020-2035
  • Table 22: Latin America Market Volume (Tons) Forecast by Country, 2020-2035
  • Table 23: Latin America Market Value (USD Million) Forecast by Source, 2020-2035
  • Table 24: Latin America Market Volume (Tons) Forecast by Source, 2020-2035
  • Table 25: Latin America Market Value (USD Million) Forecast by Form, 2020-2035
  • Table 26: Latin America Market Volume (Tons) Forecast by Form, 2020-2035
  • Table 27: Latin America Market Value (USD Million) Forecast by Production Process, 2020-2035
  • Table 28: Latin America Market Volume (Tons) Forecast by Production Process, 2020-2035
  • Table 29: Latin America Market Value (USD Million) Forecast by Application, 2020-2035
  • Table 30: Latin America Market Volume (Tons) Forecast by Application, 2020-2035
  • Table 31: Western Europe Market Value (USD Million) Forecast by Country, 2020-2035
  • Table 32: Western Europe Market Volume (Tons) Forecast by Country, 2020-2035
  • Table 33: Western Europe Market Value (USD Million) Forecast by Source, 2020-2035
  • Table 34: Western Europe Market Volume (Tons) Forecast by Source, 2020-2035
  • Table 35: Western Europe Market Value (USD Million) Forecast by Form, 2020-2035
  • Table 36: Western Europe Market Volume (Tons) Forecast by Form, 2020-2035
  • Table 37: Western Europe Market Value (USD Million) Forecast by Production Process, 2020-2035
  • Table 38: Western Europe Market Volume (Tons) Forecast by Production Process, 2020-2035
  • Table 39: Western Europe Market Value (USD Million) Forecast by Application, 2020-2035
  • Table 40: Western Europe Market Volume (Tons) Forecast by Application, 2020-2035
  • Table 41: Eastern Europe Market Value (USD Million) Forecast by Country, 2020-2035
  • Table 42: Eastern Europe Market Volume (Tons) Forecast by Country, 2020-2035
  • Table 43: Eastern Europe Market Value (USD Million) Forecast by Source, 2020-2035
  • Table 44: Eastern Europe Market Volume (Tons) Forecast by Source, 2020-2035
  • Table 45: Eastern Europe Market Value (USD Million) Forecast by Form, 2020-2035
  • Table 46: Eastern Europe Market Volume (Tons) Forecast by Form, 2020-2035
  • Table 47: Eastern Europe Market Value (USD Million) Forecast by Production Process, 2020-2035
  • Table 48: Eastern Europe Market Volume (Tons) Forecast by Production Process, 2020-2035
  • Table 49: Eastern Europe Market Value (USD Million) Forecast by Application, 2020-2035
  • Table 50: Eastern Europe Market Volume (Tons) Forecast by Application, 2020-2035
  • Table 51: East Asia Market Value (USD Million) Forecast by Country, 2020-2035
  • Table 52: East Asia Market Volume (Tons) Forecast by Country, 2020-2035
  • Table 53: East Asia Market Value (USD Million) Forecast by Source, 2020-2035
  • Table 54: East Asia Market Volume (Tons) Forecast by Source, 2020-2035
  • Table 55: East Asia Market Value (USD Million) Forecast by Form, 2020-2035
  • Table 56: East Asia Market Volume (Tons) Forecast by Form, 2020-2035
  • Table 57: East Asia Market Value (USD Million) Forecast by Production Process, 2020-2035
  • Table 58: East Asia Market Volume (Tons) Forecast by Production Process, 2020-2035
  • Table 59: East Asia Market Value (USD Million) Forecast by Application, 2020-2035
  • Table 60: East Asia Market Volume (Tons) Forecast by Application, 2020-2035
  • Table 61: South Asia & Pacific Market Value (USD Million) Forecast by Country, 2020-2035
  • Table 62: South Asia & Pacific Market Volume (Tons) Forecast by Country, 2020-2035
  • Table 63: South Asia & Pacific Market Value (USD Million) Forecast by Source, 2020-2035
  • Table 64: South Asia & Pacific Market Volume (Tons) Forecast by Source, 2020-2035
  • Table 65: South Asia & Pacific Market Value (USD Million) Forecast by Form, 2020-2035
  • Table 66: South Asia & Pacific Market Volume (Tons) Forecast by Form, 2020-2035
  • Table 67: South Asia & Pacific Market Value (USD Million) Forecast by Production Process, 2020-2035
  • Table 68: South Asia & Pacific Market Volume (Tons) Forecast by Production Process, 2020-2035
  • Table 69: South Asia & Pacific Market Value (USD Million) Forecast by Application, 2020-2035
  • Table 70: South Asia & Pacific Market Volume (Tons) Forecast by Application, 2020-2035
  • Table 71: Middle East and Africa Market Value (USD Million) Forecast by Country, 2020-2035
  • Table 72: Middle East and Africa Market Volume (Tons) Forecast by Country, 2020-2035
  • Table 73: Middle East and Africa Market Value (USD Million) Forecast by Source, 2020-2035
  • Table 74: Middle East and Africa Market Volume (Tons) Forecast by Source, 2020-2035
  • Table 75: Middle East and Africa Market Value (USD Million) Forecast by Form, 2020-2035
  • Table 76: Middle East and Africa Market Volume (Tons) Forecast by Form, 2020-2035
  • Table 77: Middle East and Africa Market Value (USD Million) Forecast by Production Process, 2020-2035
  • Table 78: Middle East and Africa Market Volume (Tons) Forecast by Production Process, 2020-2035
  • Table 79: Middle East and Africa Market Value (USD Million) Forecast by Application, 2020-2035
  • Table 80: Middle East and Africa Market Volume (Tons) Forecast by Application, 2020-2035

List of Figures

  • Figure 1: Global Market Volume (Tons) Forecast 2020-2035
  • Figure 2: Global Market Pricing Analysis
  • Figure 3: Global Market Value (USD Million) Forecast 2020-2035
  • Figure 4: Global Market Value Share and BPS Analysis by Source, 2025 and 2035
  • Figure 5: Global Market Y-o-Y Growth Comparison by Source, 2025-2035
  • Figure 6: Global Market Attractiveness Analysis by Source
  • Figure 7: Global Market Value Share and BPS Analysis by Form, 2025 and 2035
  • Figure 8: Global Market Y-o-Y Growth Comparison by Form, 2025-2035
  • Figure 9: Global Market Attractiveness Analysis by Form
  • Figure 10: Global Market Value Share and BPS Analysis by Production Process, 2025 and 2035
  • Figure 11: Global Market Y-o-Y Growth Comparison by Production Process, 2025-2035
  • Figure 12: Global Market Attractiveness Analysis by Production Process
  • Figure 13: Global Market Value Share and BPS Analysis by Application, 2025 and 2035
  • Figure 14: Global Market Y-o-Y Growth Comparison by Application, 2025-2035
  • Figure 15: Global Market Attractiveness Analysis by Application
  • Figure 16: Global Market Value (USD Million) Share and BPS Analysis by Region, 2025 and 2035
  • Figure 17: Global Market Y-o-Y Growth Comparison by Region, 2025-2035
  • Figure 18: Global Market Attractiveness Analysis by Region
  • Figure 19: North America Market Incremental $ Opportunity, 2025-2035
  • Figure 20: Latin America Market Incremental $ Opportunity, 2025-2035
  • Figure 21: Western Europe Market Incremental $ Opportunity, 2025-2035
  • Figure 22: Eastern Europe Market Incremental $ Opportunity, 2025-2035
  • Figure 23: East Asia Market Incremental $ Opportunity, 2025-2035
  • Figure 24: South Asia & Pacific Market Incremental $ Opportunity, 2025-2035
  • Figure 25: Middle East and Africa Market Incremental $ Opportunity, 2025-2035
  • Figure 26: North America Market Value Share and BPS Analysis by Country, 2025 and 2035
  • Figure 27: North America Market Value Share and BPS Analysis by Source, 2025 and 2035
  • Figure 28: North America Market Y-o-Y Growth Comparison by Source, 2025-2035
  • Figure 29: North America Market Attractiveness Analysis by Source
  • Figure 30: North America Market Value Share and BPS Analysis by Form, 2025 and 2035
  • Figure 31: North America Market Y-o-Y Growth Comparison by Form, 2025-2035
  • Figure 32: North America Market Attractiveness Analysis by Form
  • Figure 33: North America Market Value Share and BPS Analysis by Production Process, 2025 and 2035
  • Figure 34: North America Market Y-o-Y Growth Comparison by Production Process, 2025-2035
  • Figure 35: North America Market Attractiveness Analysis by Production Process
  • Figure 36: North America Market Value Share and BPS Analysis by Application, 2025 and 2035
  • Figure 37: North America Market Y-o-Y Growth Comparison by Application, 2025-2035
  • Figure 38: North America Market Attractiveness Analysis by Application
  • Figure 39: Latin America Market Value Share and BPS Analysis by Country, 2025 and 2035
  • Figure 40: Latin America Market Value Share and BPS Analysis by Source, 2025 and 2035
  • Figure 41: Latin America Market Y-o-Y Growth Comparison by Source, 2025-2035
  • Figure 42: Latin America Market Attractiveness Analysis by Source
  • Figure 43: Latin America Market Value Share and BPS Analysis by Form, 2025 and 2035
  • Figure 44: Latin America Market Y-o-Y Growth Comparison by Form, 2025-2035
  • Figure 45: Latin America Market Attractiveness Analysis by Form
  • Figure 46: Latin America Market Value Share and BPS Analysis by Production Process, 2025 and 2035
  • Figure 47: Latin America Market Y-o-Y Growth Comparison by Production Process, 2025-2035
  • Figure 48: Latin America Market Attractiveness Analysis by Production Process
  • Figure 49: Latin America Market Value Share and BPS Analysis by Application, 2025 and 2035
  • Figure 50: Latin America Market Y-o-Y Growth Comparison by Application, 2025-2035
  • Figure 51: Latin America Market Attractiveness Analysis by Application
  • Figure 52: Western Europe Market Value Share and BPS Analysis by Country, 2025 and 2035
  • Figure 53: Western Europe Market Value Share and BPS Analysis by Source, 2025 and 2035
  • Figure 54: Western Europe Market Y-o-Y Growth Comparison by Source, 2025-2035
  • Figure 55: Western Europe Market Attractiveness Analysis by Source
  • Figure 56: Western Europe Market Value Share and BPS Analysis by Form, 2025 and 2035
  • Figure 57: Western Europe Market Y-o-Y Growth Comparison by Form, 2025-2035
  • Figure 58: Western Europe Market Attractiveness Analysis by Form
  • Figure 59: Western Europe Market Value Share and BPS Analysis by Production Process, 2025 and 2035
  • Figure 60: Western Europe Market Y-o-Y Growth Comparison by Production Process, 2025-2035
  • Figure 61: Western Europe Market Attractiveness Analysis by Production Process
  • Figure 62: Western Europe Market Value Share and BPS Analysis by Application, 2025 and 2035
  • Figure 63: Western Europe Market Y-o-Y Growth Comparison by Application, 2025-2035
  • Figure 64: Western Europe Market Attractiveness Analysis by Application
  • Figure 65: Eastern Europe Market Value Share and BPS Analysis by Country, 2025 and 2035
  • Figure 66: Eastern Europe Market Value Share and BPS Analysis by Source, 2025 and 2035
  • Figure 67: Eastern Europe Market Y-o-Y Growth Comparison by Source, 2025-2035
  • Figure 68: Eastern Europe Market Attractiveness Analysis by Source
  • Figure 69: Eastern Europe Market Value Share and BPS Analysis by Form, 2025 and 2035
  • Figure 70: Eastern Europe Market Y-o-Y Growth Comparison by Form, 2025-2035
  • Figure 71: Eastern Europe Market Attractiveness Analysis by Form
  • Figure 72: Eastern Europe Market Value Share and BPS Analysis by Production Process, 2025 and 2035
  • Figure 73: Eastern Europe Market Y-o-Y Growth Comparison by Production Process, 2025-2035
  • Figure 74: Eastern Europe Market Attractiveness Analysis by Production Process
  • Figure 75: Eastern Europe Market Value Share and BPS Analysis by Application, 2025 and 2035
  • Figure 76: Eastern Europe Market Y-o-Y Growth Comparison by Application, 2025-2035
  • Figure 77: Eastern Europe Market Attractiveness Analysis by Application
  • Figure 78: East Asia Market Value Share and BPS Analysis by Country, 2025 and 2035
  • Figure 79: East Asia Market Value Share and BPS Analysis by Source, 2025 and 2035
  • Figure 80: East Asia Market Y-o-Y Growth Comparison by Source, 2025-2035
  • Figure 81: East Asia Market Attractiveness Analysis by Source
  • Figure 82: East Asia Market Value Share and BPS Analysis by Form, 2025 and 2035
  • Figure 83: East Asia Market Y-o-Y Growth Comparison by Form, 2025-2035
  • Figure 84: East Asia Market Attractiveness Analysis by Form
  • Figure 85: East Asia Market Value Share and BPS Analysis by Production Process, 2025 and 2035
  • Figure 86: East Asia Market Y-o-Y Growth Comparison by Production Process, 2025-2035
  • Figure 87: East Asia Market Attractiveness Analysis by Production Process
  • Figure 88: East Asia Market Value Share and BPS Analysis by Application, 2025 and 2035
  • Figure 89: East Asia Market Y-o-Y Growth Comparison by Application, 2025-2035
  • Figure 90: East Asia Market Attractiveness Analysis by Application
  • Figure 91: South Asia & Pacific Market Value Share and BPS Analysis by Country, 2025 and 2035
  • Figure 92: South Asia & Pacific Market Value Share and BPS Analysis by Source, 2025 and 2035
  • Figure 93: South Asia & Pacific Market Y-o-Y Growth Comparison by Source, 2025-2035
  • Figure 94: South Asia & Pacific Market Attractiveness Analysis by Source
  • Figure 95: South Asia & Pacific Market Value Share and BPS Analysis by Form, 2025 and 2035
  • Figure 96: South Asia & Pacific Market Y-o-Y Growth Comparison by Form, 2025-2035
  • Figure 97: South Asia & Pacific Market Attractiveness Analysis by Form
  • Figure 98: South Asia & Pacific Market Value Share and BPS Analysis by Production Process, 2025 and 2035
  • Figure 99: South Asia & Pacific Market Y-o-Y Growth Comparison by Production Process, 2025-2035
  • Figure 100: South Asia & Pacific Market Attractiveness Analysis by Production Process
  • Figure 101: South Asia & Pacific Market Value Share and BPS Analysis by Application, 2025 and 2035
  • Figure 102: South Asia & Pacific Market Y-o-Y Growth Comparison by Application, 2025-2035
  • Figure 103: South Asia & Pacific Market Attractiveness Analysis by Application
  • Figure 104: Middle East and Africa Market Value Share and BPS Analysis by Country, 2025 and 2035
  • Figure 105: Middle East and Africa Market Value Share and BPS Analysis by Source, 2025 and 2035
  • Figure 106: Middle East and Africa Market Y-o-Y Growth Comparison by Source, 2025-2035
  • Figure 107: Middle East and Africa Market Attractiveness Analysis by Source
  • Figure 108: Middle East and Africa Market Value Share and BPS Analysis by Form, 2025 and 2035
  • Figure 109: Middle East and Africa Market Y-o-Y Growth Comparison by Form, 2025-2035
  • Figure 110: Middle East and Africa Market Attractiveness Analysis by Form
  • Figure 111: Middle East and Africa Market Value Share and BPS Analysis by Production Process, 2025 and 2035
  • Figure 112: Middle East and Africa Market Y-o-Y Growth Comparison by Production Process, 2025-2035
  • Figure 113: Middle East and Africa Market Attractiveness Analysis by Production Process
  • Figure 114: Middle East and Africa Market Value Share and BPS Analysis by Application, 2025 and 2035
  • Figure 115: Middle East and Africa Market Y-o-Y Growth Comparison by Application, 2025-2035
  • Figure 116: Middle East and Africa Market Attractiveness Analysis by Application
  • Figure 117: Global Market - Tier Structure Analysis
  • Figure 118: Global Market - Company Share Analysis

Frequently Asked Questions

What is the projected size of the lutein market by 2035?

The market is expected to reach USD 698.2 million by 2035.

What is the CAGR of the lutein market from 2025 to 2035?

The market is projected to grow at a CAGR of 5.4% during this period.

Which source holds the highest share in the lutein market in 2025?

Natural lutein is expected to hold the highest share, accounting for over 62.3% of the market in 2025.

Which form holds the highest share in the lutein market in 2025?

Powder and crystalline forms are expected to hold the highest share, accounting for approximately 35.6% of the market in 2025.

Which country is projected to grow fastest in the lutein market?

The USA is anticipated to be the fastest-growing market with a CAGR of 5.5% from 2025 to 2035.

Future Market Insights

Lutein Market