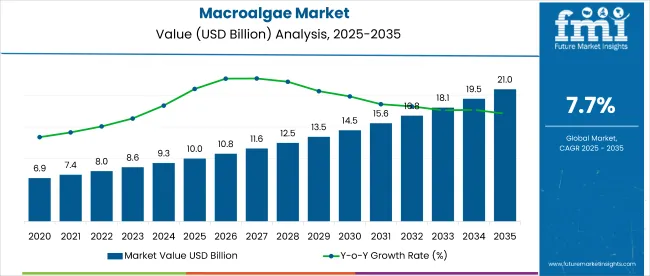
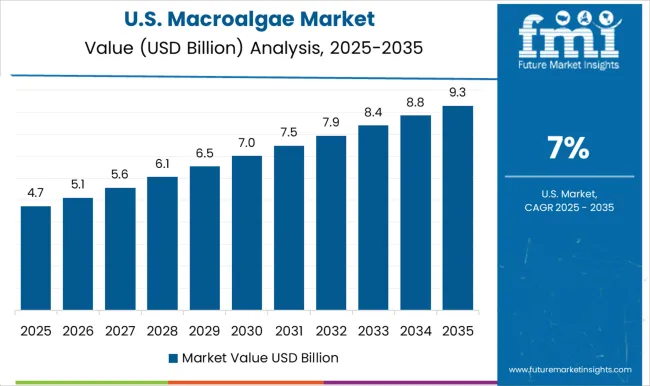
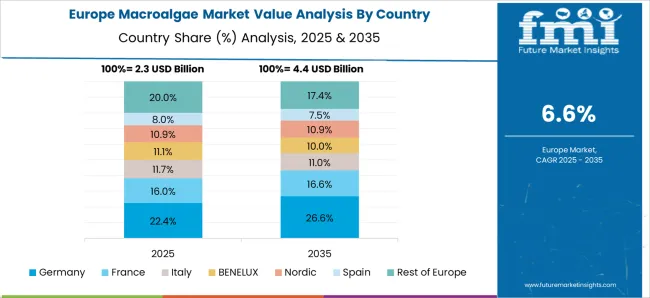
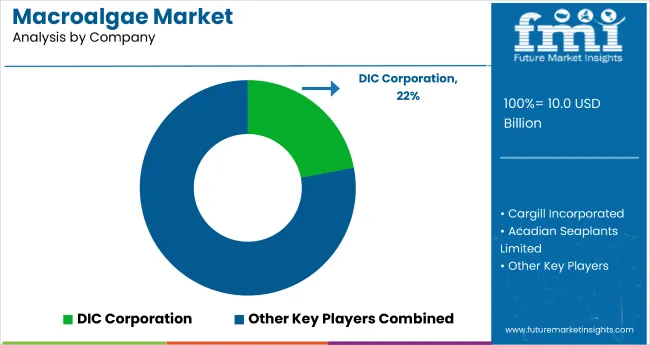
The global Macroalgae Market size is projected to increase from USD 9,302.6 million in 2023 to USD 18,305.12 million by 2033. Over the next ten years (2023 to 2033), global macroalgae sales are anticipated to soar at a 7.8% CAGR.
Key Trends Listed by Future Market Insights (FMI):
Macroalgae or seaweed refers to large, multicellular species of algae. They have gained wider traction amongst consumers due to their several applications across a wide range of sectors. Macroalgae also play a crucial role in capturing carbon and producing oxygen.
Macroalgae is rich in proteins and other essential nutrients. As a result, manufacturers are finding increased demand across the food & beverage industry. Rising preference for high-nutrition foods globally is expected to stimulate growth in the macroalgae industry.
Various species of macroalgae have a high relative abundance of long-chain polyunsaturated fatty acids (PUFA). These are essential components in human and animal nutrition.
The potential applications of macroalgae in pharmaceutical, food, nutraceutical, and cosmetics sectors due to their biologically active and regenerative properties will boost the market.
Growing usage of macroalgae in cosmetic and personal care products will elevate demand in the global market. Macroalgae contain minerals such as calcium, manganese, potassium, zinc, etc. It possesses anti-inflammatory, antioxidant, and detoxifying properties. As a result, it is being used in various cosmetics products.
Surging popularity of seaweed-based products among consumers is anticipated to create lucrative opportunities for macroalgae manufacturers.
Advancements in macroalgae production, extraction, and processing technologies will also support market growth.
Sales in the market are expected to increase as a result of the expanding use of macroalgae ingredients and proteins in the manufacture of food, nutraceutical, and pharmaceutical products.
Growing awareness about the environmental benefits of seaweed cultivation is also positively impacting market development.
Macroalgae cultivation in oceans can act as a form of carbon sequestration to mitigate climate change. This is prompting governments to introduce favorable initiatives and policies to encourage seaweed cultivation.
The market is also likely to grow as a result of the quick development of new strains that can handle high salinity and improve energy efficiency.
Extensive research is anticipated to be done by numerous renowned manufacturers to increase the protein bioavailability from whole macroalgae. It will be achieved through pre-treatments that prevent degradation by disrupting cell walls. In comparison to animal-based proteins, the development of macroalgae proteins requires less land.
Another key factor that will boost the market is the rising usage of macroalgae as a natural fertilizer in agriculture sector. The potential of seaweed as a source of renewable energy is also likely to create lucrative revenue-generation opportunities for macroalgae companies.
Attributes | Key Insights |
---|---|
Estimated Global Macroalgae Market Size (2023E) | USD 9,302.6 million |
Projected Global Macroalgae Market Value (2033F) | USD 18,305.1 million |
Value-based CAGR (2023 to 2033) | 7.8% |
Top 3 Countries’ Value | USD 4465.2 million |
Market Statistics | Details |
---|---|
Jan to Jun (H1), 2021 (A) | 5.6% |
Jul to Dec (H2), 2021 (A) | 6.2% |
Jan to Jun (H1), 2022 Projected (P) | 6.6% |
Jan to Jun (H1), 2022 Outlook (O) | 6.1% |
Jul to Dec (H2), 2022 Outlook (O) | 7.6% |
Jul to Dec (H2), 2022 Projected (P) | 7.4% |
Jan to Jun (H1), 2023 Projected (P) | 6.6% |
BPS Change: H1, 2022 (O) to H1, 2022 (P) | 42 |
BPS Change: H1, 2022 (O) to H1, 2021 (A) | 54 |
BPS Change: H2, 2022 (O) to H2, 2022 (P) | -27 |
BPS Change: H2, 2022 (O) to H2, 2022 (A) | 142 |
According to Future Market Insights (FMI), global sales of macroalgae grew at a CAGR of 7.0% from 2018 to 2022. For the next ten years, the worldwide market for macroalgae is forecast to expand at 7.8% CAGR.
Rising demand for macroalgae from industries such as food & beverage, pharmaceutical, and cosmetics is a prominent factor driving the market forward.
Macroalgae contain minerals such as manganese, potassium, calcium, phosphorus, zinc, and others. These minerals benefit both the skin and the hair in addition to the skin. Further, it possesses anti-inflammatory, antioxidant, and detoxifying properties.
Thanks to presence of these nutrients and various health benefits, macroalgae is being widely used across cosmetic and food industries.
North America, East Asia, and South Asia together hold a prominent share of the global macroalgae industry. This is due to rising usage of macroalgae across thriving food & beverage and pharmaceutical sectors.
Government initiatives and support are also significantly contributing to the expansion of the macroalgae market in these regions. Further, growing popularity of seaweed snacks and increasing investments in research and development will positively impact macroalgae sales.
Region | North America |
---|---|
Country | United States |
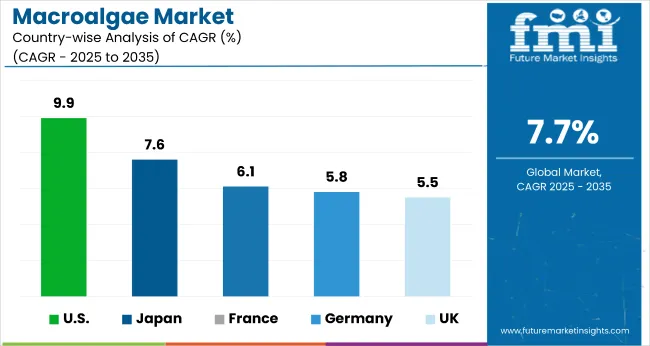
CAGR | 9.9% |
Market Value (2033) | USD 2,697.7 million |
Region | Europe |
---|---|
Country | United Kingdom |
CAGR | 5.5% |
Market Value (2033) | USD 930.2 million |
Region | Asia Pacific |
---|---|
Country | China |
CAGR | 9.5% |
Market Value (2033) | USD 2,325.6 million |
Region | Asia Pacific |
---|---|
Country | India |
CAGR | 10.8% |
Market Value (2033) | USD 269.7 million |
Region | Asia Pacific |
---|---|
Country | Japan |
CAGR | 7.6% |
Market Value (2033) | USD 296.7 million |
Rising Demand for Sustainable & Organic Food Options to Fuel Macroalgae Demand in China
As per Future Market Insights (FMI), macroalgae demand in China is projected to rise at a robust CAGR of 9.5% during the assessment period. By 2033, China macroalgae market is forecast to surpass a valuation of USD 2,325.6 million.
A wide variety of goods are produced and consumed in the diverse and expanding Chinese macroalgae industry. Macroalgae has been a staple of Chinese cuisine for thousands of years because it is a highly nutritive and adaptable food source.
As consumers seek out healthier and more sustainable food options, macroalgae is experiencing a surge in popularity in China. This in turn will elevate its demand in the market.
The online retail market is expanding quickly in China. Several new startups and established businesses are taking advantage of this trend to reach new customers and broaden their reach.
Online sales of macroalgae and macroalgae-based products have seen rapid growth in recent years. This will continue to boost China market during the assessment period.
Growing Popularity of Ethnic Cuisines Triggering Macroalgae Sales in Japan
According to Future Market Insights’ (FMI) analysis, Japan macroalgae industry is poised to exhibit a CAGR of 7.6% during the projection period. By 2033, total market valuation in China is likely to reach USD 296.7 million.
With a lengthy tradition of macroalgae cultivation and consumption, Japan is a significant player in the industry. Traditional Japanese dishes such as sushi, miso soup, and salads all contain macroalgae as a key ingredient.
Nori, wakame, kombu, and hijiki are a few common types of macroalgae used in Japanese cuisines. For instance, Nori is used for making sushi rolls while wakame finds application in miso soup. Rising usage of macroalgae in these cuisines will bolster sales of macroalgae in Japan through 2033.
Growing Awareness About Health Benefits of Macroalgae Boosting Korea Market
One of the world's top macroalgae consumers, South Korea has a large market for various macroalgae products including wakame and kelp. The nation's love of macroalgae can be attributed to its rich cultural and culinary history, where macroalgae has long been a key component of traditional dishes.
Due to rising health consciousness and awareness about numerous health benefits of macroalgae, Korea market is set to exhibit a healthy growth rate.
Seaweed snacks and condiments made with macroalgae, and even cosmetics containing macroalgae extracts are now available in South Korea. Rising popularity of these products will play a key role in fostering market development.
Thanks to the potential benefits of macroalgae farming, South Korean government is also offering support to macroalgae companies. This will positively impact the market.
High Nutritional Power of Red Macroalgae Making is Widely Popular Among Consumers
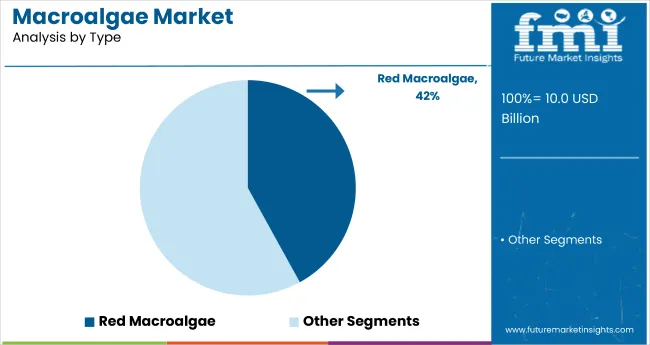
According to Future Market Insights (FMI), sales of red macroalgae are likely to outpace those of green macroalgae and brown macroalgae. This is due to high nutritional content and health benefits of red macroalgae
Red macroalgae such as dried macroalgae, dulse, and laver have high vitamin and mineral content as well as anti-inflammatory and antioxidant compounds. They are a good source of dietary fiber and protein.
Due to its useful qualities and adaptability, red macroalgae has a wide range of uses in the food, pharmaceutical, and cosmetic industries.
Red macroalgae is a well-liked ingredient because it has a unique flavor and texture. It is frequently used as a seasoning for soups and salads in the food industry, making it widely available and well-known to consumers.
Growth of the target segment will also be influenced by the rising popularity of sushi, which uses red macroalgae as its wrapping. These aspects, along with rising consumer awareness of red macroalgae’s health advantages will further boost the target segment.
Food & Beverage Likely to Remain Key Application of Macroalgae
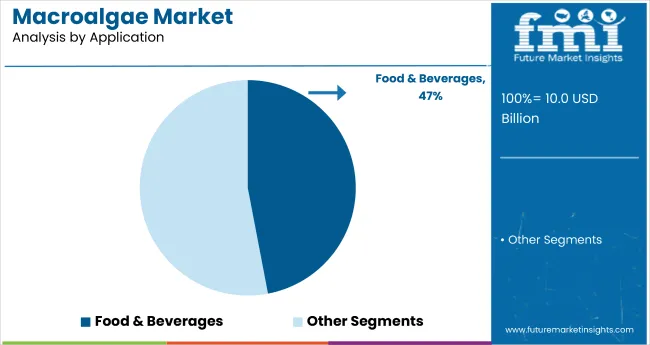
Based on application, food & beverage segment is expected to hold a prominent share of the global macroalgae industry during the projection period. This is due to rising usage of macroalgae in a wide range of food products.
Macroalgae is a versatile ingredient that can be easily incorporated into a variety of foods and beverages to add nutrition. It is gaining wider popularity among food manufacturers due to its various health benefits.
Rising demand for plant-based and sustainable food products is another key factor that will boost growth of the target segment.
Amid rising trend of veganism, demand for plant-based foods is surging. Food companies are catering to this demand by incorporating products such as macroalgae in their products. Macroalgae is now recognized as a superfood, which is contributing to its popularity in the food & beverage sector.
Macroalgae is a common ingredient in a variety of goods, including food, cosmetics, and animal feed. As a result, the macroalgae industry is receiving investments from numerous producers and new businesses.
While some companies concentrate on growing and processing macroalgae, others develop novel products that take advantage of its special qualities. This has caused a wide range of macroalgae-based products, from snacks to skincare items, to be released on the market.
To meet the increasing demand for plant-based substitutes, key manufacturers are also making investments in products based on macroalgae.
For instance,
Attribute | Details |
---|---|
Market Size Value in 2023 | USD 9,302.6 million |
Market Forecast Value in 2033 | USD 18,305.1 million |
Anticipated Growth Rate (2023 to 2033) | 7.8% CAGR |
Forecast Period | 2023 to 2033 |
Historical Data Available for | 2018 to 2022 |
Market Analysis | Volume (MT) and Value (USD Million) |
Key Regions Covered | Latin America; North America; Europe; South Asia; East Asia; Oceania; and Middle East & Africa |
Key Countries Covered | Canada, United States, Mexico, Brazil, Chile, Peru, Argentina, Germany, France, Italy, Spain, United Kingdom, Netherlands, Belgium, Nordic, Russia, Poland, China, Japan, South Korea, India, Thailand, Malaysia, Indonesia, Singapore, Australia, New Zealand, GCC Countries, South Africa, Central Africa, and others |
Key Market Segments Covered | Type, Application, and Region |
Key Companies Profiled | Cargill, Incorporated; Acadian Seaplants Limited; CP Kelco; Dow Chemical Company; E. I. du Pont de Nemours and Company; Gelymar SA; Irish Seaweeds; Marcel Trading Corporation; Qingdao Gather Great Ocean Algae Industry Group (GGOG); Seasol International Pty Ltd; Yan Cheng Hairui Food Co., Ltd.; Ocean Harvest Technology Limited; Mara Seaweed; Algatechnologies |
Table 1: Global Market Value (US$ million) Forecast by Region, 2018 to 2033
Table 2: Global Market Volume (MT) Forecast by Region, 2018 to 2033
Table 3: Global Market Value (US$ million) Forecast by Type, 2018 to 2033
Table 4: Global Market Volume (MT) Forecast by Type, 2018 to 2033
Table 5: Global Market Value (US$ million) Forecast by Application, 2018 to 2033
Table 6: Global Market Volume (MT) Forecast by Application, 2018 to 2033
Table 7: North America Market Value (US$ million) Forecast by Country, 2018 to 2033
Table 8: North America Market Volume (MT) Forecast by Country, 2018 to 2033
Table 9: North America Market Value (US$ million) Forecast by Type, 2018 to 2033
Table 10: North America Market Volume (MT) Forecast by Type, 2018 to 2033
Table 11: North America Market Value (US$ million) Forecast by Application, 2018 to 2033
Table 12: North America Market Volume (MT) Forecast by Application, 2018 to 2033
Table 13: Latin America Market Value (US$ million) Forecast by Country, 2018 to 2033
Table 14: Latin America Market Volume (MT) Forecast by Country, 2018 to 2033
Table 15: Latin America Market Value (US$ million) Forecast by Type, 2018 to 2033
Table 16: Latin America Market Volume (MT) Forecast by Type, 2018 to 2033
Table 17: Latin America Market Value (US$ million) Forecast by Application, 2018 to 2033
Table 18: Latin America Market Volume (MT) Forecast by Application, 2018 to 2033
Table 19: Europe Market Value (US$ million) Forecast by Country, 2018 to 2033
Table 20: Europe Market Volume (MT) Forecast by Country, 2018 to 2033
Table 21: Europe Market Value (US$ million) Forecast by Type, 2018 to 2033
Table 22: Europe Market Volume (MT) Forecast by Type, 2018 to 2033
Table 23: Europe Market Value (US$ million) Forecast by Application, 2018 to 2033
Table 24: Europe Market Volume (MT) Forecast by Application, 2018 to 2033
Table 25: East Asia Market Value (US$ million) Forecast by Country, 2018 to 2033
Table 26: East Asia Market Volume (MT) Forecast by Country, 2018 to 2033
Table 27: East Asia Market Value (US$ million) Forecast by Type, 2018 to 2033
Table 28: East Asia Market Volume (MT) Forecast by Type, 2018 to 2033
Table 29: East Asia Market Value (US$ million) Forecast by Application, 2018 to 2033
Table 30: East Asia Market Volume (MT) Forecast by Application, 2018 to 2033
Table 31: South Asia Market Value (US$ million) Forecast by Country, 2018 to 2033
Table 32: South Asia Market Volume (MT) Forecast by Country, 2018 to 2033
Table 33: South Asia Market Value (US$ million) Forecast by Type, 2018 to 2033
Table 34: South Asia Market Volume (MT) Forecast by Type, 2018 to 2033
Table 35: South Asia Market Value (US$ million) Forecast by Application, 2018 to 2033
Table 36: South Asia Market Volume (MT) Forecast by Application, 2018 to 2033
Table 37: Oceania Market Value (US$ million) Forecast by Country, 2018 to 2033
Table 38: Oceania Market Volume (MT) Forecast by Country, 2018 to 2033
Table 39: Oceania Market Value (US$ million) Forecast by Type, 2018 to 2033
Table 40: Oceania Market Volume (MT) Forecast by Type, 2018 to 2033
Table 41: Oceania Market Value (US$ million) Forecast by Application, 2018 to 2033
Table 42: Oceania Market Volume (MT) Forecast by Application, 2018 to 2033
Table 43: Middle East & Africa Market Value (US$ million) Forecast by Country, 2018 to 2033
Table 44: Middle East & Africa Market Volume (MT) Forecast by Country, 2018 to 2033
Table 45: Middle East & Africa Market Value (US$ million) Forecast by Type, 2018 to 2033
Table 46: Middle East & Africa Market Volume (MT) Forecast by Type, 2018 to 2033
Table 47: Middle East & Africa Market Value (US$ million) Forecast by Application, 2018 to 2033
Table 48: Middle East & Africa Market Volume (MT) Forecast by Application, 2018 to 2033
Figure 1: Global Market Value (US$ million) by Type, 2023 to 2033
Figure 2: Global Market Value (US$ million) by Application, 2023 to 2033
Figure 3: Global Market Value (US$ million) by Region, 2023 to 2033
Figure 4: Global Market Value (US$ million) Analysis by Region, 2018 to 2033
Figure 5: Global Market Volume (MT) Analysis by Region, 2018 to 2033
Figure 6: Global Market Value Share (%) and BPS Analysis by Region, 2023 to 2033
Figure 7: Global Market Y-o-Y Growth (%) Projections by Region, 2023 to 2033
Figure 8: Global Market Value (US$ million) Analysis by Type, 2018 to 2033
Figure 9: Global Market Volume (MT) Analysis by Type, 2018 to 2033
Figure 10: Global Market Value Share (%) and BPS Analysis by Type, 2023 to 2033
Figure 11: Global Market Y-o-Y Growth (%) Projections by Type, 2023 to 2033
Figure 12: Global Market Value (US$ million) Analysis by Application, 2018 to 2033
Figure 13: Global Market Volume (MT) Analysis by Application, 2018 to 2033
Figure 14: Global Market Value Share (%) and BPS Analysis by Application, 2023 to 2033
Figure 15: Global Market Y-o-Y Growth (%) Projections by Application, 2023 to 2033
Figure 16: Global Market Attractiveness by Type, 2023 to 2033
Figure 17: Global Market Attractiveness by Application, 2023 to 2033
Figure 18: Global Market Attractiveness by Region, 2023 to 2033
Figure 19: North America Market Value (US$ million) by Type, 2023 to 2033
Figure 20: North America Market Value (US$ million) by Application, 2023 to 2033
Figure 21: North America Market Value (US$ million) by Country, 2023 to 2033
Figure 22: North America Market Value (US$ million) Analysis by Country, 2018 to 2033
Figure 23: North America Market Volume (MT) Analysis by Country, 2018 to 2033
Figure 24: North America Market Value Share (%) and BPS Analysis by Country, 2023 to 2033
Figure 25: North America Market Y-o-Y Growth (%) Projections by Country, 2023 to 2033
Figure 26: North America Market Value (US$ million) Analysis by Type, 2018 to 2033
Figure 27: North America Market Volume (MT) Analysis by Type, 2018 to 2033
Figure 28: North America Market Value Share (%) and BPS Analysis by Type, 2023 to 2033
Figure 29: North America Market Y-o-Y Growth (%) Projections by Type, 2023 to 2033
Figure 30: North America Market Value (US$ million) Analysis by Application, 2018 to 2033
Figure 31: North America Market Volume (MT) Analysis by Application, 2018 to 2033
Figure 32: North America Market Value Share (%) and BPS Analysis by Application, 2023 to 2033
Figure 33: North America Market Y-o-Y Growth (%) Projections by Application, 2023 to 2033
Figure 34: North America Market Attractiveness by Type, 2023 to 2033
Figure 35: North America Market Attractiveness by Application, 2023 to 2033
Figure 36: North America Market Attractiveness by Country, 2023 to 2033
Figure 37: Latin America Market Value (US$ million) by Type, 2023 to 2033
Figure 38: Latin America Market Value (US$ million) by Application, 2023 to 2033
Figure 39: Latin America Market Value (US$ million) by Country, 2023 to 2033
Figure 40: Latin America Market Value (US$ million) Analysis by Country, 2018 to 2033
Figure 41: Latin America Market Volume (MT) Analysis by Country, 2018 to 2033
Figure 42: Latin America Market Value Share (%) and BPS Analysis by Country, 2023 to 2033
Figure 43: Latin America Market Y-o-Y Growth (%) Projections by Country, 2023 to 2033
Figure 44: Latin America Market Value (US$ million) Analysis by Type, 2018 to 2033
Figure 45: Latin America Market Volume (MT) Analysis by Type, 2018 to 2033
Figure 46: Latin America Market Value Share (%) and BPS Analysis by Type, 2023 to 2033
Figure 47: Latin America Market Y-o-Y Growth (%) Projections by Type, 2023 to 2033
Figure 48: Latin America Market Value (US$ million) Analysis by Application, 2018 to 2033
Figure 49: Latin America Market Volume (MT) Analysis by Application, 2018 to 2033
Figure 50: Latin America Market Value Share (%) and BPS Analysis by Application, 2023 to 2033
Figure 51: Latin America Market Y-o-Y Growth (%) Projections by Application, 2023 to 2033
Figure 52: Latin America Market Attractiveness by Type, 2023 to 2033
Figure 53: Latin America Market Attractiveness by Application, 2023 to 2033
Figure 54: Latin America Market Attractiveness by Country, 2023 to 2033
Figure 55: Europe Market Value (US$ million) by Type, 2023 to 2033
Figure 56: Europe Market Value (US$ million) by Application, 2023 to 2033
Figure 57: Europe Market Value (US$ million) by Country, 2023 to 2033
Figure 58: Europe Market Value (US$ million) Analysis by Country, 2018 to 2033
Figure 59: Europe Market Volume (MT) Analysis by Country, 2018 to 2033
Figure 60: Europe Market Value Share (%) and BPS Analysis by Country, 2023 to 2033
Figure 61: Europe Market Y-o-Y Growth (%) Projections by Country, 2023 to 2033
Figure 62: Europe Market Value (US$ million) Analysis by Type, 2018 to 2033
Figure 63: Europe Market Volume (MT) Analysis by Type, 2018 to 2033
Figure 64: Europe Market Value Share (%) and BPS Analysis by Type, 2023 to 2033
Figure 65: Europe Market Y-o-Y Growth (%) Projections by Type, 2023 to 2033
Figure 66: Europe Market Value (US$ million) Analysis by Application, 2018 to 2033
Figure 67: Europe Market Volume (MT) Analysis by Application, 2018 to 2033
Figure 68: Europe Market Value Share (%) and BPS Analysis by Application, 2023 to 2033
Figure 69: Europe Market Y-o-Y Growth (%) Projections by Application, 2023 to 2033
Figure 70: Europe Market Attractiveness by Type, 2023 to 2033
Figure 71: Europe Market Attractiveness by Application, 2023 to 2033
Figure 72: Europe Market Attractiveness by Country, 2023 to 2033
Figure 73: East Asia Market Value (US$ million) by Type, 2023 to 2033
Figure 74: East Asia Market Value (US$ million) by Application, 2023 to 2033
Figure 75: East Asia Market Value (US$ million) by Country, 2023 to 2033
Figure 76: East Asia Market Value (US$ million) Analysis by Country, 2018 to 2033
Figure 77: East Asia Market Volume (MT) Analysis by Country, 2018 to 2033
Figure 78: East Asia Market Value Share (%) and BPS Analysis by Country, 2023 to 2033
Figure 79: East Asia Market Y-o-Y Growth (%) Projections by Country, 2023 to 2033
Figure 80: East Asia Market Value (US$ million) Analysis by Type, 2018 to 2033
Figure 81: East Asia Market Volume (MT) Analysis by Type, 2018 to 2033
Figure 82: East Asia Market Value Share (%) and BPS Analysis by Type, 2023 to 2033
Figure 83: East Asia Market Y-o-Y Growth (%) Projections by Type, 2023 to 2033
Figure 84: East Asia Market Value (US$ million) Analysis by Application, 2018 to 2033
Figure 85: East Asia Market Volume (MT) Analysis by Application, 2018 to 2033
Figure 86: East Asia Market Value Share (%) and BPS Analysis by Application, 2023 to 2033
Figure 87: East Asia Market Y-o-Y Growth (%) Projections by Application, 2023 to 2033
Figure 88: East Asia Market Attractiveness by Type, 2023 to 2033
Figure 89: East Asia Market Attractiveness by Application, 2023 to 2033
Figure 90: East Asia Market Attractiveness by Country, 2023 to 2033
Figure 91: South Asia Market Value (US$ million) by Type, 2023 to 2033
Figure 92: South Asia Market Value (US$ million) by Application, 2023 to 2033
Figure 93: South Asia Market Value (US$ million) by Country, 2023 to 2033
Figure 94: South Asia Market Value (US$ million) Analysis by Country, 2018 to 2033
Figure 95: South Asia Market Volume (MT) Analysis by Country, 2018 to 2033
Figure 96: South Asia Market Value Share (%) and BPS Analysis by Country, 2023 to 2033
Figure 97: South Asia Market Y-o-Y Growth (%) Projections by Country, 2023 to 2033
Figure 98: South Asia Market Value (US$ million) Analysis by Type, 2018 to 2033
Figure 99: South Asia Market Volume (MT) Analysis by Type, 2018 to 2033
Figure 100: South Asia Market Value Share (%) and BPS Analysis by Type, 2023 to 2033
Figure 101: South Asia Market Y-o-Y Growth (%) Projections by Type, 2023 to 2033
Figure 102: South Asia Market Value (US$ million) Analysis by Application, 2018 to 2033
Figure 103: South Asia Market Volume (MT) Analysis by Application, 2018 to 2033
Figure 104: South Asia Market Value Share (%) and BPS Analysis by Application, 2023 to 2033
Figure 105: South Asia Market Y-o-Y Growth (%) Projections by Application, 2023 to 2033
Figure 106: South Asia Market Attractiveness by Type, 2023 to 2033
Figure 107: South Asia Market Attractiveness by Application, 2023 to 2033
Figure 108: South Asia Market Attractiveness by Country, 2023 to 2033
Figure 109: Oceania Market Value (US$ million) by Type, 2023 to 2033
Figure 110: Oceania Market Value (US$ million) by Application, 2023 to 2033
Figure 111: Oceania Market Value (US$ million) by Country, 2023 to 2033
Figure 112: Oceania Market Value (US$ million) Analysis by Country, 2018 to 2033
Figure 113: Oceania Market Volume (MT) Analysis by Country, 2018 to 2033
Figure 114: Oceania Market Value Share (%) and BPS Analysis by Country, 2023 to 2033
Figure 115: Oceania Market Y-o-Y Growth (%) Projections by Country, 2023 to 2033
Figure 116: Oceania Market Value (US$ million) Analysis by Type, 2018 to 2033
Figure 117: Oceania Market Volume (MT) Analysis by Type, 2018 to 2033
Figure 118: Oceania Market Value Share (%) and BPS Analysis by Type, 2023 to 2033
Figure 119: Oceania Market Y-o-Y Growth (%) Projections by Type, 2023 to 2033
Figure 120: Oceania Market Value (US$ million) Analysis by Application, 2018 to 2033
Figure 121: Oceania Market Volume (MT) Analysis by Application, 2018 to 2033
Figure 122: Oceania Market Value Share (%) and BPS Analysis by Application, 2023 to 2033
Figure 123: Oceania Market Y-o-Y Growth (%) Projections by Application, 2023 to 2033
Figure 124: Oceania Market Attractiveness by Type, 2023 to 2033
Figure 125: Oceania Market Attractiveness by Application, 2023 to 2033
Figure 126: Oceania Market Attractiveness by Country, 2023 to 2033
Figure 127: Middle East & Africa Market Value (US$ million) by Type, 2023 to 2033
Figure 128: Middle East & Africa Market Value (US$ million) by Application, 2023 to 2033
Figure 129: Middle East & Africa Market Value (US$ million) by Country, 2023 to 2033
Figure 130: Middle East & Africa Market Value (US$ million) Analysis by Country, 2018 to 2033
Figure 131: Middle East & Africa Market Volume (MT) Analysis by Country, 2018 to 2033
Figure 132: Middle East & Africa Market Value Share (%) and BPS Analysis by Country, 2023 to 2033
Figure 133: Middle East & Africa Market Y-o-Y Growth (%) Projections by Country, 2023 to 2033
Figure 134: Middle East & Africa Market Value (US$ million) Analysis by Type, 2018 to 2033
Figure 135: Middle East & Africa Market Volume (MT) Analysis by Type, 2018 to 2033
Figure 136: Middle East & Africa Market Value Share (%) and BPS Analysis by Type, 2023 to 2033
Figure 137: Middle East & Africa Market Y-o-Y Growth (%) Projections by Type, 2023 to 2033
Figure 138: Middle East & Africa Market Value (US$ million) Analysis by Application, 2018 to 2033
Figure 139: Middle East & Africa Market Volume (MT) Analysis by Application, 2018 to 2033
Figure 140: Middle East & Africa Market Value Share (%) and BPS Analysis by Application, 2023 to 2033
Figure 141: Middle East & Africa Market Y-o-Y Growth (%) Projections by Application, 2023 to 2033
Figure 142: Middle East & Africa Market Attractiveness by Type, 2023 to 2033
Figure 143: Middle East & Africa Market Attractiveness by Application, 2023 to 2033
Figure 144: Middle East & Africa Market Attractiveness by Country, 2023 to 2033
The market is estimated to reach USD 18,305.12 by 2033.
North America is anticipated to progress at a CAGR of 9.9%.
India, Japan, and China dominate the Asian market.
Japan's macroalgae industry is poised to exhibit a CAGR of 7.6% from 2023 to 2033.
By 2033, China's macroalgae market is forecast to surpass a valuation of USD 2,325.6 million.
Thank you!
You will receive an email from our Business Development Manager. Please be sure to check your SPAM/JUNK folder too.