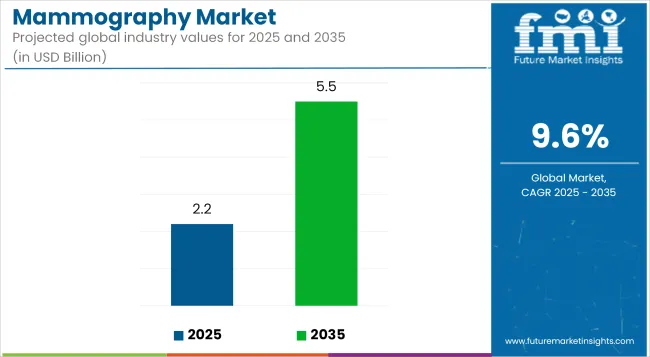
The global Mammography Market is estimated to be valued at USD 2.2 billion in 2025 and is projected to reach USD 5.5 billion by 2035, registering a compound annual growth rate of 9.6% over the forecast period.
| Metric | Value |
|---|---|
| Market Size (2025E) | USD 2.2 billion |
| Market Value (2035F) | USD 5.5 billion |
| CAGR (2025 to 2035) | 9.6% |
The global mammography market is experiencing significant growth, propelled by the increasing prevalence of breast cancer and heightened awareness of early detection's importance. Advancements in imaging technologies, such as digital mammography, 3D breast tomosynthesis, and contrast-enhanced mammography, have enhanced diagnostic accuracy and patient outcomes.
Government initiatives and public health campaigns are further encouraging regular screenings, contributing to market expansion. Additionally, the integration of artificial intelligence (AI) in mammography is streamlining workflows and improving diagnostic precision, making screenings more accessible and efficient.
The market's growth is also supported by the development of mobile mammography units, which extend services to underserved areas, and favorable reimbursement policies that reduce financial barriers for patients. Overall, the mammography market is poised for continued growth, driven by technological innovations, supportive policies, and a global emphasis on early breast cancer detection.
The dominance of full field digital mammography equipment, accounting for 46.8% of the mammography market revenue in 2025, has been attributed to the significant shift from analog to digital infrastructure across healthcare facilities. Greater diagnostic accuracy, improved image clarity, and reduced examination time have been prioritized by radiologists and healthcare providers, driving the adoption of digital platforms.
Furthermore, integration capabilities with Picture Archiving and Communication Systems (PACS) have enabled seamless data management, contributing to clinical workflow optimization. Supportive reimbursement frameworks in developed markets and reduced total cost of ownership over time have strengthened hospital budgets in favor of digital equipment. The increased focus on early detection and preventive screening programs by public health agencies has further reinforced investment in digital systems.
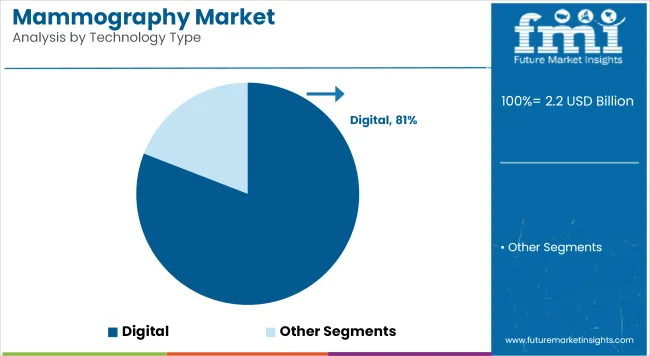
Digital mammography, commanding an 80.9% revenue share in 2025, has been preferred for its enhanced sensitivity and diagnostic yield compared to analog and film-based technologies. Market penetration has been accelerated through national breast screening programs that mandate the use of digital equipment for consistent and scalable diagnostics.
Real-time image visualization, lower radiation exposure, and superior data storage capacity have made digital mammography the modality of choice for high-volume screening centers. Strategic funding by governmental and private healthcare institutions has ensured rapid technology replacement cycles in favor of digital platforms. Furthermore, collaborations between OEMs and public health bodies have facilitated the deployment of mobile digital mammography units, expanding access in rural populations.
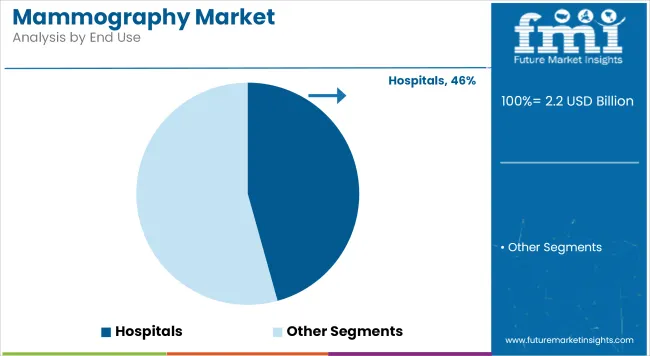
Hospitals are estimated to contribute 45.68% to the global mammography market revenue in 2025, largely due to their integrated diagnostic and treatment capabilities. The presence of advanced infrastructure, multidisciplinary care teams, and round-the-clock access to imaging specialists has made hospitals the preferred destination for breast cancer screening and diagnostics.
Mammography procedures in hospitals are often bundled with additional services such as biopsies, pathology reviews, and oncology consultations, allowing for a comprehensive care pathway. Investments in state-of-the-art imaging suites have been supported through capital funding initiatives and public-private partnerships, further strengthening the diagnostic armamentarium of tertiary hospitals.
High Equipment and Maintenance Costs
Mammography is an expensive business because the starting costs of purchasing and maintaining equipment are exorbitant. Initial costs for both digital and 3D mammography systems deter small-scale diagnostic centres from making these available. Most small diagnostic centres operate in low- and middle-income economies.
This equipment requires trained personnel who have the capability of interpreting images correctly and operating the system efficiently, thereby making operations costlier to manage. The main result of all these factors is limited adoption of mammography systems in countries with low economic viability.
Technological Advancements and AI Integration
Integration of cutting-edge imaging technologies into artificial intelligence, for instance, is expected to create tremendous space for the mammography systems market. It enables diagnostic accuracy and correction of false positives and false negatives while supporting radiologists across the areas of early cancer assessment by connecting portable and mobile mammography units to far-off regions and rural populations, enhancing the screening services that travel much farther afield. Thus, innovations are destined to realize improvements in detection efficiency globally and stimulate growth in the overall market.
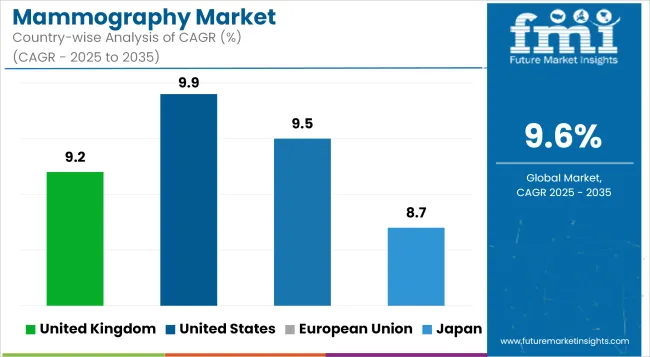
With the growing campaign for early detection of breast cancer among the population and rigorous government programs such as the National Breast and Cervical Cancer Early Detection Program (NBCCEDP), the mammography market in the United States witnesses rapid growth. The country benefits from widespread screening programs and fast adoption master-level advanced imaging technologies with comprehensive reimbursement regimes.
| Country | CAGR (2025 to 2035) |
|---|---|
| United States | 9.9% |
The growth of the mammography market in the UK is being driven by government-endorsed screening programs and greater awareness towards breast health. The National Health Service (NHS) provides an organized breast screening service that enhances early diagnostic efforts and continuity of monitoring.
Improvements in imaging systems coupled with training for radiologists have helped grow the diagnostic power in the country considerably. Increasing breast cancer cases, public awareness, and advanced innovations in 3D imaging continue to spur phenomenal market growth.
| Country | CAGR (2025 to 2035) |
|---|---|
| United Kingdom | 9.2% |
Mammography in the European Union is spawning consistent growth due to synergistic policies on cancer screening and the usage of digital imaging technologies. Germany, France, and Italy lead in deploying high-resolution 2D and 3D mammography units.
The European Commission is promoting breast cancer screening, and regulatory incentives further facilitate the modernization of equipment. Inter-country collaborative clinical research and AI integration are being promoted for enhancing diagnostic accuracy and encouraging early intervention strategies.
| Country | CAGR (2025 to 2035) |
|---|---|
| European Union | 9.5% |
Mammography in Japan is getting better almost to the end-of-the-era government emphasis on early discovery and public awareness about the diseases. The Ministry of Health, Labour, and Welfare is often seen conducting screening campaigns and supporting mobile mammography services, especially in the countryside.
An increase in the elderly population and incidence of breast cancer in the country has created a higher demand for advanced diagnostic systems. Small, compact devices are getting domestic manufacturers and global leaders pushing development. These devices are AI-embedded models aimed at both urban clinics and regional hospitals.
| Country | CAGR (2025 to 2035) |
|---|---|
| Japan | 8.7% |
The mammography market in South Korea is growing very rapidly due to the increased awareness of breast cancers and the improvement of the health systems in the country. Health insurance has made regular screenings easy as they are now covered under national health insurance schemes.
Health promotion policies are for early detection from the government. Emerging Next-Gen mammography technologies are being adopted using some very strong digital health capabilities and a highly advanced medical device manufacturing ecosystem. The rising appeal of low-radiation diagnostics is rapidly increasing market momentum.
| Country | CAGR (2025 to 2035) |
|---|---|
| South Korea | 9.5% |
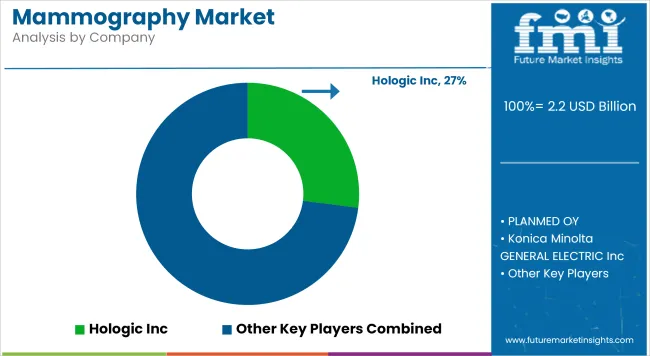
The mammography market is witnessing intense competition, driven by continuous innovation, rapid product launches, and strategic collaborations among imaging technology providers. Significant focus is being placed on the development of AI-integrated diagnostic platforms, portable mammography units, and 3D tomosynthesis systems to enhance detection accuracy and expand accessibility.
Companies are actively investing in R&D and expanding manufacturing capabilities to cater to the growing demand for advanced breast screening solutions. Additionally, partnerships with hospitals, diagnostic chains, and public health agencies are being leveraged to deploy digital solutions at scale, especially in underserved regions.
Competitive pricing strategies, along with after-sales service enhancements, are further shaping vendor differentiation. Regulatory approvals and global certification standards are also being prioritized to accelerate international market penetration.
Key Development
The overall market size for the mammography market was USD 2.2 billion in 2025.
The market is expected to reach USD 5.5 billion in 2035.
Demand will be driven by increasing breast cancer prevalence, advancements in imaging technology, rising awareness about early detection, and growing healthcare infrastructure.
The top 5 contributing countries are USA, UK, Europe, Japan, and South Korea.
The Breast Tomosynthesis segment is expected to lead the market due to its enhanced imaging capabilities and widespread adoption.


Our Research Products

The "Full Research Suite" delivers actionable market intel, deep dives on markets or technologies, so clients act faster, cut risk, and unlock growth.

The Leaderboard benchmarks and ranks top vendors, classifying them as Established Leaders, Leading Challengers, or Disruptors & Challengers.

Locates where complements amplify value and substitutes erode it, forecasting net impact by horizon

We deliver granular, decision-grade intel: market sizing, 5-year forecasts, pricing, adoption, usage, revenue, and operational KPIs—plus competitor tracking, regulation, and value chains—across 60 countries broadly.

Spot the shifts before they hit your P&L. We track inflection points, adoption curves, pricing moves, and ecosystem plays to show where demand is heading, why it is changing, and what to do next across high-growth markets and disruptive tech

Real-time reads of user behavior. We track shifting priorities, perceptions of today’s and next-gen services, and provider experience, then pace how fast tech moves from trial to adoption, blending buyer, consumer, and channel inputs with social signals (#WhySwitch, #UX).

Partner with our analyst team to build a custom report designed around your business priorities. From analysing market trends to assessing competitors or crafting bespoke datasets, we tailor insights to your needs.
Supplier Intelligence
Discovery & Profiling
Capacity & Footprint
Performance & Risk
Compliance & Governance
Commercial Readiness
Who Supplies Whom
Scorecards & Shortlists
Playbooks & Docs
Category Intelligence
Definition & Scope
Demand & Use Cases
Cost Drivers
Market Structure
Supply Chain Map
Trade & Policy
Operating Norms
Deliverables
Buyer Intelligence
Account Basics
Spend & Scope
Procurement Model
Vendor Requirements
Terms & Policies
Entry Strategy
Pain Points & Triggers
Outputs
Pricing Analysis
Benchmarks
Trends
Should-Cost
Indexation
Landed Cost
Commercial Terms
Deliverables
Brand Analysis
Positioning & Value Prop
Share & Presence
Customer Evidence
Go-to-Market
Digital & Reputation
Compliance & Trust
KPIs & Gaps
Outputs
Full Research Suite comprises of:
Market outlook & trends analysis
Interviews & case studies
Strategic recommendations
Vendor profiles & capabilities analysis
5-year forecasts
8 regions and 60+ country-level data splits
Market segment data splits
12 months of continuous data updates
DELIVERED AS:
PDF EXCEL ONLINE
AI enhanced Mammography Screening Market Size and Share Forecast Outlook 2025 to 2035

Thank you!
You will receive an email from our Business Development Manager. Please be sure to check your SPAM/JUNK folder too.
Chat With
MaRIA