Metagenomics Market Outlook 2025 to 2035

The period extending from 2025 to 2035 is likely to be marked by strong growth in the metagenomics market, driven by advances in next-generation sequencing (NGS), increasing interest in microbiome applications, and expanding spheres of application in clinical diagnostics, environmental biology, and agriculture.

Metagenomics is the direct study of the genetic material from a microbial community in its natural environment, allowing for the study of unculturable microbes and giving insight into complex ecosystems.

The market is further supported by increasing R&D investment in infectious disease surveillance, antimicrobial resistance (AMR) profiling, and personalized nutrition. The growing availability of bioinformatics tools, reduced sequencing costs, and integration with AI and machine learning are enhancing the accessibility and scalability of metagenomic workflows.

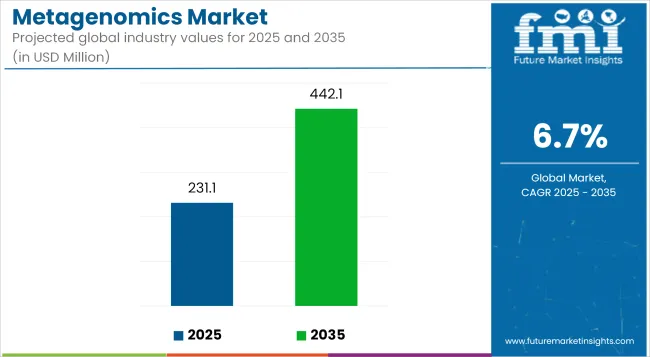
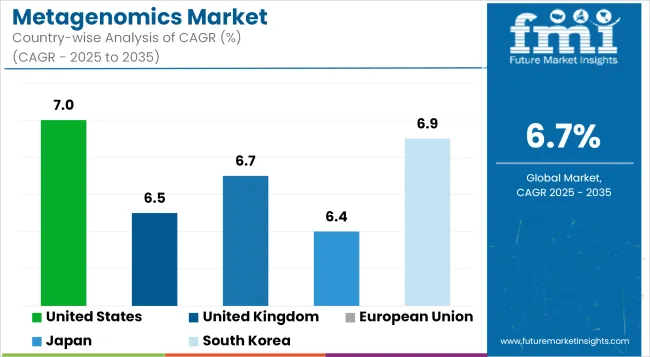
The metagenomics market is projected to grow at a CAGR of 6.7%, increasing from USD 231.1 million in 2025 to approximately USD 442.07 million by 2035.

Key Market Metrics

Metric Value
Market Size in 2025 USD 231.1 Million
Projected Market Size in 2035 USD 442.07 Million
CAGR (2025 to 2035) 6.7%

Regional Market Trends

North America

The North American region occupies the largest proportion of the metagenomics markets on a regional level, particularly due to having major research infrastructures and genomic infrastructures, as well as applications in human microbiome project work, disease diagnoses, and drug discovery.

Many leading academic centers and biotechnology companies in the United States have forged ahead in the field of metagenomic sequencing bioinformatics. According to the WHO, the emerging scope of metagenomics in North America is related to antimicrobial resistance and public health surveillance.

Europe

The market in Europe depends much on public funding for microbiome research, precision medicine projects, and environmental programs. Countries such as Germany, the UK, and the Netherlands have started the integration of metagenomics into agriculture, wastewater monitoring, and food safety. WHO reports that European investments into microbial ecosystem analysis and zoonotic disease monitoring using metagenomic tools are accelerated by the focus on "One Health" strategies.

Asia-Pacific

Those with the fastest growth are Asia-Pacific, with such growth being driven by the areas of interest in microbiome health interventions in connection with genomics research-and increasingly accepted in sequencing technologies for agriculture and public health.

This region is mainly represented by China, Japan, South Korea, and India. United Nations reports have predicted investments in genomics and bioinformatics by the Asia-Pacific region would overwhelm the global average until 2035; thus, it is anticipated that the area would be a focal point in clinical and environmental metagenomics.

Challenges and Opportunities

Challenges

Data interpretation complexity, standardization gaps, and high infrastructure costs

The inherent complexity of metagenomics data and the requisite advanced computational tools and trained personnel have remained the bigger challenges. The entire range, from sampling to methodology, sequencing protocol, and data interpretation framework, is yet to be standardized across laboratories and contexts of research.

Installation of high-throughput sequencing and computing resources is still devastatingly unaffordable, even for the low and middle-income settings. The World Health Organization calls for the equitable development of global health equity standards for genomic surveillance metagenomics tools.

Opportunities

Personalized microbiome-based medicine, AMR monitoring, and environmental diagnostics

There are emerging opportunities in the personalized health segments such as microbiome-based diagnostics, products development, and therapeutic response prediction. In clinical microbiology, metagenomic sequencing is almost single-handedly revolutionizing the diagnostics for those rare and polymicrobial infections that can simply not be cultured.

The environmental potential areas like soil health monitoring, water quality assessment, and remediation are rapidly on the rise. WHO indicates that providing metagenomics data into the functioning surveillance system of public health and environment could significantly boost the preparedness of the whole world against pandemics and threats related to climate change.
Shifts in the Market from 2020 to 2024 and Future Trends 2025 to 2035

From 2020 to 2024, the COVID-19 pandemic contributed to the acceleration of genomic research and to the showcasing of the metagenomic potential in pathogen, wastewater, and AMR surveillance. Governmental and philanthropic investments in sequencing infrastructure have mushroomed around the world.

The market between 2025 and 2035 is expected to make the shift toward real-time metagenomic analysis, cloud data integration, and AI-enabled diagnosis. Portable sequencers, microbiome-aware clinical decision support systems, and synthetic biology that may emanate from metagenomic insights are going to characterize the next phase of innovation.

Market Shifts: A Comparative Analysis 2020 to 2024 vs. 2025 to 2035

Market Shift 2020 to 2024 Trends
Regulatory Landscape Pilot integration into AMR and outbreak surveillance
Consumer Trends Focus on microbiome kits and gut health awareness
Industry Adoption Academic research and pilot clinical use
Supply Chain and Sourcing Centralized NGS service providers
Market Competition Dominated by sequencing equipment and reagent manufacturers
Market Growth Drivers Human microbiome projects, COVID-19, and NGS adoption
Sustainability and Impact High resource use in sequencing workflows
Smart Technology Integration Batch sequencing and manual annotation
Sensorial Innovation N/A
Market Shift 2025 to 2035 Projections
Regulatory Landscape Global standardization of metagenomic diagnostics and data sharing
Consumer Trends Rise in precision microbiome therapies and data-backed health decisions
Industry Adoption Expansion into diagnostics, nutrition, agriculture, and wastewater management
Supply Chain and Sourcing Growth of local sequencing hubs and decentralized bioinformatics platforms
Market Competition Entry of AI-driven diagnostics, cloud analytics, and microbiome biotech firms
Market Growth Drivers One Health surveillance, global food security, and synthetic biology
Sustainability and Impact Eco-efficient lab operations and green bioinformatics infrastructure
Smart Technology Integration Real-time microbiome mapping, AI-based taxonomy, and predictive metagenomics
Sensorial Innovation Field-deployable, sensor-enabled sampling kits for environmental microbiomes

Country-Wise Outlook

United States

The metagenomics market in the USA shows an unwavering growth attributable to the advancement in next-generation sequencing (NGS), microbiome study, and infectious disease surveillance. Institutions and biotechnologies are employing metagenomics for applications in drug discovery, environmental monitoring, and precision medicine.

As per OECD, there are federal efforts in support of microbiome and pathology innovation under NIH Human Microbiome Program and grants from DARPA and BARDA. The growing application of metagenomics in agriculture and food safety in terms of microbial diversity assessment can further stimulate growth in this area.

Country CAGR (2025 to 2035)
United States 7.0%

United Kingdom

Much of the advancement of the metagenomics market in the UK takes place on the back of microbial genomic research, AMR (antimicrobial resistance) surveillance, and personalized health, strongly supported by academia and the government.

As per OECD, the United Kingdom is the global leader in genomic medicine, and organizations such as Wellcome Sanger Institute use metagenomics to study gut flora, environmental biodiversity, and zoonotic transmission. NHS-supported genomic projects and public health microbiology programs also expand demand for metagenomic sequencing in clinical and environmental settings.

Country CAGR (2025 to 2035)
United Kingdom 6.5%

European Union

The EU market for metagenomics is gaining traction through investments in food safety, environmental microbiome research, and translational medicine. Germany, France, and the Netherlands are applying metagenomics to monitor wastewater, soil biodiversity, and chronic disease studies.

According to UN data, programs such as Horizon Europe and One Health fund applications of metagenomics in agriculture, human health, and antimicrobial stewardship. EU laboratories are also adopting portable NGS platforms and cloud analysis tools to improve response to microbial surveillance and outbreak.

Country CAGR (2025 to 2035)
European Union 6.7%

Japan

Like any other country, Japan's metagenomics market is maturing steadily, thanks to the applications enhanced by probiotic development, gastrointestinal health, and even fermentation studies. However, the focus of the country towards healthy aging and traditional studies on their diet has motivated the public to be inspired by the gut microbiota profiling and functional genomics.

According to the OECD, investments of the Japanese government and universities are at work with microbial biotechnology platforms, thereby widening the scope of metagenomic studies in basic and clinical research. The food industry is also the largest user of metagenomic tools and applications in the metagenomics arena by ensuring food safety and quality.

Country CAGR (2025 to 2035)
Japan 6.4%

South Korea

The South Korea metagenomics market has been expanded at a fast pace with applications increasingly being applied towards health, agriculture, and bioenvironmental research. National investments towards developing genomic medicine and bioinformatics platforms integrated with AI, as per OECD data, are speeding up the country's lead in precision health.

Research institutes in Korea use metagenomic sequencing to study a number of dimensions including surveillance of hospital-acquired infections, antibiotic resistance genes, and the environmental microbial ecosystem. These are joint public-private partnerships between university and biotech startups for developing innovative microbiome-based diagnostics and therapeutics.

Country CAGR (2025 to 2035)
South Korea 6.9%

Segmentation Outlook - Metagenomics Market

Library preparation kits and pharmaceutical & biotechnology company adoption drive global growth through streamlined sequencing workflows, accelerated drug discovery, and integration into advanced microbiome research initiatives

The metagenomics market has been experiencing steady growth as the researchers and clinicians have now started utilizing various advanced genomic tools to investigate complex microbial communities. Library preparation kits are renowned for preparing DNA samples for sequencing, giving high-quality data output.

Within the product type and end-use application categories, library preparation kits and pharmaceutical and biotechnology companies dominate the global market share with their efficiency, reproducibility, and application in state-of-the-art research and development activities.

These two segments, in particular, support microbial analysis fully, assist in the search of new drugs, and promote development in personalized medicine.With an increased focus on microbial profiling in varied sectors, library preparation kits for pharmaceutical and biotechnology companies remain in the forefront of driving innovations and solving complex biological problems.

Library preparation kits dominate product use due to standardized protocols, high-throughput capabilities, and compatibility with diverse sequencing platforms

Product Type Market Share (2025)
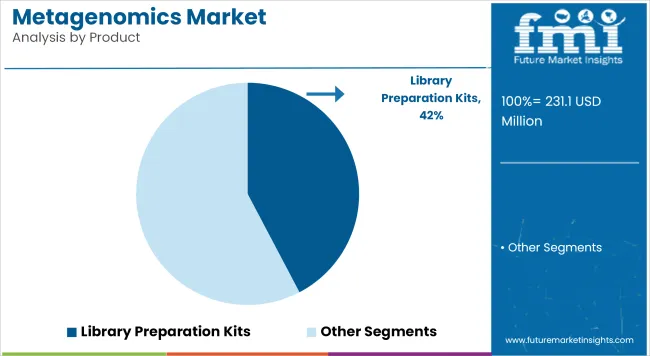
Library Preparation Kits 68.5%

Library preparation kits lead the metagenomics market from a standpoint on the basis of a streamlined workflow that converts raw DNA samples into sequencing-ready libraries. They assure standardized protocols for consistency and completion and play a huge role in minimizing sample preparation time while also minimizing errors. As a result, these kits have become an indispensable tool in high-throughput sequencing by now.

The dominance of library preparation kits can be attributed to their outstanding diversity of sample types, compatibility with multiple sequencing or sequencing technologies, and ability to perform with high-quality data all important for the direct and independent interpretation of microbial analysis. Their wide adoption serves as sufficient testament to their importance for metagenomic studies of efficiency and reliability.

Pharmaceutical & biotechnology companies dominate end user adoption due to intensive R&D activities, focus on novel therapeutics, and integration of metagenomic insights into drug development pipelines

End User Market Share (2025)
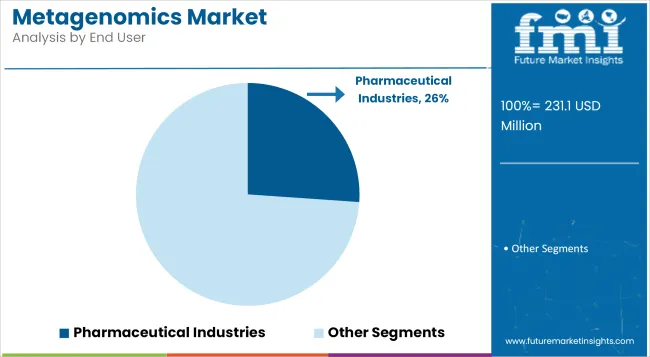
Pharmaceutical & Biotechnology Companies 66.2%

Pharmaceutical and biotechnology companies are the largest end-user segments for the metagenomics market, driven by their efforts in new drug and therapy development, and enhancement and advancement of diagnostic tools. The incorporation of metagenomics has aided in speeding up discovering and optimizing biologically active compounds in research and development efforts.

Such preferences are further supported by the much investment by these companies in cutting-edge technology, necessitating holistic microbial insights to cater to extensive researches. The demand for innovative solutions to healthcare needs has kept pharmaceutical and biotechnology companies among the cutting-edge users of metagenomics for the benefit of medical science.

Competitive Outlook

Rapid expansion in the metagenomics market is driven by the increasing efficiency of research and clinical scientists in high-throughput sequencing for understanding complex microbial communities-humans gut soils oceans and industrial bioreactors. Metagenomics accomplishes the unculturable analysis of microbial DNA, revealing new species, antimicrobial resistance genes, and metabolic pathways due to the use of these high-throughput tools.

Demand is thus attributed to the expanding applications of precision medicine, environmental monitoring, agricultural microbiome management, and diagnostics for infectious diseases. Advances in next-generation sequencing (NGS), bioinformatics pipelines, and sample preparation workflows will result in greater accessibility of metagenomic tools in prospects of global markets. WHO estimates that metagenomic surveillance is a very important area for influencing early detection for emerging pathogens as well as antibiotic resistance in public health systems.

Market Share Analysis by Key Players & Metagenomics Solution Providers

Company Name Estimated Market Share (%)
Illumina, Inc. 14-17%
Thermo Fisher Scientific 11-14%
Qiagen N.V. 9-12%
Oxford Nanopore Technologies 7-10%
BGI Genomics Co., Ltd. 6-9%
Other Providers 38-45%

Key Company & Metagenomics Market Solutions

Company Name Key Offerings/Activities
Illumina, Inc. In 2024, introduced enhanced NovaSeq kits optimized for low-biomass environmental samples in 2025, launched microbiome-specific sequencing panels with preconfigured bioinformatics.
Thermo Fisher Scientific In 2024, expanded Ion Torrent workflows for clinical pathogen metagenomics in 2025, developed One Health metagenomics bundles for zoonotic disease monitoring.
Qiagen N.V. In 2024, released QIAseq 16S/ITS kits for targeted amplicon-based profiling in 2025, added integrated microbiome data portals for translational research applications.
Oxford Nanopore Technologies In 2024, launched long-read adaptive sampling tools for real-time microbial genome assembly in 2025, enabled rapid AMR gene detection in hospital wastewater surveillance.
BGI Genomics Co., Ltd. In 2024, introduced cost-optimized metagenomic sequencing services for agri-biotech and soil microbiome research in 2025, deployed multi-sample pathogen detection pipelines in Southeast Asia.

Key Market Insights

Illumina, Inc. (14-17%)

Illumina leads in NGS systems and library prep tools for both shotgun and amplicon-based metagenomic studies. Its solutions support human microbiome analysis, environmental biodiversity research, and infectious disease diagnostics at global scale.According to WHO, widespread genomic surveillance using metagenomics supports antimicrobial resistance tracking and outbreak preparedness.

Thermo Fisher Scientific (11-14%)

Thermo Fisher offers integrated sample-to-answer solutions for metagenomic sequencing using Ion Torrent technology. Its applications span foodborne pathogen surveillance, zoonotic disease tracking, and microbial diversity studies.According to UN, expanding microbial diagnostics through metagenomics helps address global food safety, One Health, and biosurveillance initiatives.

Qiagen N.V. (9-12%)

Qiagen provides sample prep, DNA stabilization, and 16S/ITS sequencing tools for microbiome and metagenome profiling. It also supports downstream analytics through QIAGEN CLC Genomics Workbench and microbiome portals.According to OECD, effective bioinformatics integration is essential for interpreting complex metagenomic datasets in health and environmental contexts.

Oxford Nanopore Technologies (7-10%)

Oxford Nanopore enables long-read sequencing of entire microbial genomes directly from environmental or clinical samples. Its real-time sequencing workflows allow in-field detection of novel pathogens and resistance markers.According to WHO, real-time metagenomics supports faster outbreak containment and on-site microbial risk assessment.

BGI Genomics Co., Ltd. (6-9%)

BGI offers scalable metagenomic services with competitive pricing for academic, agricultural, and public health use. It operates internationally with partnerships in food safety, aquaculture, and environmental remediation.According to World Bank Report, low-cost metagenomic platforms increase access to genomic surveillance tools in emerging markets.

Other Key Players (38-45% Combined)

Numerous companies and institutions contribute to this evolving field with specialized kits, software, and services. These include:

  • Zymo Research Corp.-DNA extraction and microbial profiling kits for soil and fecal samples.
  • BaseClear B.V.-Metagenomic contract research services for biotech and pharma firms.
  • CosmosID-Cloud-based microbiome and resistome analytics for clinical research.
  • SeqBiome-Sequencing and bioinformatics services for precision microbiome applications.
  • DNAnexus-Scalable cloud platform for metagenomics data management and analysis.

Key Segmentation

By Product Type:

  • Library Preparation Kits
  • Sample Extraction Kits
  • Metagenomic Sequencing Kits

By Application:

  • Microbial Diversity
  • Bioremediation and Degradation
  • Bio Surfactants and Antibiotics Production
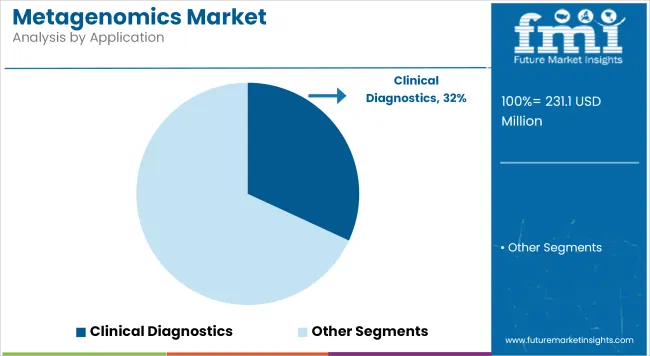
  • Clinical Diagnostics
  • Others

By End User:

  • Pharmaceutical Industries
  • Research Laboratories
  • Biotechnology Companies
  • Pathology Laboratories
  • Academic and Research Institutes

By Region:

  • North America
  • Latin America
  • Europe
  • Japan
  • Asia Pacific
  • The Middle East and Africa

Table of Content

  1. Executive Summary
  2. Industry Introduction, including Taxonomy and Market Definition
  3. Market Trends and Success Factors, including Macro-economic Factors, Market Dynamics, and Recent Industry Developments
  4. Market Demand Analysis 2020 to 2024 and Forecast 2025 to 2035, including Historical Analysis and Future Projections
  5. Pricing Analysis
  6. Market Analysis 2020 to 2024 and Forecast 2025 to 2035
    • Product Type
    • Application
    • End User
  7. Market Analysis 2020 to 2024 and Forecast 2025 to 2035, By Product Type
    • Library Preparation Kits
    • Sample Extraction Kits
    • Metagenomic Sequencing Kits
  8. Market Analysis 2020 to 2024 and Forecast 2025 to 2035, By Application
    • Microbial Diversity
    • Bioremediation and Degradation
    • Bio Surfactants and Antibiotics Production
    • Clinical Diagnostics
    • Others
  9. Market Analysis 2020 to 2024 and Forecast 2025 to 2035, By End User
    • Pharmaceutical Industries
    • Research Laboratories
    • Biotechnology Companies
    • Pathology Laboratories
    • Academic and Research Institutes
  10. Market Analysis 2020 to 2024 and Forecast 2025 to 2035, By Region
    • North America
    • Latin America
    • Western Europe
    • Eastern Europe
    • East Asia
    • South Asia Pacific
    • Middle East and Africa
  11. North America Sales Analysis 2020 to 2024 and Forecast 2025 to 2035, by Key Segments and Countries
  12. Latin America Sales Analysis 2020 to 2024 and Forecast 2025 to 2035, by Key Segments and Countries
  13. Western Europe Sales Analysis 2020 to 2024 and Forecast 2025 to 2035, by Key Segments and Countries
  14. Eastern Europe Sales Analysis 2020 to 2024 and Forecast 2025 to 2035, by Key Segments and Countries
  15. East Asia Sales Analysis 2020 to 2024 and Forecast 2025 to 2035, by Key Segments and Countries
  16. South Asia Pacific Sales Analysis 2020 to 2024 and Forecast 2025 to 2035, by Key Segments and Countries
  17. Middle East and Africa Sales Analysis 2020 to 2024 and Forecast 2025 to 2035, by Key Segments and Countries
  18. Sales Forecast 2025 to 2035 by Product Type, Application, and End User for 30 Countries
  19. Competition Outlook, including Market Structure Analysis, Company Share Analysis by Key Players, and Competition Dashboard
  20. Company Profile
    • Illumina Inc
    • Perkin Elmer Inc.
    • Trivitron Healthcare Pvt. Ltd.
    • Qiagen N.V.
    • Thermo Fisher Scientific
    • Symbio Scientific Pvt. Ltd.
    • Infobio
    • Bio-Rad Laboratories
    • Merck KgaA
    • Promega Corporation

List of Tables

Table 1: Global Market Value (US$ million) Forecast by Region, 2017 to 2033

Table 2: Global Market Value (US$ million) Forecast by Product Type, 2017 to 2033

Table 3: Global Market Value (US$ million) Forecast by Application, 2017 to 2033

Table 4: Global Market Value (US$ million) Forecast by End User, 2017 to 2033

Table 5: North America Market Value (US$ million) Forecast by Country, 2017 to 2033

Table 6: North America Market Value (US$ million) Forecast by Product Type, 2017 to 2033

Table 7: North America Market Value (US$ million) Forecast by Application, 2017 to 2033

Table 8: North America Market Value (US$ million) Forecast by End User, 2017 to 2033

Table 9: Latin America Market Value (US$ million) Forecast by Country, 2017 to 2033

Table 10: Latin America Market Value (US$ million) Forecast by Product Type, 2017 to 2033

Table 11: Latin America Market Value (US$ million) Forecast by Application, 2017 to 2033

Table 12: Latin America Market Value (US$ million) Forecast by End User, 2017 to 2033

Table 13: Europe Market Value (US$ million) Forecast by Country, 2017 to 2033

Table 14: Europe Market Value (US$ million) Forecast by Product Type, 2017 to 2033

Table 15: Europe Market Value (US$ million) Forecast by Application, 2017 to 2033

Table 16: Europe Market Value (US$ million) Forecast by End User, 2017 to 2033

Table 17: CIS & Russia Market Value (US$ million) Forecast by Country, 2017 to 2033

Table 18: CIS & Russia Market Value (US$ million) Forecast by Product Type, 2017 to 2033

Table 19: CIS & Russia Market Value (US$ million) Forecast by Application, 2017 to 2033

Table 20: CIS & Russia Market Value (US$ million) Forecast by End User, 2017 to 2033

Table 21: APEJ Market Value (US$ million) Forecast by Country, 2017 to 2033

Table 22: APEJ Market Value (US$ million) Forecast by Product Type, 2017 to 2033

Table 23: APEJ Market Value (US$ million) Forecast by Application, 2017 to 2033

Table 24: APEJ Market Value (US$ million) Forecast by End User, 2017 to 2033

Table 25: Japan Market Value (US$ million) Forecast by Country, 2017 to 2033

Table 26: Japan Market Value (US$ million) Forecast by Product Type, 2017 to 2033

Table 27: Japan Market Value (US$ million) Forecast by Application, 2017 to 2033

Table 28: Japan Market Value (US$ million) Forecast by End User, 2017 to 2033

Table 29: MEA Market Value (US$ million) Forecast by Country, 2017 to 2033

Table 30: MEA Market Value (US$ million) Forecast by Product Type, 2017 to 2033

Table 31: MEA Market Value (US$ million) Forecast by Application, 2017 to 2033

Table 32: MEA Market Value (US$ million) Forecast by End User, 2017 to 2033

List of Figures

Figure 1: Global Market Value (US$ million) by Product Type, 2023 to 2033

Figure 2: Global Market Value (US$ million) by Application, 2023 to 2033

Figure 3: Global Market Value (US$ million) by End User, 2023 to 2033

Figure 4: Global Market Value (US$ million) by Region, 2023 to 2033

Figure 5: Global Market Value (US$ million) Analysis by Region, 2017 to 2033

Figure 6: Global Market Value Share (%) and BPS Analysis by Region, 2023 to 2033

Figure 7: Global Market Y-o-Y Growth (%) Projections by Region, 2023 to 2033

Figure 8: Global Market Value (US$ million) Analysis by Product Type, 2017 to 2033

Figure 9: Global Market Value Share (%) and BPS Analysis by Product Type, 2023 to 2033

Figure 10: Global Market Y-o-Y Growth (%) Projections by Product Type, 2023 to 2033

Figure 11: Global Market Value (US$ million) Analysis by Application, 2017 to 2033

Figure 12: Global Market Value Share (%) and BPS Analysis by Application, 2023 to 2033

Figure 13: Global Market Y-o-Y Growth (%) Projections by Application, 2023 to 2033

Figure 14: Global Market Value (US$ million) Analysis by End User, 2017 to 2033

Figure 15: Global Market Value Share (%) and BPS Analysis by End User, 2023 to 2033

Figure 16: Global Market Y-o-Y Growth (%) Projections by End User, 2023 to 2033

Figure 17: Global Market Attractiveness by Product Type, 2023 to 2033

Figure 18: Global Market Attractiveness by Application, 2023 to 2033

Figure 19: Global Market Attractiveness by End User, 2023 to 2033

Figure 20: Global Market Attractiveness by Region, 2023 to 2033

Figure 21: North America Market Value (US$ million) by Product Type, 2023 to 2033

Figure 22: North America Market Value (US$ million) by Application, 2023 to 2033

Figure 23: North America Market Value (US$ million) by End User, 2023 to 2033

Figure 24: North America Market Value (US$ million) by Country, 2023 to 2033

Figure 25: North America Market Value (US$ million) Analysis by Country, 2017 to 2033

Figure 26: North America Market Value Share (%) and BPS Analysis by Country, 2023 to 2033

Figure 27: North America Market Y-o-Y Growth (%) Projections by Country, 2023 to 2033

Figure 28: North America Market Value (US$ million) Analysis by Product Type, 2017 to 2033

Figure 29: North America Market Value Share (%) and BPS Analysis by Product Type, 2023 to 2033

Figure 30: North America Market Y-o-Y Growth (%) Projections by Product Type, 2023 to 2033

Figure 31: North America Market Value (US$ million) Analysis by Application, 2017 to 2033

Figure 32: North America Market Value Share (%) and BPS Analysis by Application, 2023 to 2033

Figure 33: North America Market Y-o-Y Growth (%) Projections by Application, 2023 to 2033

Figure 34: North America Market Value (US$ million) Analysis by End User, 2017 to 2033

Figure 35: North America Market Value Share (%) and BPS Analysis by End User, 2023 to 2033

Figure 36: North America Market Y-o-Y Growth (%) Projections by End User, 2023 to 2033

Figure 37: North America Market Attractiveness by Product Type, 2023 to 2033

Figure 38: North America Market Attractiveness by Application, 2023 to 2033

Figure 39: North America Market Attractiveness by End User, 2023 to 2033

Figure 40: North America Market Attractiveness by Country, 2023 to 2033

Figure 41: Latin America Market Value (US$ million) by Product Type, 2023 to 2033

Figure 42: Latin America Market Value (US$ million) by Application, 2023 to 2033

Figure 43: Latin America Market Value (US$ million) by End User, 2023 to 2033

Figure 44: Latin America Market Value (US$ million) by Country, 2023 to 2033

Figure 45: Latin America Market Value (US$ million) Analysis by Country, 2017 to 2033

Figure 46: Latin America Market Value Share (%) and BPS Analysis by Country, 2023 to 2033

Figure 47: Latin America Market Y-o-Y Growth (%) Projections by Country, 2023 to 2033

Figure 48: Latin America Market Value (US$ million) Analysis by Product Type, 2017 to 2033

Figure 49: Latin America Market Value Share (%) and BPS Analysis by Product Type, 2023 to 2033

Figure 50: Latin America Market Y-o-Y Growth (%) Projections by Product Type, 2023 to 2033

Figure 51: Latin America Market Value (US$ million) Analysis by Application, 2017 to 2033

Figure 52: Latin America Market Value Share (%) and BPS Analysis by Application, 2023 to 2033

Figure 53: Latin America Market Y-o-Y Growth (%) Projections by Application, 2023 to 2033

Figure 54: Latin America Market Value (US$ million) Analysis by End User, 2017 to 2033

Figure 55: Latin America Market Value Share (%) and BPS Analysis by End User, 2023 to 2033

Figure 56: Latin America Market Y-o-Y Growth (%) Projections by End User, 2023 to 2033

Figure 57: Latin America Market Attractiveness by Product Type, 2023 to 2033

Figure 58: Latin America Market Attractiveness by Application, 2023 to 2033

Figure 59: Latin America Market Attractiveness by End User, 2023 to 2033

Figure 60: Latin America Market Attractiveness by Country, 2023 to 2033

Figure 61: Europe Market Value (US$ million) by Product Type, 2023 to 2033

Figure 62: Europe Market Value (US$ million) by Application, 2023 to 2033

Figure 63: Europe Market Value (US$ million) by End User, 2023 to 2033

Figure 64: Europe Market Value (US$ million) by Country, 2023 to 2033

Figure 65: Europe Market Value (US$ million) Analysis by Country, 2017 to 2033

Figure 66: Europe Market Value Share (%) and BPS Analysis by Country, 2023 to 2033

Figure 67: Europe Market Y-o-Y Growth (%) Projections by Country, 2023 to 2033

Figure 68: Europe Market Value (US$ million) Analysis by Product Type, 2017 to 2033

Figure 69: Europe Market Value Share (%) and BPS Analysis by Product Type, 2023 to 2033

Figure 70: Europe Market Y-o-Y Growth (%) Projections by Product Type, 2023 to 2033

Figure 71: Europe Market Value (US$ million) Analysis by Application, 2017 to 2033

Figure 72: Europe Market Value Share (%) and BPS Analysis by Application, 2023 to 2033

Figure 73: Europe Market Y-o-Y Growth (%) Projections by Application, 2023 to 2033

Figure 74: Europe Market Value (US$ million) Analysis by End User, 2017 to 2033

Figure 75: Europe Market Value Share (%) and BPS Analysis by End User, 2023 to 2033

Figure 76: Europe Market Y-o-Y Growth (%) Projections by End User, 2023 to 2033

Figure 77: Europe Market Attractiveness by Product Type, 2023 to 2033

Figure 78: Europe Market Attractiveness by Application, 2023 to 2033

Figure 79: Europe Market Attractiveness by End User, 2023 to 2033

Figure 80: Europe Market Attractiveness by Country, 2023 to 2033

Figure 81: CIS & Russia Market Value (US$ million) by Product Type, 2023 to 2033

Figure 82: CIS & Russia Market Value (US$ million) by Application, 2023 to 2033

Figure 83: CIS & Russia Market Value (US$ million) by End User, 2023 to 2033

Figure 84: CIS & Russia Market Value (US$ million) by Country, 2023 to 2033

Figure 85: CIS & Russia Market Value (US$ million) Analysis by Country, 2017 to 2033

Figure 86: CIS & Russia Market Value Share (%) and BPS Analysis by Country, 2023 to 2033

Figure 87: CIS & Russia Market Y-o-Y Growth (%) Projections by Country, 2023 to 2033

Figure 88: CIS & Russia Market Value (US$ million) Analysis by Product Type, 2017 to 2033

Figure 89: CIS & Russia Market Value Share (%) and BPS Analysis by Product Type, 2023 to 2033

Figure 90: CIS & Russia Market Y-o-Y Growth (%) Projections by Product Type, 2023 to 2033

Figure 91: CIS & Russia Market Value (US$ million) Analysis by Application, 2017 to 2033

Figure 92: CIS & Russia Market Value Share (%) and BPS Analysis by Application, 2023 to 2033

Figure 93: CIS & Russia Market Y-o-Y Growth (%) Projections by Application, 2023 to 2033

Figure 94: CIS & Russia Market Value (US$ million) Analysis by End User, 2017 to 2033

Figure 95: CIS & Russia Market Value Share (%) and BPS Analysis by End User, 2023 to 2033

Figure 96: CIS & Russia Market Y-o-Y Growth (%) Projections by End User, 2023 to 2033

Figure 97: CIS & Russia Market Attractiveness by Product Type, 2023 to 2033

Figure 98: CIS & Russia Market Attractiveness by Application, 2023 to 2033

Figure 99: CIS & Russia Market Attractiveness by End User, 2023 to 2033

Figure 100: CIS & Russia Market Attractiveness by Country, 2023 to 2033

Figure 101: APEJ Market Value (US$ million) by Product Type, 2023 to 2033

Figure 102: APEJ Market Value (US$ million) by Application, 2023 to 2033

Figure 103: APEJ Market Value (US$ million) by End User, 2023 to 2033

Figure 104: APEJ Market Value (US$ million) by Country, 2023 to 2033

Figure 105: APEJ Market Value (US$ million) Analysis by Country, 2017 to 2033

Figure 106: APEJ Market Value Share (%) and BPS Analysis by Country, 2023 to 2033

Figure 107: APEJ Market Y-o-Y Growth (%) Projections by Country, 2023 to 2033

Figure 108: APEJ Market Value (US$ million) Analysis by Product Type, 2017 to 2033

Figure 109: APEJ Market Value Share (%) and BPS Analysis by Product Type, 2023 to 2033

Figure 110: APEJ Market Y-o-Y Growth (%) Projections by Product Type, 2023 to 2033

Figure 111: APEJ Market Value (US$ million) Analysis by Application, 2017 to 2033

Figure 112: APEJ Market Value Share (%) and BPS Analysis by Application, 2023 to 2033

Figure 113: APEJ Market Y-o-Y Growth (%) Projections by Application, 2023 to 2033

Figure 114: APEJ Market Value (US$ million) Analysis by End User, 2017 to 2033

Figure 115: APEJ Market Value Share (%) and BPS Analysis by End User, 2023 to 2033

Figure 116: APEJ Market Y-o-Y Growth (%) Projections by End User, 2023 to 2033

Figure 117: APEJ Market Attractiveness by Product Type, 2023 to 2033

Figure 118: APEJ Market Attractiveness by Application, 2023 to 2033

Figure 119: APEJ Market Attractiveness by End User, 2023 to 2033

Figure 120: APEJ Market Attractiveness by Country, 2023 to 2033

Figure 121: Japan Market Value (US$ million) by Product Type, 2023 to 2033

Figure 122: Japan Market Value (US$ million) by Application, 2023 to 2033

Figure 123: Japan Market Value (US$ million) by End User, 2023 to 2033

Figure 124: Japan Market Value (US$ million) by Country, 2023 to 2033

Figure 125: Japan Market Value (US$ million) Analysis by Country, 2017 to 2033

Figure 126: Japan Market Value Share (%) and BPS Analysis by Country, 2023 to 2033

Figure 127: Japan Market Y-o-Y Growth (%) Projections by Country, 2023 to 2033

Figure 128: Japan Market Value (US$ million) Analysis by Product Type, 2017 to 2033

Figure 129: Japan Market Value Share (%) and BPS Analysis by Product Type, 2023 to 2033

Figure 130: Japan Market Y-o-Y Growth (%) Projections by Product Type, 2023 to 2033

Figure 131: Japan Market Value (US$ million) Analysis by Application, 2017 to 2033

Figure 132: Japan Market Value Share (%) and BPS Analysis by Application, 2023 to 2033

Figure 133: Japan Market Y-o-Y Growth (%) Projections by Application, 2023 to 2033

Figure 134: Japan Market Value (US$ million) Analysis by End User, 2017 to 2033

Figure 135: Japan Market Value Share (%) and BPS Analysis by End User, 2023 to 2033

Figure 136: Japan Market Y-o-Y Growth (%) Projections by End User, 2023 to 2033

Figure 137: Japan Market Attractiveness by Product Type, 2023 to 2033

Figure 138: Japan Market Attractiveness by Application, 2023 to 2033

Figure 139: Japan Market Attractiveness by End User, 2023 to 2033

Figure 140: Japan Market Attractiveness by Country, 2023 to 2033

Figure 141: MEA Market Value (US$ million) by Product Type, 2023 to 2033

Figure 142: MEA Market Value (US$ million) by Application, 2023 to 2033

Figure 143: MEA Market Value (US$ million) by End User, 2023 to 2033

Figure 144: MEA Market Value (US$ million) by Country, 2023 to 2033

Figure 145: MEA Market Value (US$ million) Analysis by Country, 2017 to 2033

Figure 146: MEA Market Value Share (%) and BPS Analysis by Country, 2023 to 2033

Figure 147: MEA Market Y-o-Y Growth (%) Projections by Country, 2023 to 2033

Figure 148: MEA Market Value (US$ million) Analysis by Product Type, 2017 to 2033

Figure 149: MEA Market Value Share (%) and BPS Analysis by Product Type, 2023 to 2033

Figure 150: MEA Market Y-o-Y Growth (%) Projections by Product Type, 2023 to 2033

Figure 151: MEA Market Value (US$ million) Analysis by Application, 2017 to 2033

Figure 152: MEA Market Value Share (%) and BPS Analysis by Application, 2023 to 2033

Figure 153: MEA Market Y-o-Y Growth (%) Projections by Application, 2023 to 2033

Figure 154: MEA Market Value (US$ million) Analysis by End User, 2017 to 2033

Figure 155: MEA Market Value Share (%) and BPS Analysis by End User, 2023 to 2033

Figure 156: MEA Market Y-o-Y Growth (%) Projections by End User, 2023 to 2033

Figure 157: MEA Market Attractiveness by Product Type, 2023 to 2033

Figure 158: MEA Market Attractiveness by Application, 2023 to 2033

Figure 159: MEA Market Attractiveness by End User, 2023 to 2033

Figure 160: MEA Market Attractiveness by Country, 2023 to 2033

Frequently Asked Questions

What was the overall size of the metagenomics market in 2025?

The overall market size for the metagenomics market was approximately USD 231.1 million in 2025.

How big is the metagenomics market expected to be in 2035?

The metagenomics market is expected to reach approximately USD 442.07 million by 2035.

What will drive the demand for the metagenomics market during the forecast period?

The demand for metagenomics is rising due to its ability to study every type of microorganism, regardless of whether it can be cultured or not.

List the top 5 countries contributing to the metagenomics market.

The top 5 countries driving the development of the metagenomics market are the United States, China, Germany, Japan, and the United Kingdom.

Which segment in the product type and end-user is expected to lead in the metagenomics market?

Library preparation kits and pharmaceutical & biotechnology company adoption are expected to command significant shares over the assessment period.

Future Market Insights

Metagenomics Market