Reports
- Global Locations -
Headquarters
Future Market Insights, Inc.
Christiana Corporate, 200
Continental Drive, Suite 401,
Newark, Delaware - 19713,
United States
Americas
Future Market Insights, Inc.
616 Corporate Way, Suite 2-9018,
Valley Cottage, NY 10989, United States
MEA
Future Market Insights
1602-6 Jumeirah Bay X2 Tower, Plot No: JLT-PH2-X2A,
Jumeirah Lakes Towers, Dubai,
United Arab Emirates
Europe
Future Market Insights
3rd Floor, 207 Regent Street,
W1B 3HH London
United Kingdom
Asia Pacific
Future Market Insights
Office No. 401-A, 4th Floor,
VANTAGE 9, S.No. 36/1/1,
Baner, Pune 411045, India
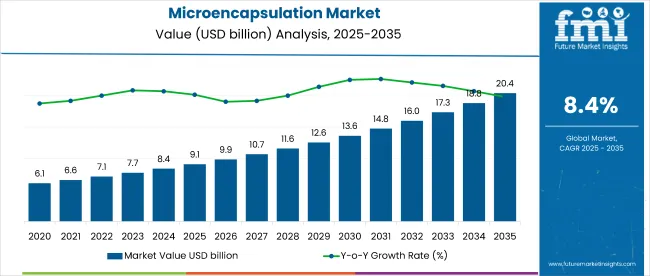
[250 Pages Report] The global microencapsulation market is estimated to be valued at US$ 6.5 Bn in 2022 and is projected to reach US$ 10.3 Bn by 2032, at a CAGR of 8.2% from 2022 to 2032.
Attribute | Details |
---|---|
Microencapsulation Market Size Value in 2022 | US$ 6.5 Billion |
Microencapsulation Market Forecast Value in 2032 | US$10.3 Billion |
Global Microencapsulation Market Growth Rate (2022 to 2032) | 8.2% CAGR |
Forecast Period | 2022 to 2032 |
Growth in the global microencapsulation market will be underpinned by the increasing demand for functional foods. North America remains in the driver’s seat in the global microencapsulation market; Asia Pacific (APAC) offers lucrative growth prospects. India and China are expected to report high demand for microencapsulation products in Asia Pacific.
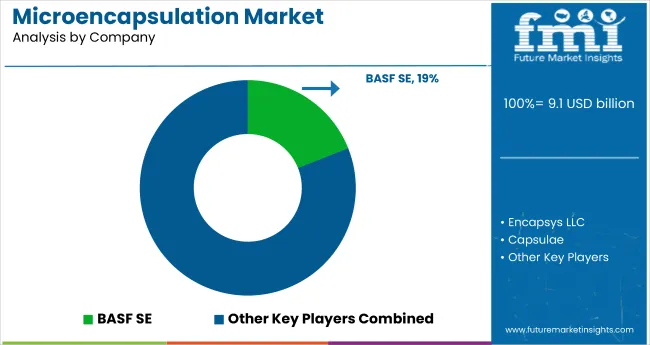
Furthermore, Reed Pacific, Encapsys, GAT Microencapsulation, Ronald T. Dodge Company, Capsule, and AVEKA are identified as the top players in the microencapsulation market.
In 2021, the U.S. microencapsulation market grew by 8.6% year-on-year, bucking initial skepticism about how the market would perform during a global pandemic.
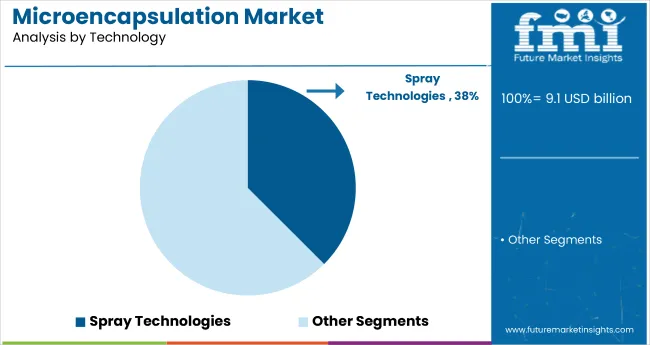
On the basis of technology, the microencapsulation market is divided into four categories: spray technology, dripping technology, emulsion technology, and other technologies (coating, physicochemical, and chemical technologies).
Don't pay for what you don't need
Customize your report by selecting specific countries or regions and save 30%!
Market Statistics | Details |
---|---|
H1,2021 (A) | 8.1% |
H1,2022 Projected (P) | 8.2% |
H1,2022 Outlook (O) | 9.0% |
BPS Change : H1,2022 (O) - H1,2022 (P) | (+) 82 ↑ |
BPS Change : H1,2022 (O) - H1,2021 (A) | (+) 90.2 ↑ |
FMI provides an evaluation and comparison of the market growth rates and future development possibilities on a half-yearly basis for the global market. Under the subjective influence of macro and industry factors, some demographic and innovation factors have a significant influence on the market.
There have been a number of recent changes in this market, including:
In the first half of 2021, the global market for Microencapsulation grew by 8.1 percent. Though not equally distributed throughout all regions, this growth is stronger in developing markets, where it reached 9 %. Thus, during H1 2022, there will be a 90.2 BPS point difference between predicted and projected growth.
The primary causes of this variation in growth rate are ascribed to the market's slow or rapid uptake during the first half of the projected period as a result of improving end-user demand in important economies and their expanding populations.
China and India in particular are both experiencing a growth in their consumption patterns, which is driving up demand for the Microencapsulation market. Numerous other market segments should also perform well and have bright development potential in the second half of the projected period.
Despite these promising developments, the business is still expected to face significant obstacles, such as shifting customer preferences, strict trade restrictions, and a lack of security in the supply of raw materials and other manufacturing inputs.
With the rise in demand for functional-fortified foods and pharmaceuticals, microencapsulation products is becoming more popular. Microencapsulation allows flavors, vitamins, minerals, essential oils, and other additives to be integrated into food products to improve their functional characteristics. Microencapsulation technologies have a significant impact on the pharmaceutical industry due to the advantages gained by producers. Active substances such as biomolecules, proteins, and genetic molecules are encapsulated in the pharmaceutical sector to address market demand for value-added products, in addition to pharmaceuticals.
Microencapsulation technologies expansion is predicted to be fuelled by its increasing use in a variety of end-user sectors. Encapsulation is required for medical foods, nutraceuticals, and meal-replacement products since features such as durability, bioavailability, distribution, and efficacy are all strictly monitored. This is estimated to favor the overall microencapsulation ingredients market.
Encapsulation is an innovative procedure that prominent companies across the globe are concentrating on, because they see it as an immunity protection process. Microencapsulation technology industry is widely used to produce and sell their products over the world. Active compounds that influence microencapsulation biomolecules growth are the key force driving the market. Textile will be another successful industry in the microencapsulation ingredient market in the future.
Market expansion is projected to be aided by rising demand for cosmo-textile manufacturing technologies. Changing lifestyles, combined with rising consumer spending power, are projected to drive demand for personal care products, which could bode well for the microencapsulation industry.
Moisture, acids, constituent interactions, high temperature, and oxygen exposure are all protected by microencapsulation products. They can also be programmed to release the nutrient at specific times, such as at a certain temperature or in the stomach for digestion. It also aids customer acceptance by reducing the disagreeable tastes and aromas associated with specific nutrients. These benefits are projected to boost acceptance, propelling the microencapsulation industry forward.
Market growth is likely to be aided by the increased need for technology to make beauty supplements using natural ingredients. In addition, as people become more aware of the health benefits of n-3 fatty acids, the demand for microencapsulation biomolecules for masking applications is projected to rise.
The requirement for extensive research in order to select the most appropriate method and core materials for the operation is a major restraint for the microencapsulation market's expansion throughout the forecast period. Before selecting the encapsulating material and technology required to surround the core material, significant new material development, and other experimentation are required. Continuous research and development cost a lot of money, but it eventually boosts the entire worth of the microencapsulation business.
North America accounted for 33% of total microencapsulation revenue share in the global microencapsulation market in 2021, on account of surging demand for pharmaceutical-grade food and beverages products. With the presence of large number of big pharmaceutical companies on the U.S. soil, innovations in the textile sector to include technology for improved product quality and strength are predicted to complement the market expansion during the forecast period.
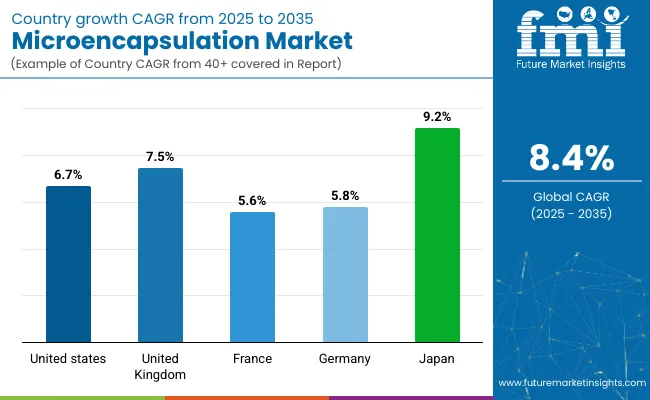
Driven by the early acceptance of the microencapsulation technologies in end-use applications, the sales of microencapsulation in the U.K. market is predicted to rise at a CAGR of 5.9% from 2022 to 2028. The presence of large pharmaceutical companies in the region, such as GlaxoSmithKline, Novartis, and others, has influenced market demand by focusing on the development of innovative drug delivery methods.
Favorable government policies towards FDI in the pharmaceutical business across China have played and will continue to play a critical role in promoting the Asia Pacific healthcare industry.
India Favors to Become One of the Biggest Opportunity Market For Microencapsulation
The increased demand and awareness for value-added goods in areas such as nutrition, food, healthcare, and personal care are driving the microencapsulation ingredients market in India. Companies are working on developing functional items with revolutionary technologies such as microencapsulation biomolecules as a result of greater awareness and demand.
Get the data you need at a Fraction of the cost
Personalize your report by choosing insights you need
and save 40%!
“Growing Application across the Pharmaceutical Sector to Bolster Microencapsulation Sales”
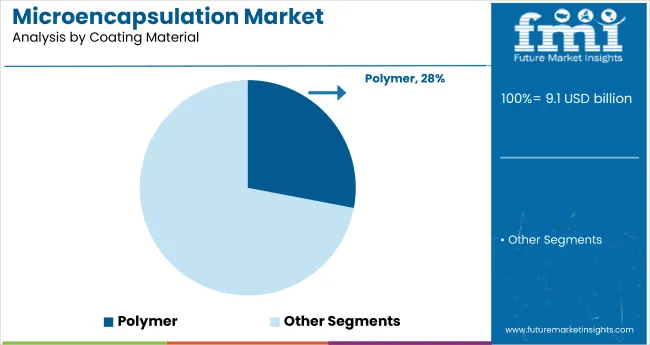
In 2021, ethyl cellulose accounted for about a third of the overall market, and it is expected to increase at a rapid rate throughout the projected period. These resins are water-insoluble and are widely utilized in the pharmaceutical sector as a viscosity-raising agent, filler, flavoring fixative, and coating agent, as well as in the food additive industry as an emulsifier.
“Suring Adoption of Microencapsulation Technologies for Regulated Medicine Delivery to Bolster Market Growth”
The pharmaceutical and healthcare products industry is likely to be the most profitable in terms of application. Microencapsulation is frequently used in the healthcare and pharmaceutical industries for regulated medicine delivery. Microencapsulation technology is frequently used by pharmaceutical companies to mask the harsh taste or odor of drugs, as well as to allow for targeted and controlled administration. Because of functionalities such as concentrated action, the pharmaceutical industry is seeing an increase in demand for microencapsulated biomolecules.
“Gelatine to Account For a Significant Microencapsulation Sales Through 2032”
Gelatine is a commonly utilized coating material that is expected to grow at robust CAGR throughout the assessment period. The substance is widely used in the pharmaceutical, food, and agriculture industries because it is a water-soluble resin.
The pandemic is expected to have a diverse influence on the industry globally through many pathways, including raw material shortages, the infected workforce at industrial levels, demand-supply volatility, trade and logistics, and uncertain consumer demand for food items.
During the COVID-19 pandemic, decreasing demand and revenue in the agrochemicals, personal care, and other industrial sectors have had a retaliatory effect on demand for microencapsulation from these businesses. Manufacturers in industries such as home and personal care and agrochemicals are experiencing difficulties in raw material supply as a result of this. Imports and exports have also been banned or delayed in numerous countries since the outbreak, posing challenges for manufacturers and retailers all around the world.
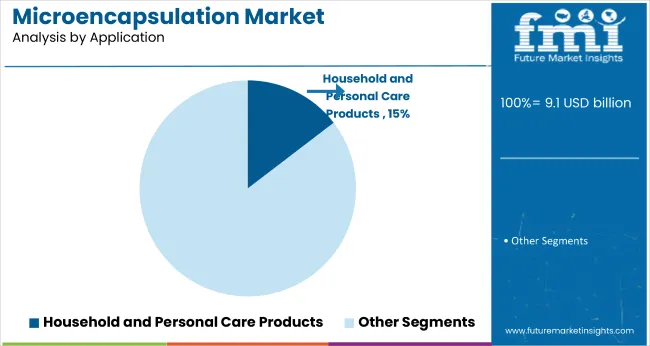
Future Market Insight’s (FMI’s) recent survey on the microencapsulation market provides exclusive insights that assist in identifying potential investment pockets across prominent industries such as pharmaceutical & healthcare, agrochemicals, food & beverages, textile, construction materials, and others. It discloses that pharmaceutical & healthcare industries are estimated to emerge as the most remunerative sales pocket over the forecast period 2022-2032.
The study also discusses what are the factors augmenting the demand for in aforementioned industries along with their impact on overall sales in the global microencapsulation market. For instance, it examines how the adoption of microencapsulation products in new drug delivery technologies favors is the market growth. Access such compelling insights in FMI’s latest microencapsulation market report.
The reports provide a decade-long forecast, analyzing the strategic insights and highlighting prevailing market trends, emerging opportunities, and marco-economic indicators creating growth prospects in the microencapsulation market.
The Microencapsulation Market Analysis Includes:
Attribute | Details |
---|---|
Forecast Period | 2022 to 2032 |
Historical Data Available for | 2017 to 2021 |
Market Analysis | USD Million for Value & MT for Volume |
Report Coverage | Market Forecast, Company Share Analysis, Competition Intelligence, DROT Analysis, Market Dynamics and Challenges, and Strategic Growth Initiatives |
Key Segments Covered | Technology, Core material, Shell material, and Application |
Key Regions Covered |
|
Key Application Covered | Pharmaceutical & Healthcare Products, Food & Beverages, Household & Personal Care Products, Agrochemicals, Construction Material, Textiles, Others |
Key Companies Profiled | Reed Pacific, Encapsys, GAT Microencapsulation, Ronald T. Dodge Company, Capsulae, AVEKA, Others |
Customization & Pricing | Available upon Request |
By Technology:
By Core material:
By Shell material:
By Application:
Region:
1. Market Overview 1.1. Market Coverage / Taxonomy 1.2. Market Definition / Scope / Limitations 2. The Massive Impact of the Crisis 2.1. Global Market Forecast Scenario Comparison of Annual Growth Rates for short Term (2022-2026) and Long Term (2027-2032) 2.1.1. Optimistic Scenario 2.1.1.1. China 2.1.1.2. US 2.1.1.3. India 2.1.1.4. Euro Zone 2.1.1.5. Asia Pacific 2.1.1.6. Rest of the World 2.1.2. Likely Scenario 2.1.2.1. China 2.1.2.2. US 2.1.2.3. India 2.1.2.4. Euro Zone 2.1.2.5. Asia Pacific 2.1.2.6. Rest of the World 2.1.3. Pessimistic Scenario 2.1.3.1. China 2.1.3.2. US 2.1.3.3. India 2.1.3.4. Euro Zone 2.1.3.5. Asia Pacific 2.1.3.6. Rest of the World 2.2. Key Factors Impacting the Market Note: Market Assessment shall be Provided for Likely Scenario 3. Market Dynamics 3.1. Drivers 3.1.1. Supply Side Drivers 3.1.2. Demand Side drivers 3.1.3. Economic Side Drivers 3.2. Restraints 3.3. Opportunity 3.4. Market trends By Region 3.5. Product Launches 3.6. Product Claims & Nutritional Information Scan by Buyers 3.7. Macro-Economic Factors 3.8. Forecast Factors - Relevance & Impact 3.9. Consumers Survey Analysis 4. Key Regulations 4.1. Packaging & Labelling Regulations 4.2. Certifications and Certifying Agency Overview 4.3. Import/Export Policies 5. Global Market Demand Analysis 2017-2021 and Forecast, 2022-2032 5.1. Historical Market Volume (Metric Tons) Analysis, 2017-2021 5.2. Current and Future Market Volume (Metric Tons) Projections, 2022-2032 5.3. Y-o-Y Growth Trend Analysis 6. Global Market - Pricing Analysis 6.1. Regional Pricing Analysis (USD/Metric Tons) By Technology (2017,2022,2032) 6.1.1. Emulsion 6.1.2. Coating 6.1.3. Spray technologies 6.1.4. Dripping 6.1.5. Others 6.2. Pricing Break-up (2017,2022,2032) 6.2.1. Producer Level Pricing 6.2.2. Distributor Level Pricing 6.2.3. Retailer Level Pricing 6.3. Global Average Pricing Analysis Benchmark 7. Global Market Demand (Size in USD Mn) Analysis 2017-2021 and Forecast, 2022-2032 7.1. Historical Market Value (USD Mn) Analysis, 2017-2021 7.2. Current and Future Market Value (USD Mn) Projections, 2022-2032 7.2.1. Y-o-Y Growth Trend Analysis 7.2.2. Absolute $ Opportunity Analysis 8. Global Market Analysis 2017-2021 and Forecast 2022-2032, By Technology 8.1. Introduction / Key Findings 8.2. Historical Market Size (USD Mn) and Volume Analysis By Technology, 2017 - 2021 8.3. Current and Future Market Size (USD Mn) and Volume Analysis and Forecast By Technology, 2022-2032 8.3.1. Emulsion 8.3.2. Coating 8.3.3. Spray technologies 8.3.4. Dripping 8.3.5. Others 8.4. Market Attractiveness Analysis By Technology 9. Global Market Analysis 2017-2021 and Forecast 2022-2032, By Application 9.1. Introduction / Key Findings 9.2. Historical Market Size (USD Mn) and Volume Analysis By Application, 2017 - 2021 9.3. Current and Future Market Size (USD Mn) and Volume Analysis and Forecast By Application, 2022-2032 9.3.1. Pharmaceuticals 9.3.2. Food and beverages 9.3.3. Household and personal care products 9.3.4. Agrochemicals 9.3.5. Construction materials 9.3.6. Textiles 9.3.7. Paper and Printing 9.3.8. Other 9.4. Market Attractiveness Analysis by Application 10. Global Market Analysis 2017-2021 and Forecast 2022-2032, By Coating Materials 10.1. Introduction / Key Findings 10.2. Historical Market Size (USD Mn) and Volume Analysis By Coating Materials, 2017 - 2021 10.3. Current and Future Market Size (USD Mn) and Volume Analysis and Forecast By Coating Materials, 2022-2032 10.3.1. Proteins 10.3.2. Carbohydrates 10.3.3. Gums and Resins 10.3.4. Polymers 10.3.5. Lipids 10.3.6. Others 10.4. Market Attractiveness Analysis by Coating Materials 11. Global Market Analysis 2017-2021 and Forecast 2022-2032, By Region 11.1. Introduction 11.2. Historical Market Size (USD Mn) and Volume Analysis By Region, 2017 - 2021 11.3. Current Market Size (USD Mn) and Volume Analysis and Forecast By Region, 2022-2032 11.3.1. North America 11.3.2. Latin America 11.3.3. Europe 11.3.4. East Asia 11.3.5. South Asia 11.3.6. Oceania 11.3.7. MEA 11.4. Market Attractiveness Analysis By Region 12. North America Market Analysis 2017-2021 and Forecast 2022-2032 12.1. Introduction 12.2. Pricing Analysis 12.3. Historical Market Size (USD Mn) and Volume Trend Analysis By Market Taxonomy, 2017 - 2021 12.4. Market Size (USD Mn) and Volume Forecast By Market Taxonomy, 2021 - 2031 12.4.1. By Country 12.4.1.1. U.S. 12.4.1.2. Canada 12.4.2. By Technology 12.4.3. By Coating Materials 12.4.4. By Application 12.5. Market Attractiveness Analysis 12.5.1. By Technology 12.5.2. By Coating Materials 12.5.3. By Application 12.6. Market Trends 12.7. Key Market Participants - Intensity Mapping 12.8. Drivers and Restraints - Impact Analysis 13. Latin America Market Analysis 2017-2021 and Forecast 2022-2032 13.1. Introduction 13.2. Pricing Analysis 13.3. Historical Market Size (USD Mn) and Volume Trend Analysis By Market Taxonomy, 2017 - 2021 13.4. Market Size (USD Mn) and Volume Forecast By Market Taxonomy, 2021 - 2031 13.4.1. By Country 13.4.1.1. Brazil 13.4.1.2. Mexico 13.4.1.3. Rest of Latin America 13.4.2. By Technology 13.4.3. By Coating Materials 13.4.4. By Application 13.5. Market Attractiveness Analysis 13.5.1. By Technology 13.5.2. By Coating Materials 13.5.3. By Application 13.6. Market Trends 13.7. Key Market Participants - Intensity Mapping 13.8. Drivers and Restraints - Impact Analysis 14. Europe Market Analysis 2017-2021 and Forecast 2022-2032 14.1. Introduction 14.2. Pricing Analysis 14.3. Historical Market Size (USD Mn) and Volume Trend Analysis By Market Taxonomy, 2017 - 2021 14.4. Market Size (USD Mn) and Volume Forecast By Market Taxonomy, 2021 - 2031 14.4.1. By Country 14.4.1.1. German 14.4.1.2. Italy 14.4.1.3. France 14.4.1.4. U.K 14.4.1.5. Spain 14.4.1.6. BENELUX 14.4.1.7. Nordic 14.4.1.8. Russia 14.4.1.9. Poland 14.4.1.10. Rest of Western Europe 14.4.2. By Technology 14.4.3. By Coating Materials 14.4.4. By Application 14.5. Market Attractiveness Analysis 14.5.1. By Technology 14.5.2. By Coating Materials 14.5.3. By Application 14.6. Market Trends 14.7. Key Market Participants - Intensity Mapping 14.8. Drivers and Restraints - Impact Analysis 15. East Asia Market Analysis 2017-2021 and Forecast 2022-2032 15.1. Introduction 15.2. Pricing Analysis 15.3. Historical Market Size (USD Mn) and Volume Trend Analysis By Market Taxonomy, 2017 - 2021 15.4. Market Size (USD Mn) and Volume Forecast By Market Taxonomy, 2021 - 2031 15.4.1. By Country 15.4.1.1. Chin 15.4.1.2. Japan 15.4.1.3. South Korea 15.4.2. By Technology 15.4.3. By Coating Materials 15.4.4. By Application 15.5. Market Attractiveness Analysis 15.5.1. By Technology 15.5.2. By Coating Materials 15.5.3. By Application 15.6. Market Trends 15.7. Key Market Participants - Intensity Mapping 15.8. Drivers and Restraints - Impact Analysis 16. South Asia Market Analysis 2017-2021 and Forecast 2022-2032 16.1. Introduction 16.2. Pricing Analysis 16.3. Historical Market Size (USD Mn) and Volume Trend Analysis By Market Taxonomy, 2017 - 2021 16.4. Market Size (USD Mn) and Volume Forecast By Market Taxonomy, 2021 - 2031 16.4.1. By Country 16.4.1.1. India 16.4.1.2. Thailand 16.4.1.3. Indonesia 16.4.1.4. Malaysia 16.4.1.5. Singapore 16.4.1.6. Rest of South Asia 16.4.2. By Technology 16.4.3. By Coating Materials 16.4.4. By Application 16.5. Market Attractiveness Analysis 16.5.1. By Technology 16.5.2. By Coating Materials 16.5.3. By Application 16.6. Market Trends 16.7. Key Market Participants - Intensity Mapping 16.8. Drivers and Restraints - Impact Analysis 17. Oceania Market Analysis 2017-2021 and Forecast 2022-2032 17.1. Introduction 17.2. Pricing Analysis 17.3. Historical Market Size (USD Mn) and Volume Trend Analysis By Market Taxonomy, 2017 - 2021 17.4. Market Size (USD Mn) and Volume Forecast By Market Taxonomy, 2021 - 2031 17.4.1. By Country 17.4.1.1. Australia 17.4.1.2. New Zealand 17.4.2. By Technology 17.4.3. By Coating Materials 17.4.4. By Application 17.5. Market Attractiveness Analysis 17.5.1. By Technology 17.5.2. By Application 17.5.3. By Application 17.6. Market Trends 17.7. Key Market Participants - Intensity Mapping 17.8. Drivers and Restraints - Impact Analysis 18. Middle East and Africa Market Analysis 2017-2021 and Forecast 2022-2032 18.1. Introduction 18.2. Pricing Analysis 18.3. Historical Market Size (USD Mn) and Volume Trend Analysis By Market Taxonomy, 2017 - 2021 18.4. Market Size (USD Mn) and Volume Forecast By Market Taxonomy, 2021 - 2031 18.4.1. By Country 18.4.1.1. GCC Countries, 18.4.1.2. South Africa 18.4.1.3. Rest of MEA 18.4.2. By Technology 18.4.3. By Coating Materials 18.4.4. By Application 18.5. Market Attractiveness Analysis 18.5.1. By Technology 18.5.2. By Coating Materials 18.5.3. By Application 18.6. Market Trends 18.7. Key Market Participants - Intensity Mapping 18.8. Drivers and Restraints - Impact Analysis 19. Key Countries Market Analysis 2017–2021 and Forecast 2022–2032 19.1. U.S. 19.1.1. Pricing Analysis (2017, 2022, 2032) 19.1.2. Market Value and Volume Analysis 2017–2021 and Forecast 2022–2032 19.1.2.1. By Technology 19.1.2.2. By Coating Materials 19.1.2.3. By Application 19.2. Canada 19.2.1. Pricing Analysis (2017, 2022, 2032) 19.2.2. Market Value and Volume Analysis 2017–2021 and Forecast 2022–2032 19.2.2.1. By Technology 19.2.2.2. By Coating Materials 19.2.2.3. By Application 19.3. Brazil 19.3.1. Pricing Analysis (2017, 2022, 2032) 19.3.2. Market Value and Volume Analysis 2017–2021 and Forecast 2022–2032 19.3.2.1. By Technology 19.3.2.2. By Coating Materials 19.3.2.3. By Application 19.4. Mexico 19.4.1. Pricing Analysis (2017, 2022, 2032) 19.4.2. Market Value and Volume Analysis 2017–2021 and Forecast 2022–2032 19.4.2.1. By Technology 19.4.2.2. By Application 19.4.2.3. By Sales Channel 19.5. Germany 19.5.1. Pricing Analysis (2017, 2022, 2032) 19.5.2. Market Value and Volume Analysis 2017–2021 and Forecast 2022–2032 19.5.2.1. By Technology 19.5.2.2. By Application 19.5.2.3. By Sales Channel 19.6. Italy 19.6.1. Pricing Analysis (2017, 2022, 2032) 19.6.2. Market Value and Volume Analysis 2017–2021 and Forecast 2022–2032 19.6.2.1. By Technology 19.6.2.2. By Coating Materials 19.6.2.3. By Application 19.7. France 19.7.1. Pricing Analysis (2017, 2022, 2032) 19.7.2. Market Value and Volume Analysis 2017–2021 and Forecast 2022–2032 19.7.2.1. By Technology 19.7.2.2. By Coating Materials 19.7.2.3. By Application 19.8. U.K. 19.8.1. Pricing Analysis (2017, 2022, 2032) 19.8.2. Market Value and Volume Analysis 2017–2021 and Forecast 2022–2032 19.8.2.1. By Technology 19.8.2.2. By Coating Materials 19.8.2.3. By Application 19.9. Spain 19.9.1. Pricing Analysis (2017, 2022, 2032) 19.9.2. Market Value and Volume Analysis 2017–2021 and Forecast 2022–2032 19.9.2.1. By Technology 19.9.2.2. By Coating Materials 19.9.2.3. By Application 19.10. BENELUX 19.10.1. Pricing Analysis (2017, 2022, 2032) 19.10.2. Market Value and Volume Analysis 2017–2021 and Forecast 2022–2032 19.10.2.1. By Technology 19.10.2.2. By Coating Materials 19.10.2.3. By Application 19.11. Nordic 19.11.1. Pricing Analysis (2017, 2022, 2032) 19.11.2. Market Value and Volume Analysis 2017–2021 and Forecast 2022–2032 19.11.2.1. By Technology 19.11.2.2. By Coating Materials 19.11.2.3. By Application 19.12. Russia 19.12.1. Pricing Analysis (2017, 2022, 2032) 19.12.2. Market Value and Volume Analysis 2017–2021 and Forecast 2022–2032 19.12.2.1. By Technology 19.12.2.2. By Coating Materials 19.12.2.3. By Application 19.13. Poland 19.13.1. Pricing Analysis (2017, 2022, 2032) 19.13.2. Market Value and Volume Analysis 2017–2021 and Forecast 2022–2032 19.13.2.1. By Technology 19.13.2.2. By Coating Materials 19.13.2.3. By Application 19.13.2.4. 19.14. China 19.14.1. Pricing Analysis (2017, 2022, 2032) 19.14.2. Market Value and Volume Analysis 2017–2021 and Forecast 2022–2032 19.14.2.1. By Technology 19.14.2.2. By Coating Materials 19.14.2.3. By Application 19.15. Japan 19.15.1. Pricing Analysis (2017, 2022, 2032) 19.15.2. Market Value and Volume Analysis 2017–2021 and Forecast 2022–2032 19.15.2.1. By Technology 19.15.2.2. By Coating Materials 19.15.2.3. By Application 19.16. South Korea 19.16.1. Pricing Analysis (2017, 2022, 2032) 19.16.2. Market Value and Volume Analysis 2017–2021 and Forecast 2022–2032 19.16.2.1. By Technology 19.16.2.2. By Coating Materials 19.16.2.3. By Application 19.17. India 19.17.1. Pricing Analysis (2017, 2022, 2032) 19.17.2. Market Value and Volume Analysis 2017–2021 and Forecast 2022–2032 19.17.2.1. By Technology 19.17.2.2. By Coating Materials 19.17.2.3. By Application 19.17.2.4. 19.18. Thailand 19.18.1. Pricing Analysis (2017, 2022, 2032) 19.18.2. Market Value and Volume Analysis 2017–2021 and Forecast 2022–2032 19.18.2.1. By Technology 19.18.2.2. By Coating Materials 19.18.2.3. By Application 19.19. Indonesia 19.19.1. Pricing Analysis (2017, 2022, 2032) 19.19.2. Market Value and Volume Analysis 2017–2021 and Forecast 2022–2032 19.19.2.1. By Technology 19.19.2.2. By Coating Materials 19.19.2.3. By Application 19.20. Malaysia 19.20.1. Pricing Analysis (2017, 2022, 2032) 19.20.2. Market Value and Volume Analysis 2017–2021 and Forecast 2022–2032 19.20.2.1. By Technology 19.20.2.2. By Coating Materials 19.20.2.3. By Application 19.21. Singapore 19.21.1. Pricing Analysis (2017, 2022, 2032) 19.21.2. Market Value and Volume Analysis 2017–2021 and Forecast 2022–2032 19.21.2.1. By Technology 19.21.2.2. By Coating Materials 19.21.2.3. By Application 19.22. GCC Countries 19.22.1. Pricing Analysis (2017, 2022, 2032) 19.22.2. Market Value and Volume Analysis 2017–2021 and Forecast 2022–2032 19.22.2.1. By Technology 19.22.2.2. By Application 19.22.2.3. By Sales Channel 19.23. South Africa 19.23.1. Pricing Analysis (2017, 2022, 2032) 19.23.2. Market Value and Volume Analysis 2017–2021 and Forecast 2022–2032 19.23.2.1. By Technology 19.23.2.2. By Coating Materials 19.23.2.3. By Application 20. Market Structure Analysis 20.1. Market Analysis by Tier of Companies 20.2. Company Share Analysis of Top Players 20.2.1. By Technology 20.3. Market Presence Analysis 20.3.1. By Regional Footprint of Players 20.3.2. Product Footprint by Players 20.3.3. Channel Footprint by Players 21. Competition Analysis 21.1. Competition Dashboard 21.2. Competition Deep Dive (Tentative List) 21.2.1. Royal Friesland Campina 21.2.1.1. Overview 21.2.1.2. Product Portfolio 21.2.1.3. Profitability by Market Segments (Product/Channel/Region) 21.2.1.4. Sales Footprint 21.2.1.5. Strategy Overview 21.2.1.5.1. Marketing Strategy 21.2.1.5.2. Product Strategy 21.2.2. Syngenta Crop Protection 21.2.2.1. Overview 21.2.2.2. Product Portfolio 21.2.2.3. Profitability by Market Segments (Product/Channel/Region) 21.2.2.4. Sales Footprint 21.2.2.5. Strategy Overview 21.2.2.5.1. Marketing Strategy 21.2.2.5.2. Product Strategy 21.2.3. BASF SE 21.2.3.1. Overview 21.2.3.2. Product Portfolio 21.2.3.3. Profitability by Market Segments (Product/Channel/Region) 21.2.3.4. Sales Footprint 21.2.3.5. Strategy Overview 21.2.3.5.1. Marketing Strategy 21.2.3.5.2. Product Strategy 21.2.4. Koninklijke DSM 21.2.4.1. Overview 21.2.4.2. Product Portfolio 21.2.4.3. Profitability by Market Segments (Product/Channel/Region) 21.2.4.4. Sales Footprint 21.2.4.5. Strategy Overview 21.2.4.5.1. Marketing Strategy 21.2.4.5.2. Product Strategy 21.2.5. Givaudan 21.2.5.1. Overview 21.2.5.2. Product Portfolio 21.2.5.3. Profitability by Market Segments (Product/Channel/Region) 21.2.5.4. Sales Footprint 21.2.5.5. Strategy Overview 21.2.5.5.1. Marketing Strategy 21.2.5.5.2. Product Strategy 21.2.6. Firmenich 21.2.6.1. Overview 21.2.6.2. Product Portfolio 21.2.6.3. Profitability by Market Segments (Product/Channel/Region) 21.2.6.4. Sales Footprint 21.2.6.5. Strategy Overview 21.2.6.5.1. Marketing Strategy 21.2.6.5.2. Product Strategy 21.2.7. Symrise 21.2.7.1. Overview 21.2.7.2. Product Portfolio 21.2.7.3. Profitability by Market Segments (Product/Channel/Region) 21.2.7.4. Sales Footprint 21.2.7.5. Strategy Overview 21.2.7.5.1. Marketing Strategy 21.2.7.5.2. Product Strategy 21.2.8. International Flavors & Fragrances 21.2.8.1. Overview 21.2.8.2. Product Portfolio 21.2.8.3. Profitability by Market Segments (Product/Channel/Region) 21.2.8.4. Sales Footprint 21.2.8.5. Strategy Overview 21.2.8.5.1. Marketing Strategy 21.2.8.5.2. Product Strategy 21.2.9. Sensient Technologies 21.2.9.1. Overview 21.2.9.2. Product Portfolio 21.2.9.3. Profitability by Market Segments (Product/Channel/Region) 21.2.9.4. Sales Footprint 21.2.9.5. Strategy Overview 21.2.9.5.1. Marketing Strategy 21.2.9.5.2. Product Strategy 21.2.10. Lycored Corp. 21.2.10.1. Overview 21.2.10.2. Product Portfolio 21.2.10.3. Profitability by Market Segments (Product/Channel/Region) 21.2.10.4. Sales Footprint 21.2.10.5. Strategy Overview 21.2.10.5.1. Marketing Strategy 21.2.10.5.2. Product Strategy 21.2.11. Other Players (On Additional Requests) 21.2.11.1. Overview 21.2.11.2. Product Portfolio 21.2.11.3. Profitability by Market Segments (Product/Channel/Region) 21.2.11.4. Sales Footprint 21.2.11.5. Strategy Overview 21.2.11.5.1. Marketing Strategy 21.2.11.5.2. Product Strategy 22. Value Chain Analysis 22.1. Operating margins at each node of supply chain 22.2. List of Active Market Participants 22.2.1. Product Manufacturers 22.2.2. Key Brands 23. Assumptions and Acronyms Used 24. Research Methodolog
Don't pay for what you don't need
Customize your report by selecting specific countries or regions and save 30%!
Table 1: Global Food Market Value (USD Mn) and Forecast by Region, 2017-2021 Table 2: Global Food Market Value (USD Mn) and Forecast by Region, 2022-2032 Table 3: Global Food Market Volume (Metric Tons) and Forecast by Region, 2017-2021 Table 4: Global Food Market Volume (Metric Tons) and Forecast by Region, 2022-2032 Table 5: Global Food Market Value (USD Mn) and Forecast by Technology, 2017-2021 Table 6: Global Food Market Value (USD Mn) and Forecast by Technology, 2022-2032 Table 7: Global Food Market Volume (Metric Tons) and Forecast by Technology, 2017-2021 Table 8: Global Food Market Volume (Metric Tons) and Forecast by Technology, 2022-2032 Table 9: Global Food Market Value (USD Mn) and Forecast by Coating material, 2017-2021 Table 10: Global Food Market Value (USD Mn) and Forecast by Coating material, 2022-2032 Table 11: Global Food Market Volume (Metric Tons) and Forecast by Coating material, 2017-2021 Table 12: Global Food Market Volume (Metric Tons) and Forecast by Coating material, 2022-2032 Table 13: Global Food Market Value (USD Mn) and Forecast by Application, 2017-2021 Table 14: Global Food Market Value (USD Mn) and Forecast by Application, 2022-2032 Table 15: Global Food Market Volume (Metric Tons) and Forecast by Application, 2017-2021 Table 16: Global Food Market Volume (Metric Tons) and Forecast by Application, 2022-2032 Table 17: North America Food Market Value (USD Mn) and Forecast by Region, 2017-2021 Table 18: North America Food Market Value (USD Mn) and Forecast by Region, 2022-2032 Table 19: North America Food Market Volume (Metric Tons) and Forecast by Region, 2017-2021 Table 20: North America Food Market Volume (Metric Tons) and Forecast by Region, 2022-2032 Table 21: North America Food Market Value (USD Mn) and Forecast by Technology, 2017-2021 Table 22: North America Food Market Value (USD Mn) and Forecast by Technology, 2022-2032 Table 23: North America Food Market Volume (Metric Tons) and Forecast by Technology, 2017-2021 Table 24: North America Food Market Volume (Metric Tons) and Forecast by Technology, 2022-2032 Table 25: North America Food Market Value (USD Mn) and Forecast by Coating material, 2017-2021 Table 26: North America Food Market Value (USD Mn) and Forecast by Coating material, 2022-2032 Table 27: North America Food Market Volume (Metric Tons) and Forecast by Coating material, 2017-2021 Table 28: North America Food Market Volume (Metric Tons) and Forecast by Coating material, 2022-2032 Table 29: North America Food Market Value (USD Mn) and Forecast by Application, 2017-2021 Table 30: North America Food Market Value (USD Mn) and Forecast by Application, 2022-2032 Table 31: North America Food Market Volume (Metric Tons) and Forecast by Application, 2017-2021 Table 32: North America Food Market Volume (Metric Tons) and Forecast by Application, 2022-2032 Table 33: Latin America Food Market Value (USD Mn) and Forecast by Region, 2017-2021 Table 34: Latin America Food Market Value (USD Mn) and Forecast by Region, 2022-2032 Table 35: Latin America Food Market Volume (Metric Tons) and Forecast by Region, 2017-2021 Table 36: Latin America Food Market Volume (Metric Tons) and Forecast by Region, 2022-2032 Table 37: Latin America Food Market Value (USD Mn) and Forecast by Technology, 2017-2021 Table 38: Latin America Food Market Value (USD Mn) and Forecast by Technology, 2022-2032 Table 39: Latin America Food Market Volume (Metric Tons) and Forecast by Technology, 2017-2021 Table 40: Latin America Food Market Volume (Metric Tons) and Forecast by Technology, 2022-2032 Table 41: Latin America Food Market Value (USD Mn) and Forecast by Coating material, 2017-2021 Table 42: Latin America Food Market Value (USD Mn) and Forecast by Coating material, 2022-2032 Table 43: Latin America Food Market Volume (Metric Tons) and Forecast by Coating material, 2017-2021 Table 44: Latin America Food Market Volume (Metric Tons) and Forecast by Coating material, 2022-2032 Table 45: Latin America Food Market Value (USD Mn) and Forecast by Application, 2017-2021 Table 46: Latin America Food Market Value (USD Mn) and Forecast by Application, 2022-2032 Table 47: Latin America Food Market Volume (Metric Tons) and Forecast by Application, 2017-2021 Table 48: Latin America Food Market Volume (Metric Tons) and Forecast by Application, 2022-2032 Table 49: Europe Food Market Value (USD Mn) and Forecast by Region, 2017-2021 Table 50: Europe Food Market Value (USD Mn) and Forecast by Region, 2022-2032 Table 51: Europe Food Market Volume (Metric Tons) and Forecast by Region, 2017-2021 Table 52: Europe Food Market Volume (Metric Tons) and Forecast by Region, 2022-2032 Table 53: Europe Food Market Value (USD Mn) and Forecast by Technology, 2017-2021 Table 54: Europe Food Market Value (USD Mn) and Forecast by Technology, 2022-2032 Table 55: Europe Food Market Volume (Metric Tons) and Forecast by Technology, 2017-2021 Table 56: Europe Food Market Volume (Metric Tons) and Forecast by Technology, 2022-2032 Table 57: Europe Food Market Value (USD Mn) and Forecast by Coating material, 2017-2021 Table 58: Europe Food Market Value (USD Mn) and Forecast by Coating material, 2022-2032 Table 59: Europe Food Market Volume (Metric Tons) and Forecast by Coating material, 2017-2021 Table 60: Europe Food Market Volume (Metric Tons) and Forecast by Coating material, 2022-2032 Table 61: Europe Food Market Value (USD Mn) and Forecast by Application, 2017-2021 Table 62: Europe Food Market Value (USD Mn) and Forecast by Application, 2022-2032 Table 63: Europe Food Market Volume (Metric Tons) and Forecast by Application, 2017-2021 Table 64: Europe Food Market Volume (Metric Tons) and Forecast by Application, 2022-2032 Table 65: East Asia Food Market Value (USD Mn) and Forecast by Region, 2017-2021 Table 66: East Asia Food Market Value (USD Mn) and Forecast by Region, 2022-2032 Table 67: East Asia Food Market Volume (Metric Tons) and Forecast by Region, 2017-2021 Table 68: East Asia Food Market Volume (Metric Tons) and Forecast by Region, 2022-2032 Table 69: East Asia Food Market Value (USD Mn) and Forecast by Technology, 2017-2021 Table 70: East Asia Food Market Value (USD Mn) and Forecast by Technology, 2022-2032 Table 71: East Asia Food Market Volume (Metric Tons) and Forecast by Technology, 2017-2021 Table 72: East Asia Food Market Volume (Metric Tons) and Forecast by Technology, 2022-2032 Table 73: East Asia Food Market Value (USD Mn) and Forecast by Coating material, 2017-2021 Table 74: East Asia Food Market Value (USD Mn) and Forecast by Coating material, 2022-2032 Table 75: East Asia Food Market Volume (Metric Tons) and Forecast by Coating material, 2017-2021 Table 76: East Asia Food Market Volume (Metric Tons) and Forecast by Coating material, 2022-2032 Table 77: East Asia Food Market Value (USD Mn) and Forecast by Application, 2017-2021 Table 78: East Asia Food Market Value (USD Mn) and Forecast by Application, 2022-2032 Table 79: East Asia Food Market Volume (Metric Tons) and Forecast by Application, 2017-2021 Table 80: East Asia Food Market Volume (Metric Tons) and Forecast by Application, 2022-2032 Table 81: South Asia Food Market Value (USD Mn) and Forecast by Region, 2017-2021 Table 82: South Asia Food Market Value (USD Mn) and Forecast by Region, 2022-2032 Table 83: South Asia Food Market Volume (Metric Tons) and Forecast by Region, 2017-2021 Table 84: South Asia Food Market Volume (Metric Tons) and Forecast by Region, 2022-2032 Table 85: South Asia Food Market Value (USD Mn) and Forecast by Technology, 2017-2021 Table 86: South Asia Food Market Value (USD Mn) and Forecast by Technology, 2022-2032 Table 87: South Asia Food Market Volume (Metric Tons) and Forecast by Technology, 2017-2021 Table 88: South Asia Food Market Volume (Metric Tons) and Forecast by Technology, 2022-2032 Table 89: South Asia Food Market Value (USD Mn) and Forecast by Coating material, 2017-2021 Table 90: South Asia Food Market Value (USD Mn) and Forecast by Coating material, 2022-2032 Table 91: South Asia Food Market Volume (Metric Tons) and Forecast by Coating material, 2017-2021 Table 92: South Asia Food Market Volume (Metric Tons) and Forecast by Coating material, 2022-2032 Table 93: South Asia Food Market Value (USD Mn) and Forecast by Application, 2017-2021 Table 94: South Asia Food Market Value (USD Mn) and Forecast by Application, 2022-2032 Table 95: South Asia Food Market Volume (Metric Tons) and Forecast by Application, 2017-2021 Table 96: South Asia Food Market Volume (Metric Tons) and Forecast by Application, 2022-2032 Table 97: Oceania Food Market Value (USD Mn) and Forecast by Region, 2017-2021 Table 98: Oceania Food Market Value (USD Mn) and Forecast by Region, 2022-2032 Table 99: Oceania Food Market Volume (Metric Tons) and Forecast by Region, 2017-2021 Table 100: Oceania Food Market Volume (Metric Tons) and Forecast by Region, 2022-2032 Table 101: Oceania Food Market Value (USD Mn) and Forecast by Technology, 2017-2021 Table 102: Oceania Food Market Value (USD Mn) and Forecast by Technology, 2022-2032 Table 103: Oceania Food Market Volume (Metric Tons) and Forecast by Technology, 2017-2021 Table 104: Oceania Food Market Volume (Metric Tons) and Forecast by Technology, 2022-2032 Table 105: Oceania Food Market Value (USD Mn) and Forecast by Coating material, 2017-2021 Table 106: Oceania Food Market Value (USD Mn) and Forecast by Coating material, 2022-2032 Table 107: Oceania Food Market Volume (Metric Tons) and Forecast by Coating material, 2017-2021 Table 108: Oceania Food Market Volume (Metric Tons) and Forecast by Coating material, 2022-2032 Table 109: Oceania Food Market Value (USD Mn) and Forecast by Application, 2017-2021 Table 110: Oceania Food Market Value (USD Mn) and Forecast by Application, 2022-2032 Table 111: Oceania Food Market Volume (Metric Tons) and Forecast by Application, 2017-2021 Table 112: Oceania Food Market Volume (Metric Tons) and Forecast by Application, 2022-2032 Table 113: Middle East and Africa Food Market Value (USD Mn) and Forecast by Region, 2017-2021 Table 114: Middle East and Africa Food Market Value (USD Mn) and Forecast by Region, 2022-2032 Table 115: Middle East and Africa Food Market Volume (Metric Tons) and Forecast by Region, 2017-2021 Table 116: Middle East and Africa Food Market Volume (Metric Tons) and Forecast by Region, 2022-2032 Table 117: Middle East and Africa Food Market Value (USD Mn) and Forecast by Technology, 2017-2021 Table 118: Middle East and Africa Food Market Value (USD Mn) and Forecast by Technology, 2022-2032 Table 119: Middle East and Africa Food Market Volume (Metric Tons) and Forecast by Technology, 2017-2021 Table 120: Middle East and Africa Food Market Volume (Metric Tons) and Forecast by Technology, 2022-2032 Table 121: Middle East and Africa Food Market Value (USD Mn) and Forecast by Coating material, 2017-2021 Table 122: Middle East and Africa Food Market Value (USD Mn) and Forecast by Coating material, 2022-2032 Table 123: Middle East and Africa Food Market Volume (Metric Tons) and Forecast by Coating material, 2017-2021 Table 124: Middle East and Africa Food Market Volume (Metric Tons) and Forecast by Coating material, 2022-2032 Table 125: Middle East and Africa Food Market Value (USD Mn) and Forecast by Application, 2017-2021 Table 126: Middle East and Africa Food Market Value (USD Mn) and Forecast by Application, 2022-2032 Table 127: Middle East and Africa Food Market Volume (Metric Tons) and Forecast by Application, 2017-2021 Table 128: Middle East and Africa Food Market Volume (Metric Tons) and Forecast by Application, 2022-2032
Figure 1: Global Food Market Value (USD Mn) and Volume (MT) Forecast, 2022-2032 Figure 2: Global Food Market Absolute $ Opportunity (USD Mn), 2022-2032 Figure 3: Global Food Market Value (USD Mn) and % Growth by Region, 2022 & 2032 Figure 4: Global Food Market Y-o-Y Growth Rate by Region, 2022-2032 Figure 5: Global Food Market Value (USD Mn) and % Growth by Technology, 2022 & 2032 Figure 6: Global Food Market Y-o-Y Growth Rate by Technology, 2022-2032 Figure 7: Global Food Market Value (USD Mn) and % Growth by Coating material, 2022 & 2032 Figure 8: Global Food Market Y-o-Y Growth Rate by Coating material, 2022-2032 Figure 9: Global Food Market Value (USD Mn) and % Growth by Application, 2022 & 2032 Figure 10: Global Food Market Y-o-Y Growth Rate by Application, 2022-2032 Figure 11: Global Food Market Value (USD Mn) and % Growth by Application, 2022 & 2032 Figure 12: Global Food Market Y-o-Y Growth Rate by Application, 2022-2032 Figure 13: Global Food Market Attractiveness Analysis by Region, 2022-2032 Figure 14: Global Food Market Attractiveness Analysis by Technology, 2022-2032 Figure 15: Global Food Market Attractiveness Analysis by Coating material, 2022-2032 Figure 16: Global Food Market Attractiveness Analysis by Application, 2022-2032 Figure 17: North America Food Market Value (USD Mn) and Volume (MT) Forecast, 2022-2032 Figure 18: North America Food Market Absolute $ Opportunity (USD Mn), 2022-2032 Figure 19: North America Food Market Value (USD Mn) and % Growth by Region, 2022 & 2032 Figure 20: North America Food Market Y-o-Y Growth Rate by Region, 2022-2032 Figure 21: North America Food Market Value (USD Mn) and % Growth by Technology, 2022 & 2032 Figure 22: North America Food Market Y-o-Y Growth Rate by Technology, 2022-2032 Figure 23: North America Food Market Value (USD Mn) and % Growth by Coating material, 2022 & 2032 Figure 24: North America Food Market Y-o-Y Growth Rate by Coating material, 2022-2032 Figure 25: North America Food Market Value (USD Mn) and % Growth by Application, 2022 & 2032 Figure 26: North America Food Market Y-o-Y Growth Rate by Application, 2022-2032 Figure 27: North America Food Market Value (USD Mn) and % Growth by Application, 2022 & 2032 Figure 28: North America Food Market Y-o-Y Growth Rate by Application, 2022-2032 Figure 29: North America Food Market Attractiveness Analysis by Region, 2022-2032 Figure 30: North America Food Market Attractiveness Analysis by Technology, 2022-2032 Figure 31: North America Food Market Attractiveness Analysis by Coating material, 2022-2032 Figure 32: North America Food Market Attractiveness Analysis by Application, 2022-2032 Figure 33: Latin America Food Market Value (USD Mn) and Volume (MT) Forecast, 2022-2032 Figure 34: Latin America Food Market Absolute $ Opportunity (USD Mn), 2022-2032 Figure 35: Latin America Food Market Value (USD Mn) and % Growth by Region, 2022 & 2032 Figure 36: Latin America Food Market Y-o-Y Growth Rate by Region, 2022-2032 Figure 37: Latin America Food Market Value (USD Mn) and % Growth by Technology, 2022 & 2032 Figure 38: Latin America Food Market Y-o-Y Growth Rate by Technology, 2022-2032 Figure 39: Latin America Food Market Value (USD Mn) and % Growth by Coating material, 2022 & 2032 Figure 40: Latin America Food Market Y-o-Y Growth Rate by Coating material, 2022-2032 Figure 41: Latin America Food Market Value (USD Mn) and % Growth by Application, 2022 & 2032 Figure 42: Latin America Food Market Y-o-Y Growth Rate by Application, 2022-2032 Figure 43: Latin America Food Market Value (USD Mn) and % Growth by Application, 2022 & 2032 Figure 44: Latin America Food Market Y-o-Y Growth Rate by Application, 2022-2032 Figure 45: Latin America Food Market Attractiveness Analysis by Region, 2022-2032 Figure 46: Latin America Food Market Attractiveness Analysis by Technology, 2022-2032 Figure 47: Latin America Food Market Attractiveness Analysis by Coating material, 2022-2032 Figure 48: Latin America Food Market Attractiveness Analysis by Application, 2022-2032 Figure 49: Europe Food Market Value (USD Mn) and Volume (MT) Forecast, 2022-2032 Figure 50: Europe Food Market Absolute $ Opportunity (USD Mn), 2022-2032 Figure 51: Europe Food Market Value (USD Mn) and % Growth by Region, 2022 & 2032 Figure 52: Europe Food Market Y-o-Y Growth Rate by Region, 2022-2032 Figure 53: Europe Food Market Value (USD Mn) and % Growth by Technology, 2022 & 2032 Figure 54: Europe Food Market Y-o-Y Growth Rate by Technology, 2022-2032 Figure 55: Europe Food Market Value (USD Mn) and % Growth by Coating material, 2022 & 2032 Figure 56: Europe Food Market Y-o-Y Growth Rate by Coating material, 2022-2032 Figure 57: Europe Food Market Value (USD Mn) and % Growth by Application, 2022 & 2032 Figure 58: Europe Food Market Y-o-Y Growth Rate by Application, 2022-2032 Figure 59: Europe Food Market Value (USD Mn) and % Growth by Application, 2022 & 2032 Figure 60: Europe Food Market Y-o-Y Growth Rate by Application, 2022-2032 Figure 61: Europe Food Market Attractiveness Analysis by Region, 2022-2032 Figure 62: Europe Food Market Attractiveness Analysis by Technology, 2022-2032 Figure 63: Europe Food Market Attractiveness Analysis by Coating material, 2022-2032 Figure 64: Europe Food Market Attractiveness Analysis by Application, 2022-2032 Figure 65: East-Asia Food Market Value (USD Mn) and Volume (MT) Forecast, 2022-2032 Figure 66: East-Asia Food Market Absolute $ Opportunity (USD Mn), 2022-2032 Figure 67: East-Asia Food Market Value (USD Mn) and % Growth by Region, 2022 & 2032 Figure 68: East-Asia Food Market Y-o-Y Growth Rate by Region, 2022-2032 Figure 69: East-Asia Food Market Value (USD Mn) and % Growth by Technology, 2022 & 2032 Figure 70: East-Asia Food Market Y-o-Y Growth Rate by Technology, 2022-2032 Figure 71: East-Asia Food Market Value (USD Mn) and % Growth by Coating material, 2022 & 2032 Figure 72: East-Asia Food Market Y-o-Y Growth Rate by Coating material, 2022-2032 Figure 73: East-Asia Food Market Value (USD Mn) and % Growth by Application, 2022 & 2032 Figure 74: East-Asia Food Market Y-o-Y Growth Rate by Application, 2022-2032 Figure 75: East-Asia Food Market Value (USD Mn) and % Growth by Application, 2022 & 2032 Figure 76: East-Asia Food Market Y-o-Y Growth Rate by Application, 2022-2032 Figure 77: East-Asia Food Market Attractiveness Analysis by Region, 2022-2032 Figure 78: East-Asia Food Market Attractiveness Analysis by Technology, 2022-2032 Figure 79: East-Asia Food Market Attractiveness Analysis by Coating material, 2022-2032 Figure 80: East-Asia Food Market Attractiveness Analysis by Application, 2022-2032 Figure 81: South-Asia Food Market Value (USD Mn) and Volume (MT) Forecast, 2022-2032 Figure 82: South-Asia Food Market Absolute $ Opportunity (USD Mn), 2022-2032 Figure 83: South-Asia Food Market Value (USD Mn) and % Growth by Region, 2022 & 2032 Figure 84: South-Asia Food Market Y-o-Y Growth Rate by Region, 2022-2032 Figure 85: South-Asia Food Market Value (USD Mn) and % Growth by Technology, 2022 & 2032 Figure 86: South-Asia Food Market Y-o-Y Growth Rate by Technology, 2022-2032 Figure 87: South-Asia Food Market Value (USD Mn) and % Growth by Coating material, 2022 & 2032 Figure 88: South-Asia Food Market Y-o-Y Growth Rate by Coating material, 2022-2032 Figure 89: South-Asia Food Market Value (USD Mn) and % Growth by Application, 2022 & 2032 Figure 90: South-Asia Food Market Y-o-Y Growth Rate by Application, 2022-2032 Figure 91: South-Asia Food Market Value (USD Mn) and % Growth by Application, 2022 & 2032 Figure 92: South-Asia Food Market Y-o-Y Growth Rate by Application, 2022-2032 Figure 93: South-Asia Food Market Attractiveness Analysis by Region, 2022-2032 Figure 94: South-Asia Food Market Attractiveness Analysis by Technology, 2022-2032 Figure 95: South-Asia Food Market Attractiveness Analysis by Coating material, 2022-2032 Figure 96: South-Asia Food Market Attractiveness Analysis by Application, 2022-2032 Figure 97: Oceania Food Market Value (USD Mn) and Volume (MT) Forecast, 2022-2032 Figure 98: Oceania Food Market Absolute $ Opportunity (USD Mn), 2022-2032 Figure 99: Oceania Food Market Value (USD Mn) and % Growth by Region, 2022 & 2032 Figure 100: Oceania Food Market Y-o-Y Growth Rate by Region, 2022-2032 Figure 101: Oceania Food Market Value (USD Mn) and % Growth by Technology, 2022 & 2032 Figure 102: Oceania Food Market Y-o-Y Growth Rate by Technology, 2022-2032 Figure 103: Oceania Food Market Value (USD Mn) and % Growth by Coating material, 2022 & 2032 Figure 104: Oceania Food Market Y-o-Y Growth Rate by Coating material, 2022-2032 Figure 105: Oceania Food Market Value (USD Mn) and % Growth by Application, 2022 & 2032 Figure 106: Oceania Food Market Y-o-Y Growth Rate by Application, 2022-2032 Figure 107: Oceania Food Market Value (USD Mn) and % Growth by Application, 2022 & 2032 Figure 108: Oceania Food Market Y-o-Y Growth Rate by Application, 2022-2032 Figure 109: Oceania Food Market Attractiveness Analysis by Region, 2022-2032 Figure 110: Oceania Food Market Attractiveness Analysis by Technology, 2022-2032 Figure 111: Oceania Food Market Attractiveness Analysis by Coating material, 2022-2032 Figure 112: Oceania Food Market Attractiveness Analysis by Application, 2022-2032 Figure 113: Middle-East and Africa Food Market Value (USD Mn) and Volume (MT) Forecast, 2022-2032 Figure 114: Middle-East and Africa Food Market Absolute $ Opportunity (USD Mn), 2022-2032 Figure 115: Middle-East and Africa Food Market Value (USD Mn) and % Growth by Region, 2022 & 2032 Figure 116: Middle-East and Africa Food Market Y-o-Y Growth Rate by Region, 2022-2032 Figure 117: Middle-East and Africa Food Market Value (USD Mn) and % Growth by Technology, 2022 & 2032 Figure 118: Middle-East and Africa Food Market Y-o-Y Growth Rate by Technology, 2022-2032 Figure 119: Middle-East and Africa Food Market Value (USD Mn) and % Growth by Coating material, 2022 & 2032 Figure 120: Middle-East and Africa Food Market Y-o-Y Growth Rate by Coating material, 2022-2032 Figure 121: Middle-East and Africa Food Market Value (USD Mn) and % Growth by Application, 2022 & 2032 Figure 122: Middle-East and Africa Food Market Y-o-Y Growth Rate by Application, 2022-2032 Figure 123: Middle-East and Africa Food Market Value (USD Mn) and % Growth by Application, 2022 & 2032 Figure 124: Middle-East and Africa Food Market Y-o-Y Growth Rate by Application, 2022-2032 Figure 125: Middle-East and Africa Food Market Attractiveness Analysis by Region, 2022-2032 Figure 126: Middle-East and Africa Food Market Attractiveness Analysis by Technology, 2022-2032 Figure 127: Middle-East and Africa Food Market Attractiveness Analysis by Coating material, 2022-2032 Figure 128: Middle-East and Africa Food Market Attractiveness Analysis by Application, 2022-2032
Recommendations
Explore Food and Beverage Insights
View Reports