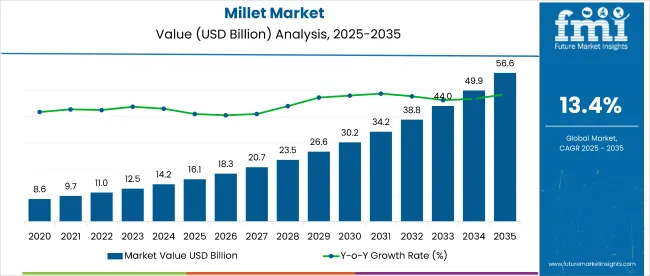
The global millet market is projected to grow from USD 16.1 billion in 2025 to USD 56.7 billion by 2035, registering a CAGR of 13.4%.
| Metric | Value |
|---|---|
| Industry Size (2025E) | USD 16.1 billion |
| Industry Value (2035F) | USD 56.7 billion |
| CAGR (2025 to 2035) | 13.4% |
Governments, particularly in India, are promoting millet cultivation and consumption to enhance food security, nutrition, and farmer welfare. Millet-based foods such as flakes, flour, snacks, and ready-to-eat products are seeing rapid adoption due to their functional benefits and compatibility with evolving dietary preferences.
The market holds a dominant 100% share within the millet-based food and beverage segment. It accounts for 4.5% of the global grains and cereals market, highlighting its growing relevance as a nutritious grain alternative. Within the health and wellness food market, millets contribute around 2.2%, driven by rising demand for clean-label and functional ingredients.
The market captures nearly 1.1% of the plant-based food segment, owing to its vegan-friendly profile. In the gluten-free food market, millets represent about 3.8%, while its share in the broader organic food market remains around 1.5%, reflecting expanding adoption among health-conscious consumers.
Government policies around millet promotion are reinforcing market expansion. India's National Year of Millets campaign, coupled with export facilitation under the National Programme for Organic Production (NPOP), is helping strengthen global trade. Programs like the National Food Security Mission (NFSM), Rashtriya Krishi Vikas Yojana (RKVY), and state-level millet missions are catalyzing farmer participation and acreage growth.
The recognition of millets as “Nutri-cereals” and their inclusion in mid-day meals and public distribution systems are fostering mainstream consumption. Additionally, international endorsements by the United Nations and supportive import policies in Europe and North America are accelerating global market penetration.
Japan is projected to be the fastest-growing market, expected to expand at a CAGR of 12.8% from 2025 to 2035. Pearl millet will lead the product segment with a 40% share, while breakfast cereals will dominate the end use application segment with a 25% share. The USA and Germany markets are expected to grow steadily at CAGRs of 11.5% and 12.2%, respectively. The UK and France are also projected to register robust growth, growing at CAGRs of 11.8% and 12.5%.
The global market is segmented by product, end use application, and region. By product, the market includes sorghum, pearl millet, finger millet, little millet, porso millet, kodo millet, foxtail millet, and barnyard millet.
In terms of end use application, the market spans bakery & confectionery, protein and nutritional bars, breakfast cereals, functional beverages, dairy alternatives, frozen desserts, dietary supplements, sports nutrition, infant nutrition, meat additives, analogs & substitutes, dressings, sauces & spreads, pharmaceutical products, personal care products, animal nutrition, animal feed, and aquaculture.
Regionally, the market is categorized into North America, Latin America, Europe, East Asia, South Asia, Oceania, and the Middle East & Africa.
Pearl millet is expected to lead the product segment with a 40% market share by 2025, driven by its high nutritional value, drought resistance, and adaptability across diverse agricultural and climatic regions. Its rich fiber, iron, and protein content supports functional food trends, while government initiatives promote its cultivation in arid and semi-arid zones.
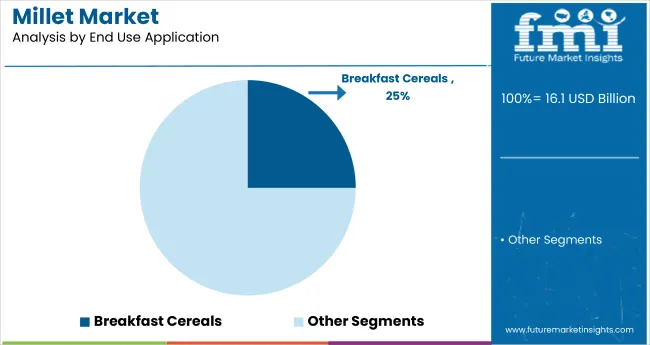
Breakfast cereals are projected to hold a 25% market share in 2025, driven by their gluten-free, high-fiber profile and rising demand among health-conscious consumers seeking clean-label, nutritious morning options. Innovations in multigrain blends, sugar reduction, and plant-based inclusions further strengthen their appeal across urban populations and fitness-focused demographics globally.
The global market is witnessing rapid growth, fueled by rising health awareness and increasing demand for gluten-free, nutrient-rich grains. Millets are gaining attention as climate-resilient crops that support sustainable agriculture and provide essential nutrients for both human and animal consumption.
Recent Trends in the Millet Market
Challenges in the Millet Market
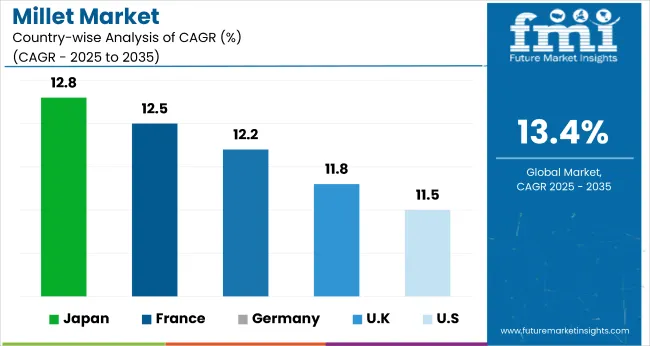
Japan’s market momentum is driven by functional food innovation, growing nutritional needs of its aging population, and government-backed efforts to diversify away from rice dependency. Germany and France sustain demand through organic food adoption and EU agricultural subsidies. Developed economies such as the USA (11.5% CAGR), UK (11.8% CAGR), and Japan (12.8% CAGR) are expected to grow at a steady 0.85-0.96x the global growth rate of 13.4%.
Japan shows the strongest growth momentum, supported by rising demand for functional beverages, elderly nutrition, and health-focused retail expansion. Germany follows closely, fueled by robust organic food consumption and clean-label product development. France benefits from policy-led agricultural diversification and increasing use of millet in infant nutrition and dietary supplements.
The USA market is projected to expand through growing demand for gluten-free foods, plant-based snacks, and sustainable farming practices. The UK continues to witness steady growth, driven by the popularity of ancient grains, a broader vegan product portfolio, and millet’s integration into cereals and bakery mixes within a post-Brexit food strategy framework.
The report covers an in-depth analysis of 40+ countries; five top-performing OECD countries are highlighted below.
The Japan millet market is projected to grow at a CAGR of 12.8% from 2025 to 2035. Growth is driven by the increasing use of millet in functional beverages, elderly care products, and high-fiber diets. With rising interest in plant-based nutrition, Japan emphasizes precision farming and value-added millet innovations. Millet is also being incorporated into both traditional cuisine and modern dietary applications.
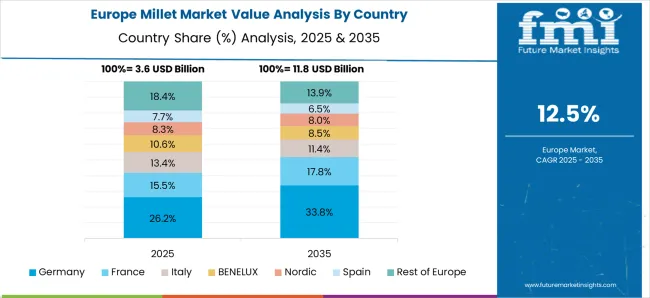
Sales of millet in Germany are expected to expand at a CAGR of 12.2% during the forecast period, slightly below the global average but strongly supported by growing demand for organic food. Germany’s organic farming policies and clean-label preferences are driving the adoption of millet-based products in bakery, cereals, and dietary supplements. Sustainability initiatives and rising consumer interest in ancient grains are also contributing to market growth.
The French millet market is projected to grow at a CAGR of 12.5% from 2025 to 2035, reflecting a policy-driven shift toward sustainable and nutrient-rich crops. Millet is increasingly incorporated into infant nutrition, gluten-free pastries, and dietary supplements. The country benefits from EU-backed agricultural innovation and food diversification strategies.
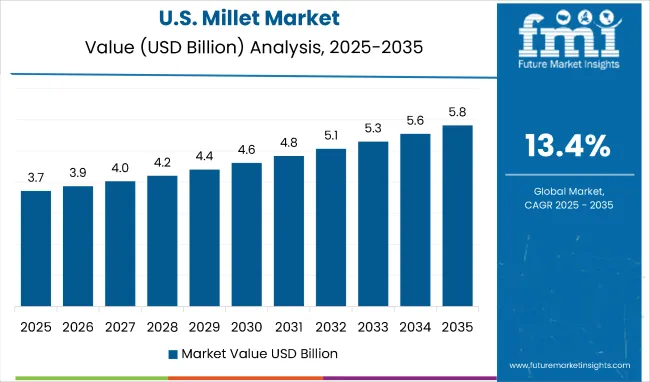
The USA millet market is projected to grow at a CAGR of 11.5% from 2025 to 2035, translating to 0.86x the global growth rate. Demand is driven by gluten-free food formulations, clean-label snacks, and health-conscious consumers. Millet is gaining presence in nutritional bars, bakery products, and ready-to-eat cereals. Farmers are increasingly exploring millet as a drought-resilient crop in low-rainfall regions.
The UK millet market is forecast to grow at a CAGR of 11.8% from 2025 to 2035, representing 0.88x the global growth rate. Demand is supported by the rising popularity of ancient grains and the expansion of vegan and gluten-free product categories. Post-Brexit food policy has shifted focus toward locally adapted, resilient crops like millet.
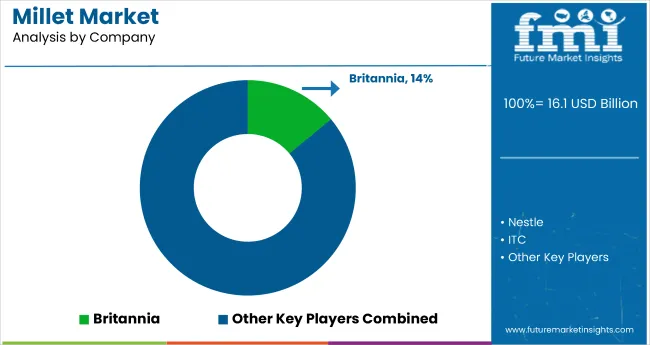
The global market is moderately fragmented, with key players like Britannia, Tata Soulfull, ITC, Nestlé, and Hindustan Unilever leading global and regional production. These companies offer millet-based products across various categories including breakfast cereals, snacks, beverages, and bakery goods. Britannia has expanded its millet presence through biscuits and health snacks, while Tata Soulfull focuses on millet-based ready-to-eat and ready-to-cook offerings.
ITC and Nestlé are investing in millet-based nutrition and instant food lines targeted at urban consumers, while Hindustan Unilever integrates millet ingredients into wellness-oriented product innovations. Other major contributors such as True Elements, Mayoora Foods, Navan Foods LLC, and Cargill Inc. are expanding their millet product portfolios across personal care, infant nutrition, and dietary supplement sectors to cater to a broader health-conscious audience.
Recent Millet Industry News
| Report Attributes | Details |
|---|---|
| Market Size (2025) | USD 16.1 billion |
| Projected Market Size (2035) | USD 56.7 billion |
| CAGR (2025 to 2035) | 13.4% |
| Base Year for Estimation | 2024 |
| Historical Period | 2020 to 2024 |
| Projections Period | 2025 to 2035 |
| Report Parameter | USD billion for value /volume in metric tons |
| Product Analyzed | Sorghum, Pearl Millet, Finger Millet, Little Millet, Porso Millet, Kodo Millet, Foxtail Millet, Barnyard Millet |
| End Use Application Analyzed | Bakery & Confectionery, Protein and Nutritional Bars, Breakfast Cereals, Functional Beverages, Dairy Alternatives, Frozen Desserts, Dietary Supplements, Sports Nutrition, Infant Nutrition, Meat Additives, Analogs & Substitutes, Dressings, Sauces & Spreads, Pharmaceutical Products, Personal Care Products, Animal Nutrition, Animal Feed, Aquaculture |
| Regions Covered | North America, Latin America, Europe, East Asia, South Asia, Oceania, Middle East and Africa |
| Countries Covered | United States, United Kingdom, Germany, France, Japan, China, India, Brazil, South Korea, Australia and 40+ countries |
| Key Players Influencing the Market | Britannia, Tata Soulfull, ITC, Nestlé, Hindustan Unilever, True Elements, Mayoora Foods, Navan Foods LLC, Cargill Inc., Sydler India Pvt. Ltd |
| Additional Attributes | Dollar sales by millet type, share by end use, regional demand trends, sales by distribution channel, pricing analysis, key supplier strategies, production volumes, trade flows, and clean-label claims adoption |
The global millet market is estimated to be valued at USD 16.1 billion in 2025.
The market size for the millet market is projected to reach USD 56.6 billion by 2035.
The millet market is expected to grow at a 13.4% CAGR between 2025 and 2035.
The key product types in millet market are sorghum, pearl millet, finger millet, little millet, porso millet, kodo millet, foxtail millet and barnyard millet.
In terms of end use, bakery & confectionery segment to command 42.3% share in the millet market in 2025.


Full Research Suite comprises of:
Market outlook & trends analysis
Interviews & case studies
Strategic recommendations
Vendor profiles & capabilities analysis
5-year forecasts
8 regions and 60+ country-level data splits
Market segment data splits
12 months of continuous data updates
DELIVERED AS:
PDF EXCEL ONLINE
Millet Flour Market Analysis by Pearl Millet, Finger Millet, Foxtail Millet, Proso Millet, Kodo Millet, and Others Through 2035

Thank you!
You will receive an email from our Business Development Manager. Please be sure to check your SPAM/JUNK folder too.
Chat With
MaRIA