

- Market Size (2026)
- USD 1.6 Bn
- Forecast (2036)
- USD 2.6 Bn
- CAGR (2026 to 2036)
- 4.9%
Miso Market Size, Market Forecast and Outlook By FMI
The miso market was valued at USD 77.0 billion in 2025. The market is set to reach USD 1.6 billion by 2026-end and grow at a CAGR of 4.9% between 2026-2036 to reach USD 2.6 billion by 2036. Red Miso will dominate with a 49.0% share, while Soybean will lead with a 53.0% share.
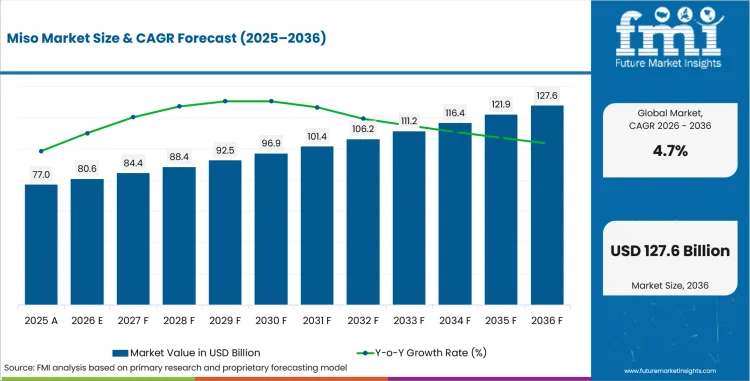
Key Takeaways, Market Size, and Forecast
- 2026 Market Size: USD 1.6 billion
- 2036 Market Size: USD 2.6 billion
- Compound Annual Growth Rate (CAGR): 4.9% from 2026 to 2036
- Absolute $ Opportunity: USD 47 billion between 2026 and 2036
- Leading Product Type Segment: Red Miso
- Red Miso Share in 2026: 49%
- Fastest-growing Country: India
- India CAGR: 5.8% through 2036
| Parameter | Details |
|---|---|
| Market Size in 2026 (Value) | USD 1.6 billion |
| Market Forecast in 2036 (Value) | USD 2.6 billion |
| Compound Annual Growth Rate (CAGR) | 4.9% from 2026 to 2036 |
| Years Considered | 2021 to 2036 |
| Base Year | 2025 |
| Forecast Period | 2026 to 2036 |
| Units Considered | Value (USD Bn) |
| Leading Sub-Region | India |
Summary of the Miso Market
- Demand and Growth Drivers
- Rising consumer interest in fermented foods and plant-based protein sources is supporting miso adoption in markets outside Japan, particularly across South Asia, East Asia, and Europe.
- Health-conscious consumption patterns favoring probiotic-rich, low-sodium condiment alternatives are generating demand for white miso and low-salt formulations in retail channels.
- Expansion of Japanese cuisine in global foodservice, including ramen and fusion dining formats, is sustaining commercial procurement of red miso and mixed miso products.
- Product and Segment View
- Red miso accounts for 49.0% of product type share in 2026, led by long-fermented and high-salt varieties used in soup bases, marinades, and traditional Japanese cuisine applications.
- Soups and broths lead application demand at 44.0%, reflecting daily household consumption in Japan and growing institutional foodservice procurement across East Asia and North America.
- Consumer end users hold 60.0% share, supported by retail distribution of packaged miso products through supermarkets, specialty Asian food stores, and online grocery platforms.
- Geography and Competitive Outlook
- India leads growth at 5.8% CAGR, reflecting expanding interest in fermented food products and organized retail distribution of Japanese condiments in urban markets.
- China and South Korea maintain above-average growth rates at 5.3% and 5.1% respectively, supported by cultural familiarity with fermented soy products and expanding modern retail channels.
- Established Japanese miso producers with fermentation expertise and traditional brand positioning are best positioned to capture export demand while defending domestic market share.
- Analyst Opinion
- Nandini Roy Choudhury, Principal Consultant at FMI says, 'Companies that can balance traditional fermentation expertise with modern retail distribution and product format diversification are likely to capture the expanding international demand for miso through 2036.'
- The miso market is transitioning from a Japan-centric condiment category toward a globally distributed fermented food ingredient with applications across soups, sauces, functional foods, and ready meals.
- Adoption is increasing due to consumer recognition of fermentation health benefits and the expansion of Asian cuisine in Western foodservice and retail formats.
- Demand is further supported by product format diversification, including instant miso soup, miso-based seasonings, and ready-to-use miso paste in convenient packaging.
Miso Market Definition
The miso market covers commercially produced fermented soybean paste products, including red miso, white miso, and mixed miso varieties, used as condiments, cooking ingredients, and functional food components. Miso is produced through the fermentation of soybeans with koji culture and salt, using rice, barley, or other grains as secondary raw materials.
Miso Market Inclusions
Market scope covers all commercially traded miso products segmented by product type (red miso, white miso, mixed miso), raw material (soybean, rice, barley, others), end user (consumer, food services), distribution channel (retail, wholesale), and application (soups and broths, sauces and seasonings, functional and health foods, snacks and ready meals). Revenue is tracked from 2026 to 2036.
Miso Market Exclusions
The scope does not include non-fermented soy paste products, soy sauce, fermented bean paste varieties that do not use koji culture, or miso-flavored snack products where miso is not the primary ingredient.
Miso Market Research Methodology
- Primary Research: FMI analysts conducted interviews with miso producers, fermented food distributors, and foodservice procurement managers across key markets.
- Desk Research: Combined data from Japanese food industry associations, fermented food consumption surveys, and retail sales databases.
- Market Sizing and Forecasting: Bottom-up aggregation across product types, distribution channels, and regional consumption patterns, with export volume tracking for international markets.
- Data Validation: Cross-checked against Japanese miso production statistics and international trade data on a quarterly basis.
Why is the Miso Market Growing?
- Consumer interest in fermented foods with probiotic health benefits is expanding the addressable market for miso beyond traditional Japanese cuisine applications in both retail and foodservice channels.
- Product format diversification into instant soups, miso-based seasonings, and convenient squeeze packaging is improving accessibility for consumers unfamiliar with traditional miso preparation methods.
The miso market is expanding at 4.9% CAGR from 2026 to 2036, supported by the global spread of Japanese cuisine, growing consumer preference for fermented and plant-based foods, and product format diversification that is making miso accessible to non-traditional consumer segments. Red miso remains the dominant product type at 49.0% share, favored for its rich umami flavor in soup, marinade, and glaze applications.
Soups and broths represent the largest application at 44.0% share, reflecting daily household consumption in Japan and expanding foodservice procurement globally. Sauces and seasonings are the fastest-growing application category, driven by fusion cuisine adoption and the use of miso as a umami-enhancing ingredient in non-Japanese cooking formats. Functional and health food applications are growing as consumers recognize the probiotic and plant-protein benefits of fermented soy products.
Retail distribution holds 60.0% channel share, with supermarkets, specialty Asian food stores, and online grocery platforms serving as primary consumer access points. Wholesale channels serve foodservice and institutional buyers, with bulk procurement concentrated among restaurant chains, hotel groups, and industrial kitchen operators.
Market Segmentation Analysis
- Red miso leads with 49.0% product type share, reflecting deep-rooted consumer preference for long-fermented, high-umami varieties across Japanese households and foodservice establishments.
- Soybean-based raw material accounts for 53.0% share, with non-GMO and organic soybean formulations gaining procurement priority among health-conscious consumer segments.
The miso market is segmented by product type, raw material, end user, distribution channel, and application. Product type and raw material determine flavor profile and pricing, while end user and distribution channel influence packaging format and procurement volumes. Application diversity reflects the transition of miso from a single-use condiment to a multi-functional culinary and functional food ingredient.
Insights into the Red Miso Segment
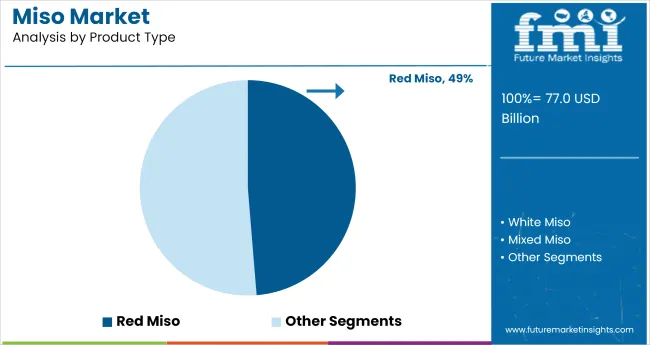
Red miso holds 49.0% product type share in 2026, with long-fermented and high-salt varieties commanding premium pricing in domestic Japanese markets and export channels. Long fermented red miso is preferred for traditional soup bases and rich-flavor cooking applications, while high-salt red miso serves commercial foodservice operations where shelf stability and flavor intensity are procurement priorities. Export demand for red miso is concentrated among Asian grocery distributors and Japanese restaurant supply chains in North America, Europe, and Oceania.
Insights into the Soups and Broths Application Segment
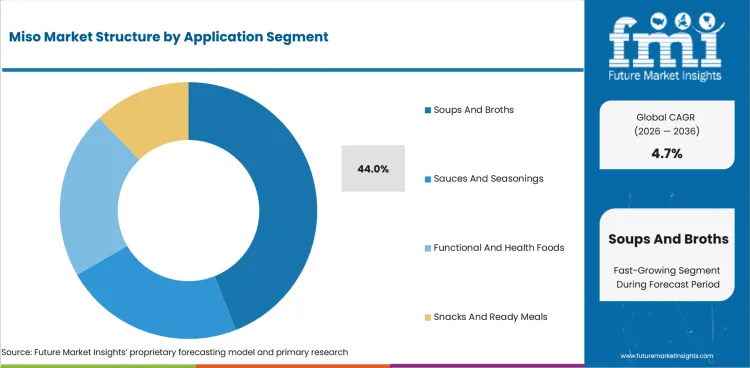
Soups and broths represent 44.0% of application share, reflecting daily household miso soup consumption in Japan and growing institutional foodservice procurement of miso soup bases across East Asia and North America. Traditional miso soup bases serve authentic Japanese cuisine applications, while instant soup formulations are driving volume growth in convenience-oriented retail channels. Ready-to-prepare miso soup products with single-serve packaging are expanding consumer accessibility in markets where miso is a newer dietary category.
Miso Market Drivers, Restraints, and Opportunities
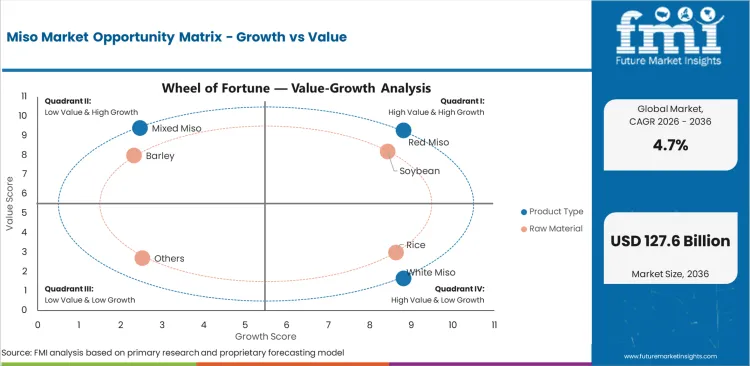
- Global expansion of Japanese cuisine and fermented food consumption trends are broadening the addressable market for miso beyond its traditional Japanese consumer base.
- Sodium content concerns and competition from other fermented condiments are constraining growth in health-focused consumer segments that prioritize low-sodium dietary patterns.
- Product format diversification into convenient, ready-to-use packaging is reducing preparation barriers and expanding consumer trial rates in non-Asian markets.
The miso market is growing on the basis of Japanese cuisine globalization, fermented food health awareness, and product format diversification. Sodium perception challenges and competition from alternative fermented condiments create constraints in specific consumer segments.
Japanese Cuisine Globalization
The proliferation of ramen shops, izakaya-style restaurants, and Japanese fusion dining across North America, Europe, and Southeast Asia is generating sustained foodservice procurement for miso products. This commercial demand creates awareness that subsequently supports retail adoption as consumers seek to replicate restaurant-quality flavors at home.
Sodium Perception Constraints
Traditional miso carries relatively high sodium content, which constrains adoption among health-focused consumers in Western markets. Low-salt miso formulations are addressing this barrier, but reduced-sodium products represent a smaller share of production and command different pricing dynamics compared to traditional varieties.
Convenient Format Diversification
Single-serve instant miso soup packets, squeeze-tube miso paste, and miso-based cooking sauces are reducing preparation complexity and expanding consumer trial. These formats are particularly effective in markets where miso is an unfamiliar ingredient, lowering the barrier between initial awareness and regular purchase behavior.
Analysis of Miso Market By Key Countries
.webp "Top Country Growth Comparison Miso Market Cagr (2026 2036)")
| Country | CAGR |
|---|---|
| India | 5.8% |
| China | 5.3% |
| South Korea | 5.1% |
| Japan | 4.8% |
| UK | 4.4% |
| Germany | 4.1% |
| USA | 3.9% |
Source: FMI analysis based on primary research and proprietary forecasting model
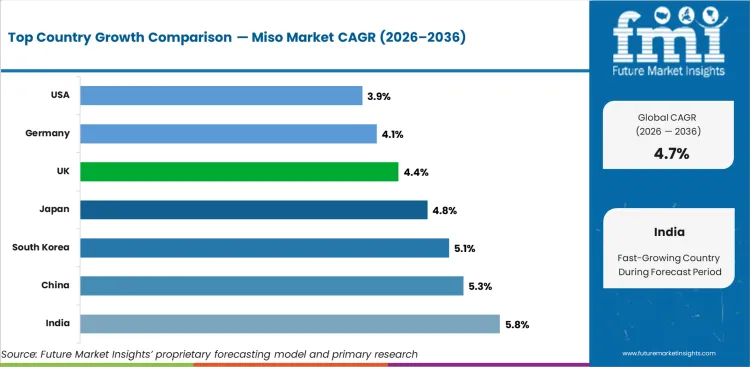
- India leads at 5.8% CAGR, reflecting rapid growth in organized retail distribution of fermented food products and expanding urban consumer interest in Japanese cuisine.
- China at 5.3% is supported by cultural familiarity with fermented soy products and expanding modern supermarket channels that provide shelf space for imported and domestic miso brands.
- Japan at 4.8% maintains the largest absolute market size, with mature household consumption patterns and an established foodservice procurement base.
The global miso market is projected to expand at 4.9% CAGR from 2026 to 2036. The analysis covers more than 30 countries, with the primary markets detailed below.
Demand Outlook for Miso Market in India
Demand is concentrated in metropolitan cities where organized retail expansion is creating shelf space for imported Japanese food products. India is growing at 5.8% through 2036, with tier-2 city distribution of Asian condiments expanding through e-commerce channels and modern trade formats.
- Urbanization and rising disposable incomes are supporting consumer trial of Japanese and Korean food products through specialty retail and online grocery platforms.
- E-commerce food delivery platforms are introducing miso-based soup and seasoning products to consumers in cities without established Asian grocery retail infrastructure.
- Organized retail chains are expanding Japanese condiment shelf space as part of broader international cuisine category development strategies.
Future Outlook for Miso Market in China
China's large consumer base and cultural familiarity with fermented soy products support 5.3% growth through 2036. E-commerce logistics platforms are expanding distribution of both imported Japanese miso brands and domestic miso producers to consumers across first-tier and second-tier cities.
- Domestic miso production benefits from cost advantages in soybean sourcing and fermentation infrastructure compared to imported Japanese products.
- E-commerce food platforms are enabling direct-to-consumer distribution for premium miso products that previously relied on specialty import channels.
- Food delivery and ready-meal services are integrating miso-based soup and seasoning products into their menu options, expanding commercial procurement.
Opportunity Analysis of Miso Market in South Korea
Government support for fermented food industry development and MFDS food standards are shaping procurement at 5.1% growth through 2036. South Korea has deep cultural familiarity with fermented soy condiments, creating a receptive market for Japanese miso products alongside domestic doenjang.
- MFDS food safety standards provide a regulatory framework that supports consumer confidence in fermented soy product quality and safety.
- Cross-cultural familiarity with fermented soy products creates a lower adoption barrier for miso compared to markets without established fermented condiment traditions.
- Smart manufacturing and food processing investment are supporting domestic miso production capacity and product format diversification.
In-depth Analysis of Miso Market in Japan
The installed base of miso consumption is mature, with 4.8% growth through 2036 reflecting population aging, household size reduction, and the shift toward convenient single-serve formats. PMDA and JIS compliance requirements maintain product quality standards that support premium positioning for traditional miso manufacturers.
- Aging population demographics and declining household sizes are shifting procurement toward smaller packaging formats and single-serve instant miso products.
- Keiretsu distribution networks and long-standing retailer relationships create structural advantages for established miso producers like Marukome and Hikari Miso.
- Export development programs supported by Japanese government trade promotion agencies are expanding international market access for domestic miso producers.
Sales Analysis of Miso Market in the United Kingdom
Post-Brexit food labeling regulations and retailer sustainability targets are influencing miso product packaging and sourcing standards in the UK market at 4.4% growth through 2036. Expansion of Japanese dining formats in London, Manchester, and other metropolitan centers is supporting both foodservice and retail miso procurement.
- UK Plastics Tax and post-Brexit packaging regulations are influencing miso product packaging design and material sourcing requirements.
- Retailer sustainability commitments are favoring miso producers that can demonstrate traceable soybean sourcing and environmentally responsible fermentation practices.
- Growth of Japanese restaurant formats in UK cities is creating foodservice procurement demand that subsequently supports retail consumer adoption.
Opportunity Analysis of Miso Market in Germany
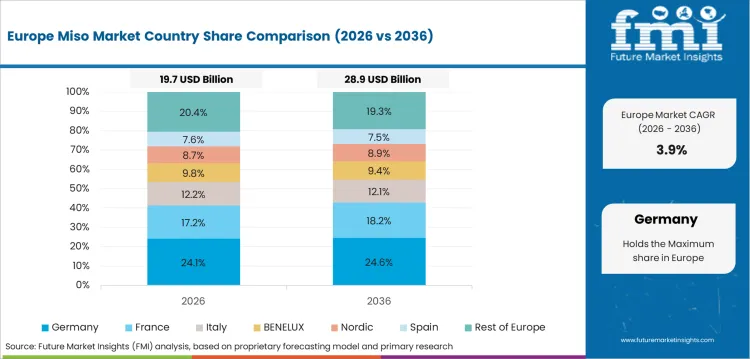
EU packaging regulations and EPR frameworks are influencing miso product presentation at 4.1% growth through 2036. German organic food retail channels provide strong distribution access for organic and non-GMO miso products, while retailer consolidation creates procurement efficiencies for established miso brands.
- EU Ecodesign Regulation and EPR requirements are shaping packaging standards for miso products sold through German retail channels.
- Strong organic food retail infrastructure in Germany provides premium distribution channels for certified organic miso products.
- Retailer consolidation among German grocery chains creates centralized procurement opportunities for miso producers that can meet volume and compliance requirements.
In-depth Analysis of Miso Market in the United States
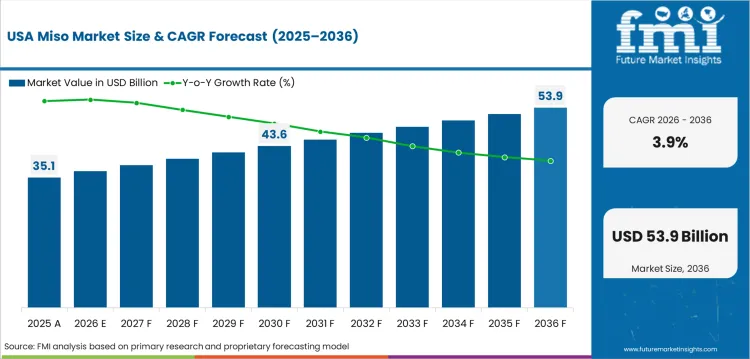
The US market is growing at 3.9% through 2036, supported by the expansion of Japanese cuisine in foodservice, health-conscious consumer interest in fermented foods, and the growth of plant-based dietary patterns that favor soy-based condiments. Sustainability mandates from major retailers are influencing miso packaging and sourcing standards.
- Sustainability mandates from major US retailers are requiring miso producers to demonstrate environmentally responsible sourcing and packaging practices.
- Consumer interest in probiotic and fermented food products is supporting miso retail sales through natural and organic grocery channels.
- Expansion of Japanese and ramen restaurant formats across US metropolitan areas is building consumer familiarity that translates into retail purchase behavior.
Competitive Landscape and Strategic Positioning
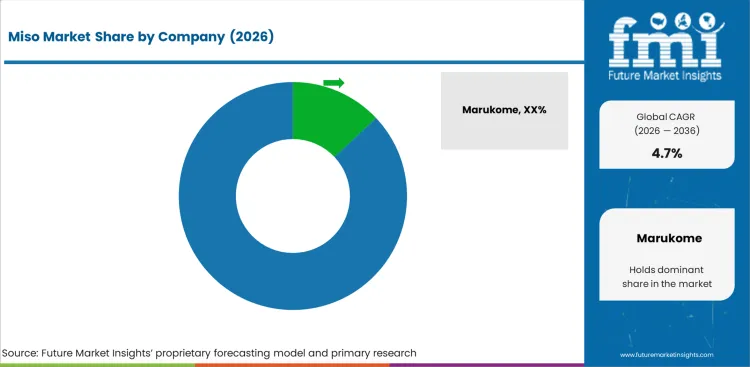
- Marukome leads through its dominant position in Japanese domestic miso production, broad product portfolio, and expanding international distribution capabilities.
- Hikari Miso Co. Ltd. and Saikyo-Miso Co. compete on product specialization and brand heritage in premium and white miso categories.
- International distributors like Clearspring Ltd. and Miyako Oriental Foods serve as critical export channel partners for Japanese producers accessing Western markets.
Marukome maintains market leadership through its broad product line spanning red, white, and mixed miso categories, combined with the largest domestic production capacity in Japan. The company has invested in international market development, including localized packaging and marketing for North American and European retail channels.
Hikari Miso Co. Ltd. and Yamato Soysauce & Miso Co. compete on traditional fermentation expertise, offering long-fermented premium miso products that command higher retail pricing. Saikyo-Miso Co. holds a strong position in the white miso category, serving both domestic and export markets.
Clearspring Ltd. and Miyako Oriental Foods Inc. serve as key international distribution partners, building retail presence for Japanese miso brands in European and North American markets. Ohsawa Japan and Muso Co., Ltd. are positioned in organic and traditional miso categories.
Barriers include the extended fermentation cycles required for premium miso production, established brand loyalty among Japanese consumers, distribution network access in international markets, and regulatory compliance for fermented food products across different jurisdictions. Strategic priorities include international market expansion, convenient format development, and organic product line extension.
Key Companies in the Miso Market
Key global companies leading the miso market include:
- Marukome (Japan), Hikari Miso Co. Ltd. (Japan), and Yamato Soysauce & Miso Co. (Japan) hold dominant domestic positions with broad product portfolios and established retail distribution.
- Saikyo-Miso Co. (Japan), IyasakaJozo Co. (Japan), and Source Foods (USA) serve specialized product categories and regional export markets with differentiated miso formulations.
- Clearspring Ltd. (UK), Miyako Oriental Foods Inc. (USA), Ohsawa Japan (Japan), and Muso Co., Ltd. (Japan) are building international distribution networks for Japanese miso products in Western retail and foodservice channels.
Competitive Benchmarking: Miso Market
| Company | Product Range | Fermentation Expertise | International Distribution | Brand Recognition |
|---|---|---|---|---|
| Marukome | High | High | Strong | High |
| Hikari Miso Co. Ltd. | High | High | Moderate | High |
| Saikyo-Miso Co. | Medium | High | Moderate | Medium |
| Yamato Soysauce & Miso Co. | Medium | High | Low | Medium |
| IyasakaJozo Co. | Medium | Medium | Low | Medium |
| Miyako Oriental Foods | Medium | Medium | Strong | Medium |
| Clearspring Ltd. | Medium | Low | Strong | Medium |
| Source Foods | Low | Medium | Moderate | Low |
| Ohsawa Japan | Low | High | Moderate | Low |
| Muso Co., Ltd. | Low | High | Moderate | Low |
Source: Future Market Insights competitive analysis, 2026.
Key Developments in Miso Market
- In 2025, Marukome expanded its production capacity for instant miso soup products targeting North American and European retail markets.
- In 2025, Hikari Miso launched a reduced-sodium miso line for health-conscious consumers in Japanese and international markets.
Key Players in the Miso Market
Major Global Players
- Marukome
- Hikari Miso Co. Ltd.
- Saikyo-Miso Co.
- Yamato Soysauce & Miso Co.
- Miyako Oriental Foods Inc.
Emerging Players/Startups
- IyasakaJozo Co.
- Source Foods
- Clearspring Ltd.
- Ohsawa Japan
- Muso Co., Ltd.
Report Scope and Coverage
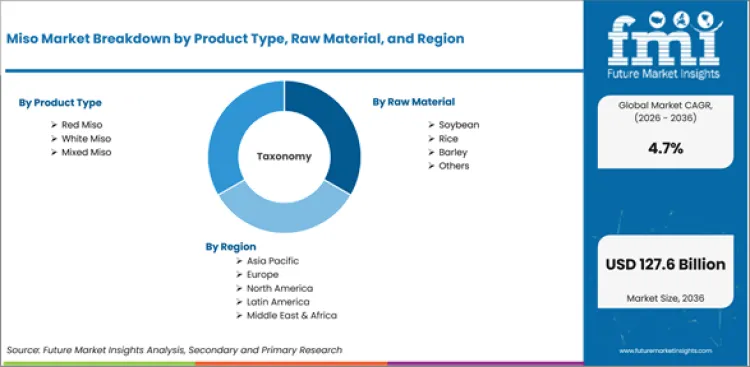
| Parameter | Details |
|---|---|
| Market size by 2036 | USD 2.6 billion |
| Growth rate | 4.9% CAGR (2026 to 2036) |
| Forecast period | 2026 to 2036 |
| Base year value (2025) | USD 77.0 billion |
| Key Segment Covered | Product Type, Raw Material, End User, Distribution Channel, Application |
| Regions covered | North America, Latin America, Europe, East Asia, South Asia and Pacific, Middle East and Africa |
| Countries covered | USA, South Korea, UK, Japan, China, India, Germany, 30 plus countries |
| Key companies profiled | Marukome, Hikari Miso Co. Ltd., Saikyo-Miso Co., Yamato Soysauce & Miso Co., Miyako Oriental Foods Inc., IyasakaJozo Co., Source Foods, Clearspring Ltd., Ohsawa Japan, Muso Co., Ltd. |
| Approach | Hybrid bottom-up and top-down methodology starting with verified transaction data, projecting adoption velocity across segments and regions. |
Miso Market Segmentation
Miso Market Segmented by Product Type:
- Red Miso
- Long Fermented Red Miso
- Rich Umami Flavor Applications
- Traditional Japanese Cuisine
- High Salt Red Miso
- Soup And Marinade Uses
- Foodservice Applications
- Long Fermented Red Miso
- White Miso
- Sweet White Miso
- Mild Flavor Formulations
- Salad Dressing Applications
- Low Salt White Miso
- Health Focused Food Products
- Functional Culinary Uses
- Sweet White Miso
- Mixed Miso
- Awase Miso Blends
- Balanced Flavor Profiles
- Household Cooking Applications
- Custom Mixed Miso Products
- Premium Culinary Solutions
- Ready To Use Food Applications
- Awase Miso Blends
Miso Market Segmented by Raw Material:
- Soybean
- Organic Soybean Miso
- Traditional Fermentation Applications
- Protein Rich Food Products
- Non GMO Soybean Formulations
- Clean Label Ingredient Uses
- Functional Food Applications
- Organic Soybean Miso
- Rice
- Rice Koji Miso
- Sweet Flavor Development
- Soup And Sauce Applications
- Glutinous Rice Fermentation
- Premium Miso Products
- Traditional Japanese Foods
- Rice Koji Miso
- Barley
- Barley Miso Formulations
- Rich Aroma Development
- Artisan Miso Products
- Whole Grain Barley Miso
- High Fiber Food Applications
- Healthy Culinary Products
- Barley Miso Formulations
- Others
- Chickpea Based Miso
- Soy Free Alternative Products
- Gluten Free Applications
- Multigrain Fermented Miso
- Innovative Functional Foods
- Specialty Culinary Products
- Chickpea Based Miso
Miso Market Segmented by End User:
- Consumer
- Household Cooking Applications
- Daily Soup And Seasoning Uses
- Healthy Home Meal Preparation
- Health Conscious Consumers
- Fermented Functional Food Consumption
- Plant Based Dietary Applications
- Household Cooking Applications
- Food Services
- Restaurants And Cafés
- Authentic Japanese Cuisine Applications
- Soup And Broth Preparation
- Industrial Foodservice Kitchens
- Bulk Ingredient Procurement
- Fusion Cuisine Development
- Restaurants And Cafés
Miso Market Segmented by Distribution Channel:
- Retail
- Supermarkets And Hypermarkets
- Packaged Miso Product Sales
- Mass Consumer Accessibility
- Specialty Asian Food Stores
- Premium Fermented Food Products
- Health And Wellness Retail
- Supermarkets And Hypermarkets
- Wholesale
- Bulk Food Ingredient Supply
- Restaurant And Foodservice Distribution
- Industrial Procurement Applications
- Regional Wholesale Networks
- Traditional Grocery Distribution
- Large Scale Food Manufacturing
- Bulk Food Ingredient Supply
Miso Market Segmented by Application:
- Soups And Broths
- Traditional Miso Soup Bases
- Authentic Japanese Cuisine Applications
- Daily Household Consumption
- Instant Soup Formulations
- Convenient Ready To Prepare Products
- Foodservice Menu Integration
- Traditional Miso Soup Bases
- Sauces And Seasonings
- Marinades And Glazes
- Umami Flavor Enhancement
- Fusion Cuisine Applications
- Miso Based Condiments
- Cooking Paste Formulations
- Ready To Use Culinary Products
- Marinades And Glazes
- Functional And Health Foods
- Probiotic Rich Food Products
- Digestive Health Support
- Fermented Functional Nutrition
- Plant Based Wellness Foods
- Clean Label Applications
- Healthy Lifestyle Products
- Probiotic Rich Food Products
- Snacks And Ready Meals
- Miso Flavored Snacks
- Healthy Savory Snack Products
- Innovative Flavor Applications
- Ready To Eat Meals
- Convenient Asian Cuisine Products
- Frozen And Chilled Meal Integration
- Miso Flavored Snacks
Miso Market by Region:
- North America
- USA
- Canada
- Mexico
- Latin America
- Brazil
- Chile
- Rest of Latin America
- Western Europe
- Germany
- UK
- Italy
- Spain
- France
- Nordic
- BENELUX
- Rest of Western Europe
- Eastern Europe
- Russia
- Poland
- Hungary
- Balkan & Baltic
- Rest of Eastern Europe
- East Asia
- China
- Japan
- South Korea
- South Asia and Pacific
- India
- ASEAN
- Australia & New Zealand
- Rest of South Asia and Pacific
- Middle East & Africa
- Kingdom of Saudi Arabia
- Other GCC Countries
- Türkiye
- South Africa
- Other African Union
- Rest of Middle East & Africa
Research Sources and Bibliography
- 1. Ministry of Agriculture, Forestry and Fisheries, Japan. (2025). MAFF Annual Report on Fermented Food Production Statistics. MAFF.
- 2. Food and Agriculture Organization. (2025). FAO Global Fermented Food Consumption Database. FAO.
- 3. Codex Alimentarius Commission. (2025). Codex Standards for Fermented Soy Products. Codex.
- 4. Japan External Trade Organization. (2025). JETRO Japanese Food Export Statistics. JETRO.
- 5. European Food Safety Authority. (2025). EFSA Assessment of Fermented Food Safety Standards. EFSA.
This bibliography is provided for reader reference.
This Report Answers
- Estimating the size of the market and projected revenue from 2026 to 2036.
- Segmentation by product type, raw material, end user, distribution channel, and application.
- Insights about more than 30 markets in the region.
- Analysis of product type that includes red miso, white miso, and mixed miso.
- Assessment of the competitive landscape.
- Finding investment opportunities across foodservice, retail, and functional food channels.
- Keeping track of the supply chain.
- Delivery of data in PDF and Excel formats.
Frequently Asked Questions
How big is the miso market in 2026?
The global miso market is estimated to be valued at USD 1.6 billion in 2026.
What will be the size of miso market in 2036?
The market size for the miso market is projected to reach USD 2.6 billion by 2036.
How much will be the miso market growth between 2026 and 2036?
The miso market is expected to grow at a 4.9 % CAGR between 2026 and 2036.
What are the key product types in the miso market?
The key product types in the miso market are Red Miso, White Miso and Mixed Miso.
Which raw material segment is expected to contribute significant share in the miso market in 2026?
In terms of raw material, soybean segment is expected to command 53.0% share in the miso market in 2026.
Preview the report firsthand - request a free sample
Get SampleGet the brochure for pricing and purchase details.
Get PDFTable of Content
- Key Takeaways
- Market Size and CAGR
- Top Growth Driver
- Fastest Growing Segment
- Leading Region
- Key Companies
- Emerging Opportunities
- Executive Summary
- Global Market Outlook
- Demand-side Trends
- Supply-side Trends
- Technology Roadmap Analysis
- Analysis and Recommendations
- Analyst Perspective (What is happening? Why now? What should investors know?)
- Key Questions Answered
- How large is the market?
- What is the CAGR?
- What are key trends?
- Which region dominates?
- Who are the leaders?
- Market Overview
- Market Coverage / Taxonomy
- Market Definition / Scope / Limitations
- Research Methodology
- Chapter Orientation
- Analytical Lens and Working Hypotheses
- Market Structure, Signals, and Trend Drivers
- Benchmarking and Cross-market Comparability
- Market Sizing, Forecasting, and Opportunity Mapping
- Research Design and Evidence Framework
- Desk Research Programme (Secondary Evidence)
- Expert Input and Fieldwork (Primary Evidence)
- Tooling, Models, and Reference Databases
- Data Engineering and Model Build
- Quality Assurance and Audit Trail
- Market Background
- Market Dynamics (Drivers, Restraints, Opportunity, Trends)
- Scenario Forecast (Optimistic, Likely, Conservative)
- Impact Analysis
- AI Impact
- Sustainability Impact
- Regulatory Impact
- Technology Impact
- Consumer / Buyer Analysis
- Purchase Drivers
- Adoption Barriers
- Buyer Journey
- Opportunity Map Analysis
- Product Life Cycle Analysis
- Supply Chain Analysis
- Investment Feasibility Matrix
- Value Chain Analysis
- PESTLE and Porter's Analysis
- Regulatory Landscape
- Regional Parent Market Outlook
- Production and Consumption Statistics
- Import and Export Statistics
- Global Market Analysis and Forecast, 2021 to 2036
- Historical Market Size Value (USD Million) Analysis, 2021 to 2025
- Current and Future Market Size Value (USD Million) Projections, 2026 to 2036
- Y-o-Y Growth Trend Analysis
- Absolute $ Opportunity Analysis
- Global Market Pricing Analysis, 2021 to 2036
- Global Market Analysis and Forecast, By Product Type, 2021 to 2036
- Introduction / Key Findings
- Historical Market Size Value (USD Million) Analysis By Product Type, 2021 to 2025
- Current and Future Market Size Value (USD Million) Analysis and Forecast By Product Type, 2026 to 2036
- Red Miso
- Long Fermented Red Miso
- High Salt Red Miso
- White Miso
- Sweet White Miso
- Low Salt White Miso
- Mixed Miso
- Awase Miso Blends
- Custom Mixed Miso Products
- Red Miso
- Y-o-Y Growth Trend Analysis By Product Type, 2021 to 2025
- Absolute $ Opportunity Analysis By Product Type, 2026 to 2036
- Global Market Analysis and Forecast, By Raw Material, 2021 to 2036
- Introduction / Key Findings
- Historical Market Size Value (USD Million) Analysis By Raw Material, 2021 to 2025
- Current and Future Market Size Value (USD Million) Analysis and Forecast By Raw Material, 2026 to 2036
- Soybean
- Organic Soybean Miso
- Non GMO Soybean Formulations
- Rice
- Rice Koji Miso
- Glutinous Rice Fermentation
- Barley
- Barley Miso Formulations
- Whole Grain Barley Miso
- Others
- Chickpea Based Miso
- Multigrain Fermented Miso
- Soybean
- Y-o-Y Growth Trend Analysis By Raw Material, 2021 to 2025
- Absolute $ Opportunity Analysis By Raw Material, 2026 to 2036
- Global Market Analysis and Forecast, By End User, 2021 to 2036
- Introduction / Key Findings
- Historical Market Size Value (USD Million) Analysis By End User, 2021 to 2025
- Current and Future Market Size Value (USD Million) Analysis and Forecast By End User, 2026 to 2036
- Consumer
- Household Cooking Applications
- Health Conscious Consumers
- Food Services
- Restaurants And Cafés
- Industrial Foodservice Kitchens
- Consumer
- Y-o-Y Growth Trend Analysis By End User, 2021 to 2025
- Absolute $ Opportunity Analysis By End User, 2026 to 2036
- Global Market Analysis and Forecast, By Distribution Channel, 2021 to 2036
- Introduction / Key Findings
- Historical Market Size Value (USD Million) Analysis By Distribution Channel, 2021 to 2025
- Current and Future Market Size Value (USD Million) Analysis and Forecast By Distribution Channel, 2026 to 2036
- Retail
- Supermarkets And Hypermarkets
- Specialty Asian Food Stores
- Wholesale
- Bulk Food Ingredient Supply
- Regional Wholesale Networks
- Retail
- Y-o-Y Growth Trend Analysis By Distribution Channel, 2021 to 2025
- Absolute $ Opportunity Analysis By Distribution Channel, 2026 to 2036
- Global Market Analysis and Forecast, By Application, 2021 to 2036
- Introduction / Key Findings
- Historical Market Size Value (USD Million) Analysis By Application, 2021 to 2025
- Current and Future Market Size Value (USD Million) Analysis and Forecast By Application, 2026 to 2036
- Soups And Broths
- Traditional Miso Soup Bases
- Instant Soup Formulations
- Sauces And Seasonings
- Marinades And Glazes
- Miso Based Condiments
- Functional And Health Foods
- Probiotic Rich Food Products
- Plant Based Wellness Foods
- Snacks And Ready Meals
- Miso Flavored Snacks
- Ready To Eat Meals
- Soups And Broths
- Y-o-Y Growth Trend Analysis By Application, 2021 to 2025
- Absolute $ Opportunity Analysis By Application, 2026 to 2036
- Global Market Analysis and Forecast, By Region, 2021 to 2036
- Introduction
- Historical Market Size Value (USD Million) Analysis By Region, 2021 to 2025
- Current Market Size Value (USD Million) Analysis and Forecast By Region, 2026 to 2036
- North America
- Latin America
- Western Europe
- Eastern Europe
- East Asia
- South Asia and Pacific
- Middle East & Africa
- Market Attractiveness Analysis By Region
- North America Market Analysis and Forecast, By Country, 2021 to 2036
- Historical Market Size Value (USD Million) Trend Analysis By Market Taxonomy, 2021 to 2025
- Market Size Value (USD Million) Forecast By Market Taxonomy, 2026 to 2036
- By Country
- USA
- Canada
- Mexico
- By Product Type
- By Raw Material
- By End User
- By Distribution Channel
- By Application
- By Country
- Market Attractiveness Analysis
- By Country
- By Product Type
- By Raw Material
- By End User
- By Distribution Channel
- By Application
- Key Takeaways
- Latin America Market Analysis and Forecast, By Country
- Historical Market Size Value (USD Million) Trend Analysis By Market Taxonomy, 2021 to 2025
- Market Size Value (USD Million) Forecast By Market Taxonomy, 2026 to 2036
- By Country
- Brazil
- Chile
- Rest of Latin America
- By Product Type
- By Raw Material
- By End User
- By Distribution Channel
- By Application
- By Country
- Market Attractiveness Analysis
- By Country
- By Product Type
- By Raw Material
- By End User
- By Distribution Channel
- By Application
- Key Takeaways
- Western Europe Market Analysis and Forecast, By Country
- Historical Market Size Value (USD Million) Trend Analysis By Market Taxonomy, 2021 to 2025
- Market Size Value (USD Million) Forecast By Market Taxonomy, 2026 to 2036
- By Country
- Germany
- UK
- Italy
- Spain
- France
- Nordic
- BENELUX
- Rest of Western Europe
- By Product Type
- By Raw Material
- By End User
- By Distribution Channel
- By Application
- By Country
- Market Attractiveness Analysis
- By Country
- By Product Type
- By Raw Material
- By End User
- By Distribution Channel
- By Application
- Key Takeaways
- Eastern Europe Market Analysis and Forecast, By Country
- Historical Market Size Value (USD Million) Trend Analysis By Market Taxonomy, 2021 to 2025
- Market Size Value (USD Million) Forecast By Market Taxonomy, 2026 to 2036
- By Country
- Russia
- Poland
- Hungary
- Balkan & Baltic
- Rest of Eastern Europe
- By Product Type
- By Raw Material
- By End User
- By Distribution Channel
- By Application
- By Country
- Market Attractiveness Analysis
- By Country
- By Product Type
- By Raw Material
- By End User
- By Distribution Channel
- By Application
- Key Takeaways
- East Asia Market Analysis and Forecast, By Country
- Historical Market Size Value (USD Million) Trend Analysis By Market Taxonomy, 2021 to 2025
- Market Size Value (USD Million) Forecast By Market Taxonomy, 2026 to 2036
- By Country
- China
- Japan
- South Korea
- By Product Type
- By Raw Material
- By End User
- By Distribution Channel
- By Application
- By Country
- Market Attractiveness Analysis
- By Country
- By Product Type
- By Raw Material
- By End User
- By Distribution Channel
- By Application
- Key Takeaways
- South Asia and Pacific Market Analysis and Forecast, By Country
- Historical Market Size Value (USD Million) Trend Analysis By Market Taxonomy, 2021 to 2025
- Market Size Value (USD Million) Forecast By Market Taxonomy, 2026 to 2036
- By Country
- India
- ASEAN
- Australia & New Zealand
- Rest of South Asia and Pacific
- By Product Type
- By Raw Material
- By End User
- By Distribution Channel
- By Application
- By Country
- Market Attractiveness Analysis
- By Country
- By Product Type
- By Raw Material
- By End User
- By Distribution Channel
- By Application
- Key Takeaways
- Middle East & Africa Market Analysis and Forecast, By Country
- Historical Market Size Value (USD Million) Trend Analysis By Market Taxonomy, 2021 to 2025
- Market Size Value (USD Million) Forecast By Market Taxonomy, 2026 to 2036
- By Country
- Kingdom of Saudi Arabia
- Other GCC Countries
- Türkiye
- South Africa
- Other African Union
- Rest of Middle East & Africa
- By Product Type
- By Raw Material
- By End User
- By Distribution Channel
- By Application
- By Country
- Market Attractiveness Analysis
- By Country
- By Product Type
- By Raw Material
- By End User
- By Distribution Channel
- By Application
- Key Takeaways
- Key Countries Market Analysis
- USA
- Pricing Analysis
- Market Share Analysis, 2025
- By Product Type
- By Raw Material
- By End User
- By Distribution Channel
- By Application
- Canada
- Pricing Analysis
- Market Share Analysis, 2025
- By Product Type
- By Raw Material
- By End User
- By Distribution Channel
- By Application
- Mexico
- Pricing Analysis
- Market Share Analysis, 2025
- By Product Type
- By Raw Material
- By End User
- By Distribution Channel
- By Application
- Brazil
- Pricing Analysis
- Market Share Analysis, 2025
- By Product Type
- By Raw Material
- By End User
- By Distribution Channel
- By Application
- Chile
- Pricing Analysis
- Market Share Analysis, 2025
- By Product Type
- By Raw Material
- By End User
- By Distribution Channel
- By Application
- Germany
- Pricing Analysis
- Market Share Analysis, 2025
- By Product Type
- By Raw Material
- By End User
- By Distribution Channel
- By Application
- UK
- Pricing Analysis
- Market Share Analysis, 2025
- By Product Type
- By Raw Material
- By End User
- By Distribution Channel
- By Application
- Italy
- Pricing Analysis
- Market Share Analysis, 2025
- By Product Type
- By Raw Material
- By End User
- By Distribution Channel
- By Application
- Spain
- Pricing Analysis
- Market Share Analysis, 2025
- By Product Type
- By Raw Material
- By End User
- By Distribution Channel
- By Application
- France
- Pricing Analysis
- Market Share Analysis, 2025
- By Product Type
- By Raw Material
- By End User
- By Distribution Channel
- By Application
- India
- Pricing Analysis
- Market Share Analysis, 2025
- By Product Type
- By Raw Material
- By End User
- By Distribution Channel
- By Application
- ASEAN
- Pricing Analysis
- Market Share Analysis, 2025
- By Product Type
- By Raw Material
- By End User
- By Distribution Channel
- By Application
- Australia & New Zealand
- Pricing Analysis
- Market Share Analysis, 2025
- By Product Type
- By Raw Material
- By End User
- By Distribution Channel
- By Application
- China
- Pricing Analysis
- Market Share Analysis, 2025
- By Product Type
- By Raw Material
- By End User
- By Distribution Channel
- By Application
- Japan
- Pricing Analysis
- Market Share Analysis, 2025
- By Product Type
- By Raw Material
- By End User
- By Distribution Channel
- By Application
- South Korea
- Pricing Analysis
- Market Share Analysis, 2025
- By Product Type
- By Raw Material
- By End User
- By Distribution Channel
- By Application
- Russia
- Pricing Analysis
- Market Share Analysis, 2025
- By Product Type
- By Raw Material
- By End User
- By Distribution Channel
- By Application
- Poland
- Pricing Analysis
- Market Share Analysis, 2025
- By Product Type
- By Raw Material
- By End User
- By Distribution Channel
- By Application
- Hungary
- Pricing Analysis
- Market Share Analysis, 2025
- By Product Type
- By Raw Material
- By End User
- By Distribution Channel
- By Application
- Kingdom of Saudi Arabia
- Pricing Analysis
- Market Share Analysis, 2025
- By Product Type
- By Raw Material
- By End User
- By Distribution Channel
- By Application
- Türkiye
- Pricing Analysis
- Market Share Analysis, 2025
- By Product Type
- By Raw Material
- By End User
- By Distribution Channel
- By Application
- South Africa
- Pricing Analysis
- Market Share Analysis, 2025
- By Product Type
- By Raw Material
- By End User
- By Distribution Channel
- By Application
- USA
- Market Structure Analysis
- Competition Dashboard
- Competition Benchmarking
- Market Share Analysis of Top Players
- By Regional
- By Product Type
- By Raw Material
- By End User
- By Distribution Channel
- By Application
- Emerging Startups
- Innovation Benchmarking
- Competition Analysis
- Competition Deep Dive
- Marukome
- Overview
- Product Portfolio
- Profitability by Market Segments (Product/Region/Sales Channel)
- Sales Footprint
- Strategy Overview
- Marketing Strategy
- Product Strategy
- Channel Strategy
- IyasakaJozo Co.
- Source Foods
- Saikyo-Miso Co.
- Miyako Oriental Foods Inc.
- Hikari Miso Co. Ltd.
- Yamato Soysauce & Miso Co.
- Clearspring Ltd.
- Ohsawa Japan
- Muso Co., Ltd.
- Marukome
- Case Studies
- Success Stories
- Recent Developments
- Competition Deep Dive
- Assumptions & Acronyms Used


