Mooring Compensators Market
Market Insights on Mooring Compensators covering sales outlook, demand forecast & up-to-date key trends
Mooring Compensators Market by Type, Material, Application & region - Forecast 2022 - 2032
Mooring Compensators Market Outlook (2022-2032)
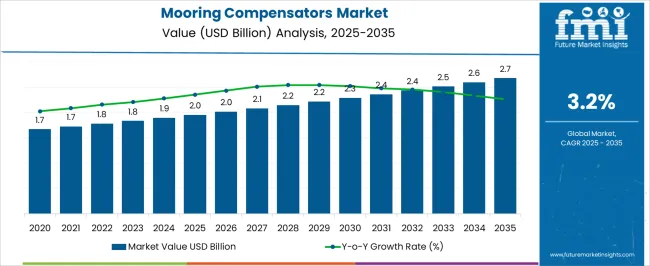
[308 Pages Report] The global mooring compensators market is forecasted to be valued at US$ 2439.0 million by 2032, up from US$ 1780.0 million in 2022, advancing at a CAGR of 3.2% during the forecast period.
The mooring compensator market is growing at a faster pace with substantial growth rates over the past few years. Previously ropes were used for mooring the boats, they are bendable longitudinal elements that can be used as mooring compensators. The demand for mooring compensators is increasing as it is best suitable for the purpose and can effectively compensate for the stormy shocks caused by waves.
Report Attribute |
Details |
Mooring Compensators Market Value (2022) |
US$ 1780.0 Million |
Mooring Compensators Market Anticipated Value (2032) |
US$ 2439.0 Million |
Mooring Compensators Projected Growth Rate (2022-2032) |
3.2% |
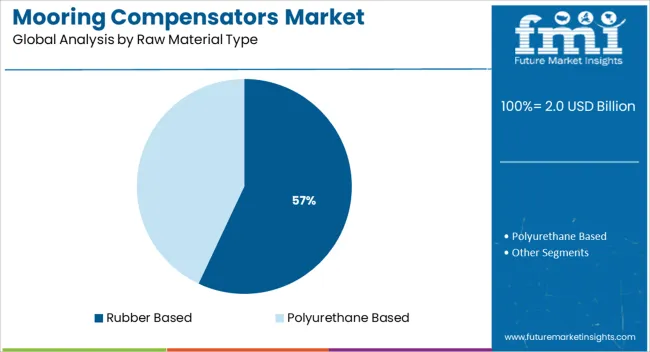
The mooring compensators market is likely to expand as there is the introduction of polymer-based and rubber-based materials, which are perfectly suited for mooring applications, and the market is anticipated to witness significant growth in the upcoming years.
Let us know your requirement to get
100% FREE customization
What are the Demand Drivers for the Mooring Compensators Market?
The surging recreational activities amongst the populace and the growing sales of boats are the prime factors driving the demand for mooring compensators.
Mooring compensators are identified to be the most essential accessory for mooring lines. They are manufactured from high-quality ethylene propylene diene monomer rubber, which is bolstering the sales of mooring compensators as they provide excellent strength, along with weather and saltwater resistance.
Moreover, its simplified types of threaded onto a rope, and not being threaded on the rope are making the application of mooring compensators easy, and are highly being adopted by boaters in the industry.
As per the National Marine Manufacturers Associations (NMMA), sales of powerboats reached more than 250,000 in 2016. Furthermore, new product development and rising demand from young boaters are assisting the industry growth for mooring compensators, expanding the market size for mooring compensators.
Moreover, the EPDM rubber with unique plastic locks maintains resiliency despite stresses and strains, no squeaking, and no wear and tear. Therefore, owing to these physical properties, mooring compensators are gaining traction in the market and pushing the demand for mooring compensators in the global market.
What are the Driving Challenges in the Mooring Compensators Market?
It is anticipated that a temporary ban on import and export and manufacturing & processing activities across some industries have decreased the demand for exploration and production of new infrastructures that would encourage the use the mooring compensators.
In addition to that, the lack of skilled workers, and the high cost of manufacturing the rubber-based mooring compensators are restraining the growth of the mooring compensators’ market share.
Find your sweet spots for generating winning opportunities in this market.
Talk to AnalystRegional Analysis
How is the Performance of the North America Mooring Compensators Market?
At present, the North American regions are expected to hold the largest market share for mooring compensators. Currently, this region is accountable for 28.0% of the total market size of mooring compensators.
Due to the rising adoption of products that extend the working life of mooring lines on the go, the reduced stress on the cleats with the absorption of tension and dampening of shock loading are the major concerns, mooring compensators are being adopted for maximum usage across the regions.
With rising disposable income, the young populace is indulging themselves in a large number of recreational activities like boating, fishing, and others in this region, which is fuelling the demand for more boat manufacturing and in turn bolstering the adoption of mooring compensators for better safety, shock prevention, and more durability in terms of wear and tear.
What is the Growth Outlook for the Europe Mooring Compensators Market?
It is anticipated that the mooring compensators market in Europe has very high growth potential in the upcoming years. Currently, the European regions are accountable for 31.1% of the total mooring compensators market share.
The demand for mooring compensators in this region is driven by the largely advancing boat manufacturing industries. With the rapid industrialization of this sector, and less use of metal-based compensators for their heavy, noisy, and impractical physical properties, rubber mooring compensators are in demand. Favorable policies by the government in this region are also likely to fuel the demand for mooring compensators in the European market.
However, the global mooring compensators market is projected to be dominated by the Asia-Pacific regions. Due to the presence of the largest harbors in this region, the market in APAC region is likely to dominate the global market share for mooring compensators.
Start-up Ecosystem
How are New Entrants Revolutionizing the Mooring Compensators Market?
The start-up ecosystem in the mooring compensators market is intense with frequent innovations being made. Start-ups in the mooring compensators market are focusing on improvising the tools for better implementation of mooring compensators in the harbors, and better wave and shock handling of the waves and winds.
They are considering factors like high and low tides, especially near the coasts where the difference in heights of tides is usually high. Sigma Polymer Group is offering two alternatives for safe mooring: the well renowned FORSHEDA compensator as well as the MINI Snubber, the latest addition to their range of mooring compensators. Both alternatives are modes of high-quality ozone-resistant EPDM rubber and render an absolutely safe and long-lasting mooring for all types of boats and yachts.
Some of the other mooring start-ups are De Haan Mussel Kanaal, Scana Industrier ASA, Advanced Production and Loading, Multinational Craig Energy Services, Lamprell Energy, and LHR Services & Equipment.

An unified Market Research Subscription Platform, built for today’s disparate research needs.
Competitive Landscape
Who are some of the Key Market Players in the Mooring Compensators Market?
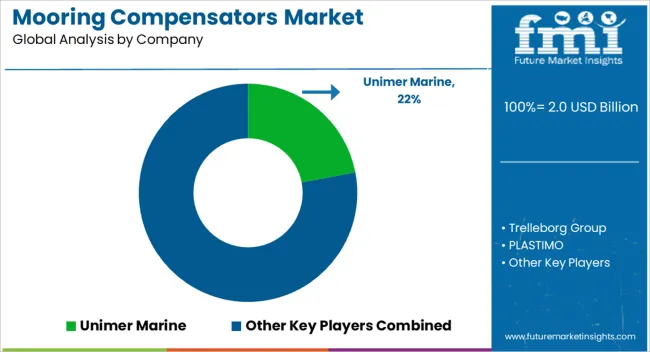
Some of the key players in the mooring compensators market are Unimer Marine, Trelleborg Group, PLASTIMO, Anchor Marine, Chain Ropes and Anchors, Boat Accessories Australia, and Excel Controlinkage Pvt. Ltd.
These players adopt numerous strategies, including partnership, agreement, and collaboration to stay competitive in the mooring compensators market. Globally, the mooring compensator market is expected to be one of the most consolidated markets as there are a small number of players involved in the manufacturing of the product.
Key Development in the Mooring Compensators Market
A key development in the mooring compensators market includes:
- In November 2021, Blue Water Energy Services signed an agreement with CNOOC Energy Technology & Services. This agreement aimed at engineering, procurement, and construction of turret mooring systems, including a new mooring system for an FPSO to be located off China. This has strengthened the presence of the company in the Asia-Pacific region.
Report Scope
Report Attribute |
Details |
Growth Rate |
CAGR of 3.2% from 2022 to 2032 |
Base Year for Estimation |
2021 |
Historical Data |
2016-2021 |
Forecast Period |
2022-2032 |
Quantitative Units |
Revenue in USD million and CAGR from 2022-2032 |
Report Coverage |
Revenue Forecast, Volume Forecast, Company Ranking, Competitive Landscape, Growth Factors, Trends and Pricing Analysis |
Segments Covered |
|
Regions Covered |
|
Key Countries Profiled |
|
Key Companies Profiled |
|
Customization |
Available Upon Request |
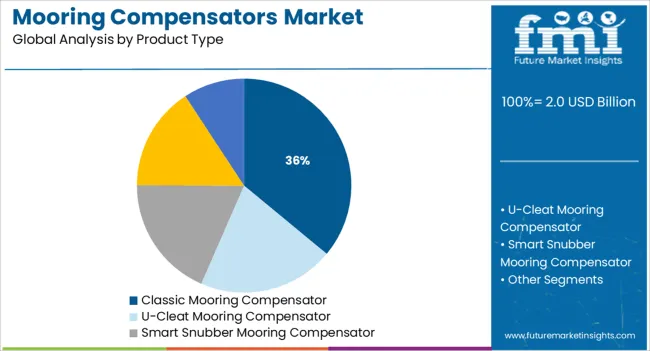
Key Segments in the Mooring Compensators Market
By Material:
- Rubber-baseded
- Polyurethane based
By Product Type:
- U-Cleat Mooring Compensator
- Smart Snubber Mooring Compensator
- Inline Mooring Compensator
- Classic Mooring Compensator
- Others
By Mooring Type:
- Catenary
- Taut
- Semi Taut
- Spread
- Single Point
- Dynamic Positioning
Frequently Asked Questions
The growth outlook for the mooring compensators market is predicted to advance at a CAGR of 3.2% from 2022 to 2032.
The Asia-Pacific region is anticipated to lead the mooring compensators market during the forecast period.
The mooring compensators market is likely to hold a valuation of US$ 2439.0 million by 2032.
The shipbuilding industry sector is the key driver in the mooring compensators market.
Table of Content
1. Executive Summary
1.1. Global Market Outlook
1.2. Demand-side Trends
1.3. Supply-side Trends
1.4. Technology Roadmap Analysis
1.5. Analysis and Recommendations
2. Market Overview
2.1. Market Coverage / Taxonomy
2.2. Market Definition / Scope / Limitations
3. Market Background
3.1. Market Dynamics
3.1.1. Drivers
3.1.2. Restraints
3.1.3. Opportunity
3.1.4. Trends
3.2. Scenario Forecast
3.2.1. Demand in Optimistic Scenario
3.2.2. Demand in Likely Scenario
3.2.3. Demand in Conservative Scenario
3.3. Opportunity Map Analysis
3.4. Product Life Cycle Analysis
3.5. Supply Chain Analysis
3.5.1. Supply Side Participants and their Roles
3.5.1.1. Producers
3.5.1.2. Mid-Level Participants (Traders/ Agents/ Brokers)
3.5.1.3. Wholesalers and Distributors
3.5.2. Value Added and Value Created at Node in the Supply Chain
3.5.3. List of Raw Material Suppliers
3.5.4. List of Existing and Potential Buyer’s
3.6. Investment Feasibility Matrix
3.7. Value Chain Analysis
3.7.1. Profit Margin Analysis
3.7.2. Wholesalers and Distributors
3.7.3. Retailers
3.8. PESTLE and Porter’s Analysis
3.9. Regulatory Landscape
3.9.1. By Key Regions
3.9.2. By Key Countries
3.10. Regional Parent Market Outlook
3.11. Production and Consumption Statistics
3.12. Import and Export Statistics
4. Global Mooring Compensators Market Analysis 2017-2021 and Forecast, 2022-2032
4.1. Historical Market Size Value (US$ Mn) & Volume (Units) Analysis, 2017-2021
4.2. Current and Future Market Size Value (US$ Mn) & Volume (Units) Projections, 2022-2032
4.2.1. Y-o-Y Growth Trend Analysis
4.2.2. Absolute $ Opportunity Analysis
5. Global Mooring Compensators Market Analysis 2017-2021 and Forecast 2022-2032, By Raw Material
5.1. Introduction / Key Findings
5.2. Historical Market Size Value (US$ Mn) & Volume (Units) Analysis By Raw Material, 2017-2021
5.3. Current and Future Market Size Value (US$ Mn) & Volume (Units) Analysis and Forecast By Raw Material, 2022-2032
5.3.1. Rubber Based
5.3.2. Polyurethane Based
5.4. Y-o-Y Growth Trend Analysis By Raw Material, 2017-2021
5.5. Absolute $ Opportunity Analysis By Raw Material, 2022-2032
6. Global Mooring Compensators Market Analysis 2017-2021 and Forecast 2022-2032, By Product Type
6.1. Introduction / Key Findings
6.2. Historical Market Size Value (US$ Mn) & Volume (Units) Analysis By Product Type, 2017-2021
6.3. Current and Future Market Size Value (US$ Mn) & Volume (Units) Analysis and Forecast By Product Type, 2022-2032
6.3.1. U-Cleat Mooring Compensator
6.3.2. Smart Snubber Mooring Compensator
6.3.3. Inline Mooring Compensator
6.3.4. Classic Mooring Compensator
6.3.5. Others
6.4. Y-o-Y Growth Trend Analysis By Product Type, 2017-2021
6.5. Absolute $ Opportunity Analysis By Product Type, 2022-2032
7. Global Mooring Compensators Market Analysis 2017-2021 and Forecast 2022-2032, By Region
7.1. Introduction
7.2. Historical Market Size Value (US$ Mn) & Volume (Units) Analysis By Region, 2017-2021
7.3. Current Market Size Value (US$ Mn) & Volume (Units) Analysis and Forecast By Region, 2022-2032
7.3.1. North America
7.3.2. Latin America
7.3.3. Europe
7.3.4. Asia Pacific
7.3.5. MEA
7.4. Market Attractiveness Analysis By Region
8. North America Mooring Compensators Market Analysis 2017-2021 and Forecast 2022-2032, By Country
8.1. Historical Market Size Value (US$ Mn) & Volume (Units) Trend Analysis By Market Taxonomy, 2017-2021
8.2. Market Size Value (US$ Mn) & Volume (Units) Forecast By Market Taxonomy, 2022-2032
8.2.1. By Country
8.2.1.1. U.S.
8.2.1.2. Canada
8.2.2. By Raw Material
8.2.3. By Product Type
8.3. Market Attractiveness Analysis
8.3.1. By Country
8.3.2. By Raw Material
8.3.3. By Product Type
8.4. Key Takeaways
9. Latin America Mooring Compensators Market Analysis 2017-2021 and Forecast 2022-2032, By Country
9.1. Historical Market Size Value (US$ Mn) & Volume (Units) Trend Analysis By Market Taxonomy, 2017-2021
9.2. Market Size Value (US$ Mn) & Volume (Units) Forecast By Market Taxonomy, 2022-2032
9.2.1. By Country
9.2.1.1. Brazil
9.2.1.2. Mexico
9.2.1.3. Rest of Latin America
9.2.2. By Raw Material
9.2.3. By Product Type
9.3. Market Attractiveness Analysis
9.3.1. By Country
9.3.2. By Raw Material
9.3.3. By Product Type
9.4. Key Takeaways
10. Europe Mooring Compensators Market Analysis 2017-2021 and Forecast 2022-2032, By Country
10.1. Historical Market Size Value (US$ Mn) & Volume (Units) Trend Analysis By Market Taxonomy, 2017-2021
10.2. Market Size Value (US$ Mn) & Volume (Units) Forecast By Market Taxonomy, 2022-2032
10.2.1. By Country
10.2.1.1. Germany
10.2.1.2. U.K.
10.2.1.3. France
10.2.1.4. Spain
10.2.1.5. Italy
10.2.1.6. Rest of Europe
10.2.2. By Raw Material
10.2.3. By Product Type
10.3. Market Attractiveness Analysis
10.3.1. By Country
10.3.2. By Raw Material
10.3.3. By Product Type
10.4. Key Takeaways
11. Asia Pacific Mooring Compensators Market Analysis 2017-2021 and Forecast 2022-2032, By Country
11.1. Historical Market Size Value (US$ Mn) & Volume (Units) Trend Analysis By Market Taxonomy, 2017-2021
11.2. Market Size Value (US$ Mn) & Volume (Units) Forecast By Market Taxonomy, 2022-2032
11.2.1. By Country
11.2.1.1. China
11.2.1.2. Japan
11.2.1.3. South Korea
11.2.1.4. Malaysia
11.2.1.5. Singapore
11.2.1.6. Australia
11.2.1.7. New Zealand
11.2.1.8. Rest of APAC
11.2.2. By Raw Material
11.2.3. By Product Type
11.3. Market Attractiveness Analysis
11.3.1. By Country
11.3.2. By Raw Material
11.3.3. By Product Type
11.4. Key Takeaways
12. MEA Mooring Compensators Market Analysis 2017-2021 and Forecast 2022-2032, By Country
12.1. Historical Market Size Value (US$ Mn) & Volume (Units) Trend Analysis By Market Taxonomy, 2017-2021
12.2. Market Size Value (US$ Mn) & Volume (Units) Forecast By Market Taxonomy, 2022-2032
12.2.1. By Country
12.2.1.1. GCC Countries
12.2.1.2. South Africa
12.2.1.3. Israel
12.2.1.4. Rest of MEA
12.2.2. By Raw Material
12.2.3. By Product Type
12.3. Market Attractiveness Analysis
12.3.1. By Country
12.3.2. By Raw Material
12.3.3. By Product Type
12.4. Key Takeaways
13. Key Countries Mooring Compensators Market Analysis
13.1. U.S.
13.1.1. Pricing Analysis
13.1.2. Market Share Analysis, 2021
13.1.2.1. By Raw Material
13.1.2.2. By Product Type
13.2. Canada
13.2.1. Pricing Analysis
13.2.2. Market Share Analysis, 2021
13.2.2.1. By Raw Material
13.2.2.2. By Product Type
13.3. Brazil
13.3.1. Pricing Analysis
13.3.2. Market Share Analysis, 2021
13.3.2.1. By Raw Material
13.3.2.2. By Product Type
13.4. Mexico
13.4.1. Pricing Analysis
13.4.2. Market Share Analysis, 2021
13.4.2.1. By Raw Material
13.4.2.2. By Product Type
13.5. Germany
13.5.1. Pricing Analysis
13.5.2. Market Share Analysis, 2021
13.5.2.1. By Raw Material
13.5.2.2. By Product Type
13.6. U.K.
13.6.1. Pricing Analysis
13.6.2. Market Share Analysis, 2021
13.6.2.1. By Raw Material
13.6.2.2. By Product Type
13.7. France
13.7.1. Pricing Analysis
13.7.2. Market Share Analysis, 2021
13.7.2.1. By Raw Material
13.7.2.2. By Product Type
13.8. Spain
13.8.1. Pricing Analysis
13.8.2. Market Share Analysis, 2021
13.8.2.1. By Raw Material
13.8.2.2. By Product Type
13.9. Italy
13.9.1. Pricing Analysis
13.9.2. Market Share Analysis, 2021
13.9.2.1. By Raw Material
13.9.2.2. By Product Type
13.10. China
13.10.1. Pricing Analysis
13.10.2. Market Share Analysis, 2021
13.10.2.1. By Raw Material
13.10.2.2. By Product Type
13.11. Japan
13.11.1. Pricing Analysis
13.11.2. Market Share Analysis, 2021
13.11.2.1. By Raw Material
13.11.2.2. By Product Type
13.12. South Korea
13.12.1. Pricing Analysis
13.12.2. Market Share Analysis, 2021
13.12.2.1. By Raw Material
13.12.2.2. By Product Type
13.13. Malaysia
13.13.1. Pricing Analysis
13.13.2. Market Share Analysis, 2021
13.13.2.1. By Raw Material
13.13.2.2. By Product Type
13.14. Singapore
13.14.1. Pricing Analysis
13.14.2. Market Share Analysis, 2021
13.14.2.1. By Raw Material
13.14.2.2. By Product Type
13.15. Australia
13.15.1. Pricing Analysis
13.15.2. Market Share Analysis, 2021
13.15.2.1. By Raw Material
13.15.2.2. By Product Type
13.16. New Zealand
13.16.1. Pricing Analysis
13.16.2. Market Share Analysis, 2021
13.16.2.1. By Raw Material
13.16.2.2. By Product Type
13.17. GCC Countries
13.17.1. Pricing Analysis
13.17.2. Market Share Analysis, 2021
13.17.2.1. By Raw Material
13.17.2.2. By Product Type
13.18. South Africa
13.18.1. Pricing Analysis
13.18.2. Market Share Analysis, 2021
13.18.2.1. By Raw Material
13.18.2.2. By Product Type
13.19. Israel
13.19.1. Pricing Analysis
13.19.2. Market Share Analysis, 2021
13.19.2.1. By Raw Material
13.19.2.2. By Product Type
14. Market Structure Analysis
14.1. Competition Dashboard
14.2. Competition Benchmarking
14.3. Market Share Analysis of Top Players
14.3.1. By Regional
14.3.2. By Raw Material
14.3.3. By Product Type
15. Competition Analysis
15.1. Competition Deep Dive
15.1.1. Unimer Marine
15.1.1.1. Overview
15.1.1.2. Product Portfolio
15.1.1.3. Profitability by Market Segments
15.1.1.4. Sales Footprint
15.1.1.5. Strategy Overview
15.1.1.5.1. Marketing Strategy
15.1.1.5.2. Product Strategy
15.1.1.5.3. Channel Strategy
15.1.2. Trelleborg Group
15.1.2.1. Overview
15.1.2.2. Product Portfolio
15.1.2.3. Profitability by Market Segments
15.1.2.4. Sales Footprint
15.1.2.5. Strategy Overview
15.1.2.5.1. Marketing Strategy
15.1.2.5.2. Product Strategy
15.1.2.5.3. Channel Strategy
15.1.3. PLASTIMO
15.1.3.1. Overview
15.1.3.2. Product Portfolio
15.1.3.3. Profitability by Market Segments
15.1.3.4. Sales Footprint
15.1.3.5. Strategy Overview
15.1.3.5.1. Marketing Strategy
15.1.3.5.2. Product Strategy
15.1.3.5.3. Channel Strategy
15.1.4. Anchor Marine
15.1.4.1. Overview
15.1.4.2. Product Portfolio
15.1.4.3. Profitability by Market Segments
15.1.4.4. Sales Footprint
15.1.4.5. Strategy Overview
15.1.4.5.1. Marketing Strategy
15.1.4.5.2. Product Strategy
15.1.4.5.3. Channel Strategy
15.1.5. Excel Controlinkage
15.1.5.1. Overview
15.1.5.2. Product Portfolio
15.1.5.3. Profitability by Market Segments
15.1.5.4. Sales Footprint
15.1.5.5. Strategy Overview
15.1.5.5.1. Marketing Strategy
15.1.5.5.2. Product Strategy
15.1.5.5.3. Channel Strategy
15.1.6. Chain Ropes and Anchors
15.1.6.1. Overview
15.1.6.2. Product Portfolio
15.1.6.3. Profitability by Market Segments
15.1.6.4. Sales Footprint
15.1.6.5. Strategy Overview
15.1.6.5.1. Marketing Strategy
15.1.6.5.2. Product Strategy
15.1.6.5.3. Channel Strategy
15.1.7. Boat Accessories Australia
15.1.7.1. Overview
15.1.7.2. Product Portfolio
15.1.7.3. Profitability by Market Segments
15.1.7.4. Sales Footprint
15.1.7.5. Strategy Overview
15.1.7.5.1. Marketing Strategy
15.1.7.5.2. Product Strategy
15.1.7.5.3. Channel Strategy
16. Assumptions & Acronyms Used
17. Research Methodology
Let us know your requirement to get
100% FREE customization
List of Tables
Table 1: Global Mooring Compensators Market Value (US$ Mn) Forecast by Region, 2017-2032
Table 2: Global Mooring Compensators Market Volume (Units) Forecast by Region, 2017-2032
Table 3: Global Mooring Compensators Market Value (US$ Mn) Forecast by Raw Material, 2017-2032
Table 4: Global Mooring Compensators Market Volume (Units) Forecast by Raw Material, 2017-2032
Table 5: Global Mooring Compensators Market Value (US$ Mn) Forecast by Product Type, 2017-2032
Table 6: Global Mooring Compensators Market Volume (Units) Forecast by Product Type, 2017-2032
Table 7: North America Mooring Compensators Market Value (US$ Mn) Forecast by Country, 2017-2032
Table 8: North America Mooring Compensators Market Volume (Units) Forecast by Country, 2017-2032
Table 9: North America Mooring Compensators Market Value (US$ Mn) Forecast by Raw Material, 2017-2032
Table 10: North America Mooring Compensators Market Volume (Units) Forecast by Raw Material, 2017-2032
Table 11: North America Mooring Compensators Market Value (US$ Mn) Forecast by Product Type, 2017-2032
Table 12: North America Mooring Compensators Market Volume (Units) Forecast by Product Type, 2017-2032
Table 13: Latin America Mooring Compensators Market Value (US$ Mn) Forecast by Country, 2017-2032
Table 14: Latin America Mooring Compensators Market Volume (Units) Forecast by Country, 2017-2032
Table 15: Latin America Mooring Compensators Market Value (US$ Mn) Forecast by Raw Material, 2017-2032
Table 16: Latin America Mooring Compensators Market Volume (Units) Forecast by Raw Material, 2017-2032
Table 17: Latin America Mooring Compensators Market Value (US$ Mn) Forecast by Product Type, 2017-2032
Table 18: Latin America Mooring Compensators Market Volume (Units) Forecast by Product Type, 2017-2032
Table 19: Europe Mooring Compensators Market Value (US$ Mn) Forecast by Country, 2017-2032
Table 20: Europe Mooring Compensators Market Volume (Units) Forecast by Country, 2017-2032
Table 21: Europe Mooring Compensators Market Value (US$ Mn) Forecast by Raw Material, 2017-2032
Table 22: Europe Mooring Compensators Market Volume (Units) Forecast by Raw Material, 2017-2032
Table 23: Europe Mooring Compensators Market Value (US$ Mn) Forecast by Product Type, 2017-2032
Table 24: Europe Mooring Compensators Market Volume (Units) Forecast by Product Type, 2017-2032
Table 25: Asia Pacific Mooring Compensators Market Value (US$ Mn) Forecast by Country, 2017-2032
Table 26: Asia Pacific Mooring Compensators Market Volume (Units) Forecast by Country, 2017-2032
Table 27: Asia Pacific Mooring Compensators Market Value (US$ Mn) Forecast by Raw Material, 2017-2032
Table 28: Asia Pacific Mooring Compensators Market Volume (Units) Forecast by Raw Material, 2017-2032
Table 29: Asia Pacific Mooring Compensators Market Value (US$ Mn) Forecast by Product Type, 2017-2032
Table 30: Asia Pacific Mooring Compensators Market Volume (Units) Forecast by Product Type, 2017-2032
Table 31: MEA Mooring Compensators Market Value (US$ Mn) Forecast by Country, 2017-2032
Table 32: MEA Mooring Compensators Market Volume (Units) Forecast by Country, 2017-2032
Table 33: MEA Mooring Compensators Market Value (US$ Mn) Forecast by Raw Material, 2017-2032
Table 34: MEA Mooring Compensators Market Volume (Units) Forecast by Raw Material, 2017-2032
Table 35: MEA Mooring Compensators Market Value (US$ Mn) Forecast by Product Type, 2017-2032
Table 36: MEA Mooring Compensators Market Volume (Units) Forecast by Product Type, 2017-2032
Find your sweet spots for generating winning opportunities in this market.
Talk to AnalystList of Charts
Figure 1: Global Mooring Compensators Market Value (US$ Mn) by Raw Material, 2022-2032
Figure 2: Global Mooring Compensators Market Value (US$ Mn) by Product Type, 2022-2032
Figure 3: Global Mooring Compensators Market Value (US$ Mn) by Region, 2022-2032
Figure 4: Global Mooring Compensators Market Value (US$ Mn) Analysis by Region, 2017-2032
Figure 5: Global Mooring Compensators Market Volume (Units) Analysis by Region, 2017-2032
Figure 6: Global Mooring Compensators Market Value Share (%) and BPS Analysis by Region, 2022-2032
Figure 7: Global Mooring Compensators Market Y-o-Y Growth (%) Projections by Region, 2022-2032
Figure 8: Global Mooring Compensators Market Value (US$ Mn) Analysis by Raw Material, 2017-2032
Figure 9: Global Mooring Compensators Market Volume (Units) Analysis by Raw Material, 2017-2032
Figure 10: Global Mooring Compensators Market Value Share (%) and BPS Analysis by Raw Material, 2022-2032
Figure 11: Global Mooring Compensators Market Y-o-Y Growth (%) Projections by Raw Material, 2022-2032
Figure 12: Global Mooring Compensators Market Value (US$ Mn) Analysis by Product Type, 2017-2032
Figure 13: Global Mooring Compensators Market Volume (Units) Analysis by Product Type, 2017-2032
Figure 14: Global Mooring Compensators Market Value Share (%) and BPS Analysis by Product Type, 2022-2032
Figure 15: Global Mooring Compensators Market Y-o-Y Growth (%) Projections by Product Type, 2022-2032
Figure 16: Global Mooring Compensators Market Attractiveness by Raw Material, 2022-2032
Figure 17: Global Mooring Compensators Market Attractiveness by Product Type, 2022-2032
Figure 18: Global Mooring Compensators Market Attractiveness by Region, 2022-2032
Figure 19: North America Mooring Compensators Market Value (US$ Mn) by Raw Material, 2022-2032
Figure 20: North America Mooring Compensators Market Value (US$ Mn) by Product Type, 2022-2032
Figure 21: North America Mooring Compensators Market Value (US$ Mn) by Country, 2022-2032
Figure 22: North America Mooring Compensators Market Value (US$ Mn) Analysis by Country, 2017-2032
Figure 23: North America Mooring Compensators Market Volume (Units) Analysis by Country, 2017-2032
Figure 24: North America Mooring Compensators Market Value Share (%) and BPS Analysis by Country, 2022-2032
Figure 25: North America Mooring Compensators Market Y-o-Y Growth (%) Projections by Country, 2022-2032
Figure 26: North America Mooring Compensators Market Value (US$ Mn) Analysis by Raw Material, 2017-2032
Figure 27: North America Mooring Compensators Market Volume (Units) Analysis by Raw Material, 2017-2032
Figure 28: North America Mooring Compensators Market Value Share (%) and BPS Analysis by Raw Material, 2022-2032
Figure 29: North America Mooring Compensators Market Y-o-Y Growth (%) Projections by Raw Material, 2022-2032
Figure 30: North America Mooring Compensators Market Value (US$ Mn) Analysis by Product Type, 2017-2032
Figure 31: North America Mooring Compensators Market Volume (Units) Analysis by Product Type, 2017-2032
Figure 32: North America Mooring Compensators Market Value Share (%) and BPS Analysis by Product Type, 2022-2032
Figure 33: North America Mooring Compensators Market Y-o-Y Growth (%) Projections by Product Type, 2022-2032
Figure 34: North America Mooring Compensators Market Attractiveness by Raw Material, 2022-2032
Figure 35: North America Mooring Compensators Market Attractiveness by Product Type, 2022-2032
Figure 36: North America Mooring Compensators Market Attractiveness by Country, 2022-2032
Figure 37: Latin America Mooring Compensators Market Value (US$ Mn) by Raw Material, 2022-2032
Figure 38: Latin America Mooring Compensators Market Value (US$ Mn) by Product Type, 2022-2032
Figure 39: Latin America Mooring Compensators Market Value (US$ Mn) by Country, 2022-2032
Figure 40: Latin America Mooring Compensators Market Value (US$ Mn) Analysis by Country, 2017-2032
Figure 41: Latin America Mooring Compensators Market Volume (Units) Analysis by Country, 2017-2032
Figure 42: Latin America Mooring Compensators Market Value Share (%) and BPS Analysis by Country, 2022-2032
Figure 43: Latin America Mooring Compensators Market Y-o-Y Growth (%) Projections by Country, 2022-2032
Figure 44: Latin America Mooring Compensators Market Value (US$ Mn) Analysis by Raw Material, 2017-2032
Figure 45: Latin America Mooring Compensators Market Volume (Units) Analysis by Raw Material, 2017-2032
Figure 46: Latin America Mooring Compensators Market Value Share (%) and BPS Analysis by Raw Material, 2022-2032
Figure 47: Latin America Mooring Compensators Market Y-o-Y Growth (%) Projections by Raw Material, 2022-2032
Figure 48: Latin America Mooring Compensators Market Value (US$ Mn) Analysis by Product Type, 2017-2032
Figure 49: Latin America Mooring Compensators Market Volume (Units) Analysis by Product Type, 2017-2032
Figure 50: Latin America Mooring Compensators Market Value Share (%) and BPS Analysis by Product Type, 2022-2032
Figure 51: Latin America Mooring Compensators Market Y-o-Y Growth (%) Projections by Product Type, 2022-2032
Figure 52: Latin America Mooring Compensators Market Attractiveness by Raw Material, 2022-2032
Figure 53: Latin America Mooring Compensators Market Attractiveness by Product Type, 2022-2032
Figure 54: Latin America Mooring Compensators Market Attractiveness by Country, 2022-2032
Figure 55: Europe Mooring Compensators Market Value (US$ Mn) by Raw Material, 2022-2032
Figure 56: Europe Mooring Compensators Market Value (US$ Mn) by Product Type, 2022-2032
Figure 57: Europe Mooring Compensators Market Value (US$ Mn) by Country, 2022-2032
Figure 58: Europe Mooring Compensators Market Value (US$ Mn) Analysis by Country, 2017-2032
Figure 59: Europe Mooring Compensators Market Volume (Units) Analysis by Country, 2017-2032
Figure 60: Europe Mooring Compensators Market Value Share (%) and BPS Analysis by Country, 2022-2032
Figure 61: Europe Mooring Compensators Market Y-o-Y Growth (%) Projections by Country, 2022-2032
Figure 62: Europe Mooring Compensators Market Value (US$ Mn) Analysis by Raw Material, 2017-2032
Figure 63: Europe Mooring Compensators Market Volume (Units) Analysis by Raw Material, 2017-2032
Figure 64: Europe Mooring Compensators Market Value Share (%) and BPS Analysis by Raw Material, 2022-2032
Figure 65: Europe Mooring Compensators Market Y-o-Y Growth (%) Projections by Raw Material, 2022-2032
Figure 66: Europe Mooring Compensators Market Value (US$ Mn) Analysis by Product Type, 2017-2032
Figure 67: Europe Mooring Compensators Market Volume (Units) Analysis by Product Type, 2017-2032
Figure 68: Europe Mooring Compensators Market Value Share (%) and BPS Analysis by Product Type, 2022-2032
Figure 69: Europe Mooring Compensators Market Y-o-Y Growth (%) Projections by Product Type, 2022-2032
Figure 70: Europe Mooring Compensators Market Attractiveness by Raw Material, 2022-2032
Figure 71: Europe Mooring Compensators Market Attractiveness by Product Type, 2022-2032
Figure 72: Europe Mooring Compensators Market Attractiveness by Country, 2022-2032
Figure 73: Asia Pacific Mooring Compensators Market Value (US$ Mn) by Raw Material, 2022-2032
Figure 74: Asia Pacific Mooring Compensators Market Value (US$ Mn) by Product Type, 2022-2032
Figure 75: Asia Pacific Mooring Compensators Market Value (US$ Mn) by Country, 2022-2032
Figure 76: Asia Pacific Mooring Compensators Market Value (US$ Mn) Analysis by Country, 2017-2032
Figure 77: Asia Pacific Mooring Compensators Market Volume (Units) Analysis by Country, 2017-2032
Figure 78: Asia Pacific Mooring Compensators Market Value Share (%) and BPS Analysis by Country, 2022-2032
Figure 79: Asia Pacific Mooring Compensators Market Y-o-Y Growth (%) Projections by Country, 2022-2032
Figure 80: Asia Pacific Mooring Compensators Market Value (US$ Mn) Analysis by Raw Material, 2017-2032
Figure 81: Asia Pacific Mooring Compensators Market Volume (Units) Analysis by Raw Material, 2017-2032
Figure 82: Asia Pacific Mooring Compensators Market Value Share (%) and BPS Analysis by Raw Material, 2022-2032
Figure 83: Asia Pacific Mooring Compensators Market Y-o-Y Growth (%) Projections by Raw Material, 2022-2032
Figure 84: Asia Pacific Mooring Compensators Market Value (US$ Mn) Analysis by Product Type, 2017-2032
Figure 85: Asia Pacific Mooring Compensators Market Volume (Units) Analysis by Product Type, 2017-2032
Figure 86: Asia Pacific Mooring Compensators Market Value Share (%) and BPS Analysis by Product Type, 2022-2032
Figure 87: Asia Pacific Mooring Compensators Market Y-o-Y Growth (%) Projections by Product Type, 2022-2032
Figure 88: Asia Pacific Mooring Compensators Market Attractiveness by Raw Material, 2022-2032
Figure 89: Asia Pacific Mooring Compensators Market Attractiveness by Product Type, 2022-2032
Figure 90: Asia Pacific Mooring Compensators Market Attractiveness by Country, 2022-2032
Figure 91: MEA Mooring Compensators Market Value (US$ Mn) by Raw Material, 2022-2032
Figure 92: MEA Mooring Compensators Market Value (US$ Mn) by Product Type, 2022-2032
Figure 93: MEA Mooring Compensators Market Value (US$ Mn) by Country, 2022-2032
Figure 94: MEA Mooring Compensators Market Value (US$ Mn) Analysis by Country, 2017-2032
Figure 95: MEA Mooring Compensators Market Volume (Units) Analysis by Country, 2017-2032
Figure 96: MEA Mooring Compensators Market Value Share (%) and BPS Analysis by Country, 2022-2032
Figure 97: MEA Mooring Compensators Market Y-o-Y Growth (%) Projections by Country, 2022-2032
Figure 98: MEA Mooring Compensators Market Value (US$ Mn) Analysis by Raw Material, 2017-2032
Figure 99: MEA Mooring Compensators Market Volume (Units) Analysis by Raw Material, 2017-2032
Figure 100: MEA Mooring Compensators Market Value Share (%) and BPS Analysis by Raw Material, 2022-2032
Figure 101: MEA Mooring Compensators Market Y-o-Y Growth (%) Projections by Raw Material, 2022-2032
Figure 102: MEA Mooring Compensators Market Value (US$ Mn) Analysis by Product Type, 2017-2032
Figure 103: MEA Mooring Compensators Market Volume (Units) Analysis by Product Type, 2017-2032
Figure 104: MEA Mooring Compensators Market Value Share (%) and BPS Analysis by Product Type, 2022-2032
Figure 105: MEA Mooring Compensators Market Y-o-Y Growth (%) Projections by Product Type, 2022-2032
Figure 106: MEA Mooring Compensators Market Attractiveness by Raw Material, 2022-2032
Figure 107: MEA Mooring Compensators Market Attractiveness by Product Type, 2022-2032
Figure 108: MEA Mooring Compensators Market Attractiveness by Country, 2022-2032
Need specific information?
Request CustomizationExplore Industrial Automation Insights
View Reports