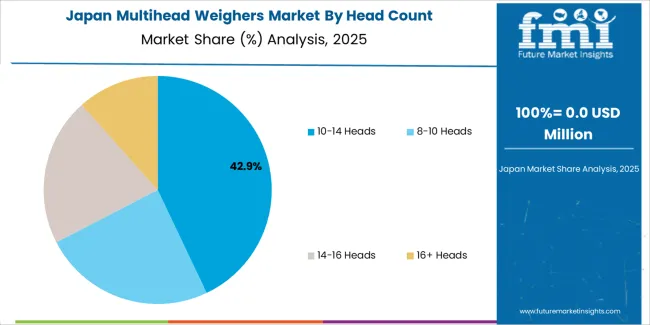
Multihead Weighers Market Size and Share Forecast Outlook 2025 to 2035

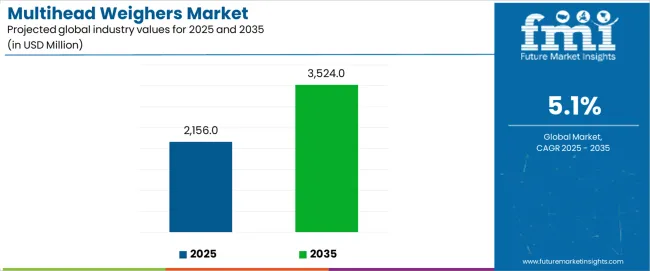
The multihead weighers market is forecasted to expand steadily from USD 256.8 million in 2025 to USD 365.8 million by 2035, growing at a CAGR of 3.6%. This growth is driven by increasing automation in the packaging industry, rising demand for accurate and high-speed weighing solutions, and expanding applications across food and non-food sectors. Additionally, advancements in machine technology, such as improved rotary and linear designs, are enhancing operational efficiency. Growing consumer preference for packaged and portion-controlled products is further fueling market demand globally.

By 2030, the market is forecasted to reach around USD 306.5 million, showing a steady climb across the first half of the period. The absolute dollar growth between 2025 and 2035 is expected to be about USD 108.9 million, indicating measured but reliable expansion. Growth remains steady, driven by increasing adoption of rotary machines and mid-range output models (71 to 140 PPM) across food and FMCG packaging sectors. Greater market penetration in emerging regions like India and China alongside technological advancements in automation and weighing accuracy is anticipated to strengthen demand in the latter half of the timeline.

Key companies such as Ishida Co., Ltd., IMA Group (Ilapak, Inc.), Marel Food Systems, Scanvaegt Systems A/S, and Duravant LLC are consolidating their positions by expanding production capabilities and investing in advanced automation and precision weighing technologies. Their innovation pipelines focus on enhancing machine speed, accuracy, and integration with Industry 4.0 solutions, enabling stronger competitiveness in food and non-food packaging sectors. Market performance will remain closely linked to operational efficiency, technological advancements, and service support, which will shape competitive outcomes across key regions including India, China, Japan, Germany, and North America.

Multihead Weighers Market Value Analysis

Quick Stats for Multihead Weighers Market

  • Multihead Weighers Market Value (2025): USD 256.8 million
  • Multihead Weighers Market Forecast Value (2035): USD 365.8 million
  • Multihead Weighers Market Forecast CAGR: 3.6%
  • Leading Segment in Multihead Weighers Market in 2025: Rotary Machines (80%)
  • Key Growth Regions in Multihead Weighers Market: Asia Pacific and North America
  • Top Players in Multihead Weighers Market: Ishida Co., Ltd., IMA Group (Ilapak, Inc.), Marel Food Systems, Scanvaegt Systems A/S, Duravant LLC

Multihead Weighers Market

Metric Value
Market Value (2025) USD 256.8 million
Market Forecast Value (2035) USD 365.8 million
CAGR (2025 to 2035) 3.6%

The multihead weighers market holds 40% of the global automated weighing systems sector, driven by high-speed throughput, precision, and reduced product giveaway. It accounts for around 30% of the snack and confectionery packaging equipment market, supported by rapid fill rates and portion consistency. The market contributes nearly 25% to frozen food packaging solutions. It holds close to 22% of the pet food weighing and filling systems segment. The share in pharmaceutical and nutraceutical weighing solutions reaches about 28%, reflecting demand for hygienic, accurate dosing and compliance.

The market is undergoing structural change driven by consumer demand for accuracy, reduced waste, and flexible packaging formats. Advanced servo-drive mechanisms, machine-vision integrations, and smart sensors have improved speed, hygiene, and minimal product damage. Manufacturers are introducing modular, easy-clean frame designs, remote diagnostics, and quick-change parts tailored for diverse product types. Strategic collaborations between OEMs, conveyor suppliers, and packaging brands have accelerated adoption. Industry 4.0 connectivity and predictive maintenance positioning have widened acceptance, reshaping traditional weigh-fill setups and pressuring conventional manual batching systems to evolve.

Why is Multihead Weighers Market Growing?

The multihead weighers market is growing due to increasing automation in packaging industries, which drives demand for precise, high-speed weighing solutions. Rising consumer preference for packaged and portion-controlled products in food and non-food sectors fuels adoption. Technological advancements in rotary and linear machines enhance efficiency, accuracy, and throughput, attracting manufacturers. Expansion of emerging markets like India and China, with growing food processing and FMCG sectors, further supports growth. Additionally, integration with smart factory systems and Industry 4.0 initiatives improves operational efficiency, reducing waste and cost, making multihead weighers indispensable for modern packaging lines. This combination sustains steady market expansion globally.

Rising demand for sustainable and energy-efficient packaging solutions also contributes to market growth, as companies seek to reduce environmental impact. Innovations in machine design, such as enhanced user interfaces and faster changeover capabilities, improve productivity and attract diverse end-users. Furthermore, the evolving regulatory landscape emphasizing food safety and quality assurance compels manufacturers to adopt advanced weighing technologies, reinforcing the market’s positive growth trajectory worldwide.

Multihead Weighers Market Analysis by Top Investment Segments

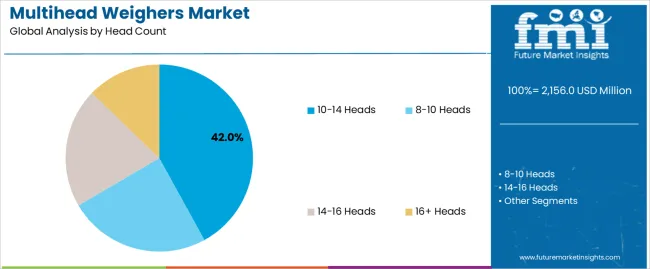
The market is segmented by number of heads, machine type, machine output, maximum weight measurement, end use, and region. By number of heads, the market is classified into up to 10 heads, 11 heads to 15 heads, 16 heads to 20 heads, and more than 20 heads. Based on machine type, the market is bifurcated into rotary machine and linear machine. In terms of machine output, the market is divided into up to 70 PPM, 71 PPM to 140 PPM, 141 PPM to 210 PPM, and more than 210 PPM.

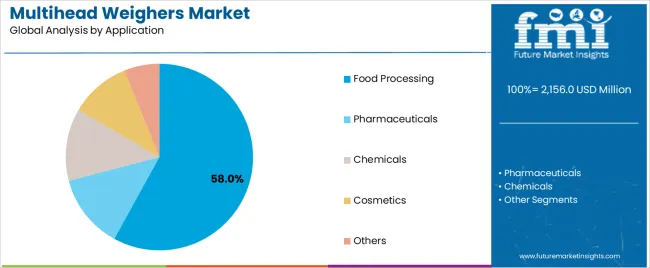
By maximum weight measurement, the market is divided into up to 1000 grams, 1001 grams to 2500 grams, 2501 grams to 5000 grams, and more than 5000 grams. Based on end use, the market is classified into food (snacks food, meat, poultry, and frozen food, ready-to-eat meals, fresh produce & salads, dairy products, bakery & confectionery, cereals & grains, pet food), chemical, pharmaceutical, and homecare & cosmetics. Regionally, the market is categorized intoNorth America, Latin America, Western Europe, East Asia, South Asia & Pacific, Middle East and Africa (MEA), and Eastern Europe.

By Machine Type, Rotary Machine Accounts for 80% Market Share

Multihead Weighers Market By Machine Type

The rotary machine segment is the most lucrative in the multihead weighers market, commanding a dominant share of 80% as of recent analyses. Rotary machines lead due to their high-speed capabilities, ease of maintenance, and ability to sustain continuous production, which is vital for large-scale operations. They excel in industries such as snacks, confectionery, frozen foods, and FMCG, where fast and accurate weighing of multiple product combinations is essential. Technological advancements in rotary machines, including improved vibration control and integration with automation systems, further boost their appeal.

Additionally, rotary machines consume less time per weighing cycle and offer higher throughput compared to linear machines, making them preferred for high-volume production lines. In contrast, linear machines, while gaining traction for delicate products requiring gentle handling, hold a smaller market share due to limited speed and technological advancement. Overall, the rotary segment's efficiency, productivity benefits, and adaptation to Industry 4.0 trends ensure its continued market dominance and attractive growth prospects.

By Machine Output, 71 PPM to 140 PPM Accounts for 40% Market Share

Multihead Weighers Market By Machine Output

The 71 PPM to 140 PPM machine output segment is the most lucrative and dominant in the multihead weighers market, accounting for 40% of the market share. This segment strikes an optimal balance between speed and accuracy, making it highly suitable for a broad range of mid-to-large scale packaging applications in food, snacks, frozen foods, and FMCG sectors. Machines in this output range provide highly reliable performance for small to medium-sized packaging lines, offering cost-effective solutions that meet industry demands for precision and efficiency.

Their adaptability to various product types and integration with automated production systems further strengthens their market position. Overall, the 71-140 PPM segment’s versatility and efficiency are key drivers behind its leading market role and projected steady growth globally. Additionally, rising disposable incomes and increasing demand for packaged food products in emerging markets are boosting adoption rates. Manufacturers continue to innovate with enhanced weighing accuracy and faster changeover features, making this segment essential for modern production lines.

Multihead Weighers Market Analysis by Key Countries

Multihead Weighers Market By Country

Country CAGR (%)
India 5.4
China 5.0
Brazil 2.8
Japan 2.7
Germany 2.4
UK 2.1

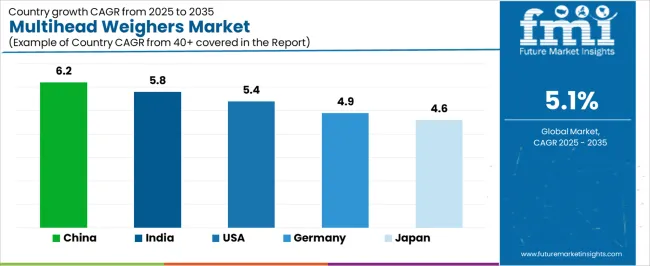
India leads the multihead weighers market with a CAGR of 5.4%, supported by rapid urbanization, expanding packaged food and FMCG sectors, and government initiatives to modernize food processing. China follows closely at 5.0%, driven by booming food processing industries, manufacturing modernization, and export-oriented production. Brazil grows moderately at 2.8%, boosted by mechanization and increasing processed food consumption. Japan posts a 2.7% CAGR, emphasizing robotics integration and precision in packaging. Germany’s market advances at 2.4%, backed by engineering excellence and Industry 4.0 adoption, notably in confectionery and pharmaceutical sectors. The UK expands at 2.1%, catalyzed by packaged food growth, regulatory compliance, and sustainability efforts.

The report covers an in-depth analysis of 40+ countries; six top-performing OECD countries are highlighted below.

Production Capacity Trends in Multihead Weighers Market in India

The multihead weighers market in India is projected to grow at a CAGR of 5.4% from 2025 to 2035, driven by rapid expansion in the packaged food and FMCG sectors. Rising urbanization and disposable income levels boost demand for packaged and processed foods, fueling automation in weighing and packaging. Government initiatives supporting food processing modernization and manufacturing automation strengthen growth prospects. Manufacturers are expanding production capacity to cater to both domestic and export demand. Competitive manufacturing costs and skilled labor attract international players, while local producers invest in upgrading technology to enhance accuracy and throughput. E-commerce growth and heightened food safety awareness further bolster adoption.

  • Rapid growth of food processing hubs in India
  • Expansion of e-commerce and retail networks
  • Export demand accelerates precision weighing adoption

Structural Expansion in Multihead Weighers Market in China

The multihead weighers market in China is set to grow at a CAGR of 5.0% during 2025 to 2035, fueled by a booming food processing industry and strong government-backed automation policies. Machinery modernization and stringent food safety compliance drive adoption of automated weighing systems. Competitive manufacturing costs and a large labor base enhance production capabilities, while rising packaged food demand and exports push machine deployment. Investments in R&D and smart factory concepts accelerate technological innovation. Domestic and global competition fosters product quality improvements, while sustainability and flexible packaging align with national regulatory priorities, reinforcing long-term growth.

  • Export-oriented food manufacturing expansion
  • Government-backed automation initiatives
  • Rising adoption of smart factory systems

Moderate Growth in Multihead Weighers Market in Brazil

Demand for multihead weighers in Brazil is expected to grow at a CAGR of 2.8% from 2025 to 2035, supported by a rising food processing industry and mechanization initiatives. Government programs encourage modernization to improve productivity and food safety compliance. Growing demand for processed and convenience foods accelerates adoption of reliable weighing solutions. E-commerce expansion strengthens the case for automated packaging machinery. Local manufacturers focus on cost-effective and scalable equipment, while collaborations with global technology providers enhance quality standards. Infrastructure development and industrial investments further support uptake, positioning Brazil for steady progress in meeting domestic and export packaging needs.

  • Processed food production boosts adoption
  • Mechanization supported by government policies
  • Regulatory compliance drives reliable equipment demand

Robotics Integration in Multihead Weighers Market in Japan

Revenue from multihead weighers in Japan is projected to expand at a CAGR of 2.7%, with growth centered on robotics and precision engineering. Rising demand for compact, hygienic, and highly accurate machines caters to small-portion food packaging and strict pharmaceutical needs. Strong collaborations between manufacturers and technology developers drive innovation in weighing speed, efficiency, and usability. Energy-efficient solutions gain traction amid tightening environmental regulations. Japan’s advanced manufacturing ecosystem supports seamless integration of automation, ensuring high product quality and operational reliability. Continuous R&D investments maintain global competitiveness, while consumer focus on quality packaging strengthens domestic and export opportunities.

  • Robotics and automation expertise drive growth
  • Rising demand for compact, hygienic machines
  • Energy-efficient solutions meet environmental policies

Engineering Excellence in Multihead Weighers Market in Germany

Sales of multihead weighers in Germany are forecast to expand at a CAGR of 2.4% through 2035, supported by the country’s engineering strengths and Industry 4.0 integration. Demand is concentrated in confectionery, meat, and pharmaceutical applications, where precision and compliance with strict safety standards are essential. Manufacturers invest in high-performance solutions that improve accuracy, throughput, and flexibility. Sustainability and reduced waste are key drivers for energy-efficient systems. Research collaborations between industry and academic institutions accelerate product innovation. A strong industrial ecosystem enhances deployment of smart machinery, while Germany’s global reputation for quality and reliability sustains competitive advantage in advanced weighing solutions.

  • High demand from confectionery and meat sectors
  • Waste reduction and sustainability initiatives
  • Research-led innovation strengthens competitiveness

Measured Growth in Multihead Weighers Market in the UK

The multihead weighers market in the UK is set to grow at a CAGR of 2.1% between 2025 and 2035, supported by packaged food expansion and automation goals. Rising consumption of convenience foods and private-label products drives investment in advanced weighing systems. Stringent food safety standards ensure uptake of hygienic and fast equipment. Growth in e-commerce food retail enhances accessibility to innovative packaging machinery. Manufacturers prioritize sustainable, energy-efficient technologies aligned with national environmental commitments. Competitive pressures encourage regular technological upgrades to boost precision and flexibility, while consumer focus on quality and convenience reinforces long-term market adoption.

  • Expansion of convenience food production
  • Stringent food safety compliance drives uptake
  • Sustainability and energy efficiency influence adoption

Competitive Landscape of the Multihead Weighers Market

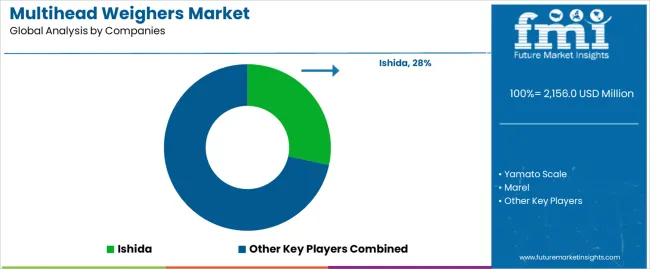
Multihead Weighers Market By Company

The market is moderately consolidated, dominated by key players such as Ishida Co., Ltd., IMA Group (Ilapak, Inc.), Marel Food Systems, Scanvaegt Systems A/S, and Duravant LLC, which together hold a significant majority of the market share. These companies leverage advanced technologies including rotary multihead designs, precision weighing sensors, and seamless integration with automated packaging lines to maintain competitive advantages.

The market benefits from large-scale production capacities, stringent quality controls, and expansive distribution networks. Regional manufacturers focus on cost-effective and customized solutions to enhance accessibility in emerging markets. Barriers to entry remain moderate due to regulatory requirements and technical expertise needed. Competitive advantage hinges on continuous innovation in machine technology, adoption of smart automation, and compliance with evolving industry standards globally.

Report Scope

Items Values
Quantitative Units (2025) USD 256.8 million
Number of Heads Up to 10 Heads, 11 to 15 Heads, 16 to 20 Heads, More than 20 Heads
Machine Type Rotary Machine, Linear Machine
Machine Output Up to 70 PPM, 71 to 140 PPM, 141 to 210 PPM, More than 210 PPM
Maximum Weight Measurement Up to 1000 Grams, 1001 to 2500 Grams, 2501 to 5000 Grams, More than 5000 Grams
End Use Food (Snacks, Meat/Poultry/Frozen Food, Ready-to-eat Meals, Fresh Produce/Salads, Dairy, Bakery & Confectionery, Cereals & Grains, Pet Food), Chemical, Pharmaceutical, Homecare & Cosmetics
Regions Covered North America, Latin America, Western Europe, East Asia, South Asia & Pacific, Middle East & Africa, Eastern Europe
Countries Covered United States, Canada, United Kingdom, Germany, France, China, Japan, South Korea, Brazil, Australia and 40+ countries
Key Companies Profiled IMA Group (Ilapak, Inc.), ISHIDA CO., LTD., Marel Food Systems, Duravant LLC, MULTIPOND Wägetechnik GmbH, Yamato Scale Co., Ltd., multiweigh GmbH, Dm Packaging Group S.r.l, RADPAK, PFM Group, Rees Machinery Group Ltd, Comek S.r.l., Avery Weigh- Tronix Group, Grupo Exaktapack S.L., Scanvaegt Systems A/S.
Additional Attributes Growth driven by automation, demand for precision weighing, expansion of food processing operations, technological advancements in machinery, adoption of smart manufacturing, digital integration, and increasing efficiency requirements in production lines

Key Segmentation

By Number of Heads:

In terms of number of heads, the industry is divided into 4 up to 10 heads, 11 to 15 heads, 16 to 20 heads, and more than 20 heads.

By Machine Output:

In terms of machine output, the industry is segregated as up to 70 ppm, 71 to 140 ppm, 141 to 210 ppm, and more than 210 ppm.

By Maximum Weight Measurement:

The industry is classified by maximum weight measurement as up to 1000 grams, 1001 to 2500 grams, 2501 to 5000 grams, and more than 5000 grams.

By Machine Type:

The industry is classified by machine type as rotary and linear.

By End Use:

The industry is classified by end use as food, chemical, pharmaceutical, and other industrial. Food is classified as snack food, meat, poultry, and frozen food, ready to eat meals, fresh produce and salads, dairy products, bakery and confectionary, cereals and grains, and others.

By Region:

Key countries of North America, Latin America, Western Europe, Eastern Europe, South Asia & Pacific, East Asia, and Middle East and Africa (MEA), have been covered in the report.

Table of Content

  1. Executive Summary
    • Global Market Outlook
    • Demand-side Trends
    • Supply-side Trends
    • Technology Roadmap Analysis
    • Analysis and Recommendations
  2. Market Overview
    • Market Coverage / Taxonomy
    • Market Definition / Scope / Limitations
  3. Market Background
    • Market Dynamics
      • Drivers
      • Restraints
      • Opportunity
      • Trends
    • Scenario Forecast
      • Demand in Optimistic Scenario
      • Demand in Likely Scenario
      • Demand in Conservative Scenario
    • Opportunity Map Analysis
    • Product Life Cycle Analysis
    • Supply Chain Analysis
      • Supply Side Participants and their Roles
        • Producers
        • Mid-Level Participants (Traders/ Agents/ Brokers)
        • Wholesalers and Distributors
      • Value Added and Value Created at Node in the Supply Chain
      • List of Raw Material Suppliers
      • List of Existing and Potential Buyer’s
    • Investment Feasibility Matrix
    • Value Chain Analysis
      • Profit Margin Analysis
      • Wholesalers and Distributors
      • Retailers
    • PESTLE and Porter’s Analysis
    • Regulatory Landscape
      • By Key Regions
      • By Key Countries
    • Regional Parent Market Outlook
    • Production and Consumption Statistics
    • Import and Export Statistics
  4. Global Market Analysis 2020 to 2024 and Forecast, 2025 to 2035
    • Historical Market Size Value (USD Million) & Volume (Units) Analysis, 2020 to 2024
    • Current and Future Market Size Value (USD Million) & Volume (Units) Projections, 2025 to 2035
      • Y-o-Y Growth Trend Analysis
      • Absolute $ Opportunity Analysis
  5. Global Market Pricing Analysis 2020 to 2024 and Forecast 2025 to 2035
  6. Global Market Analysis 2020 to 2024 and Forecast 2025 to 2035, By Number of Heads
    • Introduction / Key Findings
    • Historical Market Size Value (USD Million) & Volume (Units) Analysis By Number of Heads, 2020 to 2024
    • Current and Future Market Size Value (USD Million) & Volume (Units) Analysis and Forecast By Number of Heads, 2025 to 2035
      • Up to 10 Heads
      • 11 Heads to 15 Heads
      • 16 Heads to 20 Heads
      • More than 20 Heads
    • Y-o-Y Growth Trend Analysis By Number of Heads, 2020 to 2024
    • Absolute $ Opportunity Analysis By Number of Heads, 2025 to 2035
  7. Global Market Analysis 2020 to 2024 and Forecast 2025 to 2035, By Machine Type
    • Introduction / Key Findings
    • Historical Market Size Value (USD Million) & Volume (Units) Analysis By Machine Type, 2020 to 2024
    • Current and Future Market Size Value (USD Million) & Volume (Units) Analysis and Forecast By Machine Type, 2025 to 2035
      • Rotary Machine
      • Linear Machine
    • Y-o-Y Growth Trend Analysis By Machine Type, 2020 to 2024
    • Absolute $ Opportunity Analysis By Machine Type, 2025 to 2035
  8. Global Market Analysis 2020 to 2024 and Forecast 2025 to 2035, By Machine Output
    • Introduction / Key Findings
    • Historical Market Size Value (USD Million) & Volume (Units) Analysis By Machine Output, 2020 to 2024
    • Current and Future Market Size Value (USD Million) & Volume (Units) Analysis and Forecast By Machine Output, 2025 to 2035
      • Up to 70 PPM
      • 71 PPM to 140 PPM
      • 141 PPM to 210 PPM
      • More than 210 PPM
    • Y-o-Y Growth Trend Analysis By Machine Output, 2020 to 2024
    • Absolute $ Opportunity Analysis By Machine Output, 2025 to 2035
  9. Global Market Analysis 2020 to 2024 and Forecast 2025 to 2035, By Maximum Weight Measurement
    • Introduction / Key Findings
    • Historical Market Size Value (USD Million) & Volume (Units) Analysis By Maximum Weight Measurement, 2020 to 2024
    • Current and Future Market Size Value (USD Million) & Volume (Units) Analysis and Forecast By Maximum Weight Measurement, 2025 to 2035
      • Up to 1000 Grams
      • 1001 Grams to 2500 Grams
      • 2501 Grams to 5000 Grams
      • More than 5000 Grams
    • Y-o-Y Growth Trend Analysis By Maximum Weight Measurement, 2020 to 2024
    • Absolute $ Opportunity Analysis By Maximum Weight Measurement, 2025 to 2035
  10. Global Market Analysis 2020 to 2024 and Forecast 2025 to 2035, By End Use
    • Introduction / Key Findings
    • Historical Market Size Value (USD Million) & Volume (Units) Analysis By End Use, 2020 to 2024
    • Current and Future Market Size Value (USD Million) & Volume (Units) Analysis and Forecast By End Use, 2025 to 2035
      • Food
        • Snacks Food
        • Meat, Poultry, and Frozen Food
        • Ready-to-eat Meals
        • Fresh Produce & Salads
        • Dairy Products
        • Bakery & Confectionary
        • Cereals & Grains
        • Pet Food
      • Chemical
      • Pharmaceutical
      • Homecare & Cosmetics
    • Y-o-Y Growth Trend Analysis By End Use, 2020 to 2024
    • Absolute $ Opportunity Analysis By End Use, 2025 to 2035
  11. Global Market Analysis 2020 to 2024 and Forecast 2025 to 2035, By Region
    • Introduction
    • Historical Market Size Value (USD Million) & Volume (Units) Analysis By Region, 2020 to 2024
    • Current Market Size Value (USD Million) & Volume (Units) Analysis and Forecast By Region, 2025 to 2035
      • North America
      • Latin America
      • Western Europe
      • Eastern Europe
      • East Asia
      • South Asia & Pacific
      • Middle East and Africa
    • Market Attractiveness Analysis By Region
  12. North America Market Analysis 2020 to 2024 and Forecast 2025 to 2035, By Country
    • Historical Market Size Value (USD Million) & Volume (Units) Trend Analysis By Market Taxonomy, 2020 to 2024
    • Market Size Value (USD Million) & Volume (Units) Forecast By Market Taxonomy, 2025 to 2035
      • By Country
        • USA
        • Canada
        • Mexico
      • By Number of Heads
      • By Machine Type
      • By Machine Output
      • By Maximum Weight Measurement
      • By End Use
    • Market Attractiveness Analysis
      • By Country
      • By Number of Heads
      • By Machine Type
      • By Machine Output
      • By Maximum Weight Measurement
      • By End Use
    • Key Takeaways
  13. Latin America Market Analysis 2020 to 2024 and Forecast 2025 to 2035, By Country
    • Historical Market Size Value (USD Million) & Volume (Units) Trend Analysis By Market Taxonomy, 2020 to 2024
    • Market Size Value (USD Million) & Volume (Units) Forecast By Market Taxonomy, 2025 to 2035
      • By Country
        • Brazil
        • Argentina
        • Rest of LATAM
      • By Number of Heads
      • By Machine Type
      • By Machine Output
      • By Maximum Weight Measurement
      • By End Use
    • Market Attractiveness Analysis
      • By Country
      • By Number of Heads
      • By Machine Type
      • By Machine Output
      • By Maximum Weight Measurement
      • By End Use
    • Key Takeaways
  14. Western Europe Market Analysis 2020 to 2024 and Forecast 2025 to 2035, By Country
    • Historical Market Size Value (USD Million) & Volume (Units) Trend Analysis By Market Taxonomy, 2020 to 2024
    • Market Size Value (USD Million) & Volume (Units) Forecast By Market Taxonomy, 2025 to 2035
      • By Country
        • Germany
        • Italy
        • France
        • UK
        • Spain
        • BENELUX
        • Nordic
        • Rest of W.Europe
      • By Number of Heads
      • By Machine Type
      • By Machine Output
      • By Maximum Weight Measurement
      • By End Use
    • Market Attractiveness Analysis
      • By Country
      • By Number of Heads
      • By Machine Type
      • By Machine Output
      • By Maximum Weight Measurement
      • By End Use
    • Key Takeaways
  15. Eastern Europe Market Analysis 2020 to 2024 and Forecast 2025 to 2035, By Country
    • Historical Market Size Value (USD Million) & Volume (Units) Trend Analysis By Market Taxonomy, 2020 to 2024
    • Market Size Value (USD Million) & Volume (Units) Forecast By Market Taxonomy, 2025 to 2035
      • By Country
        • Russia
        • Hungary
        • Poland
        • Balkan & Baltics
        • Rest of E. Europe
      • By Number of Heads
      • By Machine Type
      • By Machine Output
      • By Maximum Weight Measurement
      • By End Use
    • Market Attractiveness Analysis
      • By Country
      • By Number of Heads
      • By Machine Type
      • By Machine Output
      • By Maximum Weight Measurement
      • By End Use
    • Key Takeaways
  16. East Asia Market Analysis 2020 to 2024 and Forecast 2025 to 2035, By Country
    • Historical Market Size Value (USD Million) & Volume (Units) Trend Analysis By Market Taxonomy, 2020 to 2024
    • Market Size Value (USD Million) & Volume (Units) Forecast By Market Taxonomy, 2025 to 2035
      • By Country
        • China
        • Japan
        • South Korea
      • By Number of Heads
      • By Machine Type
      • By Machine Output
      • By Maximum Weight Measurement
      • By End Use
    • Market Attractiveness Analysis
      • By Country
      • By Number of Heads
      • By Machine Type
      • By Machine Output
      • By Maximum Weight Measurement
      • By End Use
    • Key Takeaways
  17. South Asia & Pacific Market Analysis 2020 to 2024 and Forecast 2025 to 2035, By Country
    • Historical Market Size Value (USD Million) & Volume (Units) Trend Analysis By Market Taxonomy, 2020 to 2024
    • Market Size Value (USD Million) & Volume (Units) Forecast By Market Taxonomy, 2025 to 2035
      • By Country
        • India
        • Australia & New Zealand
        • ASEAN
        • Rest of SAP
      • By Number of Heads
      • By Machine Type
      • By Machine Output
      • By Maximum Weight Measurement
      • By End Use
    • Market Attractiveness Analysis
      • By Country
      • By Number of Heads
      • By Machine Type
      • By Machine Output
      • By Maximum Weight Measurement
      • By End Use
    • Key Takeaways
  18. Middle East and Africa Market Analysis 2020 to 2024 and Forecast 2025 to 2035, By Country
    • Historical Market Size Value (USD Million) & Volume (Units) Trend Analysis By Market Taxonomy, 2020 to 2024
    • Market Size Value (USD Million) & Volume (Units) Forecast By Market Taxonomy, 2025 to 2035
      • By Country
        • GCC Countries
        • Northern Africa
        • South Africa
        • Turkiye
        • Rest of MEA
      • By Number of Heads
      • By Machine Type
      • By Machine Output
      • By Maximum Weight Measurement
      • By End Use
    • Market Attractiveness Analysis
      • By Country
      • By Number of Heads
      • By Machine Type
      • By Machine Output
      • By Maximum Weight Measurement
      • By End Use
    • Key Takeaways
  19. Key Countries Market Analysis
    • USA
      • Pricing Analysis
      • Market Share Analysis, 2024
        • By Number of Heads
        • By Machine Type
        • By Machine Output
        • By Maximum Weight Measurement
        • By End Use
    • Canada
      • Pricing Analysis
      • Market Share Analysis, 2024
        • By Number of Heads
        • By Machine Type
        • By Machine Output
        • By Maximum Weight Measurement
        • By End Use
    • Brazil
      • Pricing Analysis
      • Market Share Analysis, 2024
        • By Number of Heads
        • By Machine Type
        • By Machine Output
        • By Maximum Weight Measurement
        • By End Use
    • Mexico
      • Pricing Analysis
      • Market Share Analysis, 2024
        • By Number of Heads
        • By Machine Type
        • By Machine Output
        • By Maximum Weight Measurement
        • By End Use
    • Argentina
      • Pricing Analysis
      • Market Share Analysis, 2024
        • By Number of Heads
        • By Machine Type
        • By Machine Output
        • By Maximum Weight Measurement
        • By End Use
  20. Market Structure Analysis
    • Competition Dashboard
    • Competition Benchmarking
    • Market Share Analysis of Top Players
      • By Regional
      • By Number of Heads
      • By Machine Type
      • By Machine Output
      • By Maximum Weight Measurement
      • By End Use
  21. Competition Analysis
    • Competition Deep Dive
      • IMA Group (Ilapak, Inc.)
        • Overview
        • Product Portfolio
        • Profitability by Market Segments (Product/Age /Sales Channel/Region)
        • Sales Footprint
        • Strategy Overview
          • Marketing Strategy
          • Product Strategy
          • Channel Strategy
      • ISHIDA CO., LTD.
        • Overview
        • Product Portfolio
        • Profitability by Market Segments (Product/Age /Sales Channel/Region)
        • Sales Footprint
        • Strategy Overview
          • Marketing Strategy
          • Product Strategy
          • Channel Strategy
      • Marel Food Systems
        • Overview
        • Product Portfolio
        • Profitability by Market Segments (Product/Age /Sales Channel/Region)
        • Sales Footprint
        • Strategy Overview
          • Marketing Strategy
          • Product Strategy
          • Channel Strategy
      • Duravant LLC
        • Overview
        • Product Portfolio
        • Profitability by Market Segments (Product/Age /Sales Channel/Region)
        • Sales Footprint
        • Strategy Overview
          • Marketing Strategy
          • Product Strategy
          • Channel Strategy
      • MULTIPOND Wägetechnik GmbH
        • Overview
        • Product Portfolio
        • Profitability by Market Segments (Product/Age /Sales Channel/Region)
        • Sales Footprint
        • Strategy Overview
          • Marketing Strategy
          • Product Strategy
          • Channel Strategy
      • Yamato Scale Co., Ltd.
        • Overview
        • Product Portfolio
        • Profitability by Market Segments (Product/Age /Sales Channel/Region)
        • Sales Footprint
        • Strategy Overview
          • Marketing Strategy
          • Product Strategy
          • Channel Strategy
      • Multiweigh GmbH
        • Overview
        • Product Portfolio
        • Profitability by Market Segments (Product/Age /Sales Channel/Region)
        • Sales Footprint
        • Strategy Overview
          • Marketing Strategy
          • Product Strategy
          • Channel Strategy
      • Dm Packaging Group S.r.l
        • Overview
        • Product Portfolio
        • Profitability by Market Segments (Product/Age /Sales Channel/Region)
        • Sales Footprint
        • Strategy Overview
          • Marketing Strategy
          • Product Strategy
          • Channel Strategy
      • RADPAK
        • Overview
        • Product Portfolio
        • Profitability by Market Segments (Product/Age /Sales Channel/Region)
        • Sales Footprint
        • Strategy Overview
          • Marketing Strategy
          • Product Strategy
          • Channel Strategy
      • PFM Group
        • Overview
        • Product Portfolio
        • Profitability by Market Segments (Product/Age /Sales Channel/Region)
        • Sales Footprint
        • Strategy Overview
          • Marketing Strategy
          • Product Strategy
          • Channel Strategy
      • Rees Machinery Group Ltd
        • Overview
        • Product Portfolio
        • Profitability by Market Segments (Product/Age /Sales Channel/Region)
        • Sales Footprint
        • Strategy Overview
          • Marketing Strategy
          • Product Strategy
          • Channel Strategy
      • Comek S.r.l.
        • Overview
        • Product Portfolio
        • Profitability by Market Segments (Product/Age /Sales Channel/Region)
        • Sales Footprint
        • Strategy Overview
          • Marketing Strategy
          • Product Strategy
          • Channel Strategy
      • Avery Weigh-Tronix Group
        • Overview
        • Product Portfolio
        • Profitability by Market Segments (Product/Age /Sales Channel/Region)
        • Sales Footprint
        • Strategy Overview
          • Marketing Strategy
          • Product Strategy
          • Channel Strategy
      • Grupo Exaktapack S.L.
        • Overview
        • Product Portfolio
        • Profitability by Market Segments (Product/Age /Sales Channel/Region)
        • Sales Footprint
        • Strategy Overview
          • Marketing Strategy
          • Product Strategy
          • Channel Strategy
      • Scanvaegt Systems A/S
        • Overview
        • Product Portfolio
        • Profitability by Market Segments (Product/Age /Sales Channel/Region)
        • Sales Footprint
        • Strategy Overview
          • Marketing Strategy
          • Product Strategy
          • Channel Strategy
  22. Assumptions & Acronyms Used
  23. Research Methodology

List of Tables

  • Table 1: Global Market Value (USD Million) Forecast by Region, 2020-2035
  • Table 2: Global Market Volume (Units) Forecast by Region, 2020-2035
  • Table 3: Global Market Value (USD Million) Forecast by Number of Heads, 2020-2035
  • Table 4: Global Market Volume (Units) Forecast by Number of Heads, 2020-2035
  • Table 5: Global Market Value (USD Million) Forecast by Machine Type, 2020-2035
  • Table 6: Global Market Volume (Units) Forecast by Machine Type, 2020-2035
  • Table 7: Global Market Value (USD Million) Forecast by Machine Output, 2020-2035
  • Table 8: Global Market Volume (Units) Forecast by Machine Output, 2020-2035
  • Table 9: Global Market Value (USD Million) Forecast by Maximum Weight Measurement, 2020-2035
  • Table 10: Global Market Volume (Units) Forecast by Maximum Weight Measurement, 2020-2035
  • Table 11: Global Market Value (USD Million) Forecast by End Use, 2020-2035
  • Table 12: Global Market Volume (Units) Forecast by End Use, 2020-2035
  • Table 13: North America Market Value (USD Million) Forecast by Country, 2020-2035
  • Table 14: North America Market Volume (Units) Forecast by Country, 2020-2035
  • Table 15: North America Market Value (USD Million) Forecast by Number of Heads, 2020-2035
  • Table 16: North America Market Volume (Units) Forecast by Number of Heads, 2020-2035
  • Table 17: North America Market Value (USD Million) Forecast by Machine Type, 2020-2035
  • Table 18: North America Market Volume (Units) Forecast by Machine Type, 2020-2035
  • Table 19: North America Market Value (USD Million) Forecast by Machine Output, 2020-2035
  • Table 20: North America Market Volume (Units) Forecast by Machine Output, 2020-2035
  • Table 21: North America Market Value (USD Million) Forecast by Maximum Weight Measurement, 2020-2035
  • Table 22: North America Market Volume (Units) Forecast by Maximum Weight Measurement, 2020-2035
  • Table 23: North America Market Value (USD Million) Forecast by End Use, 2020-2035
  • Table 24: North America Market Volume (Units) Forecast by End Use, 2020-2035
  • Table 25: Latin America Market Value (USD Million) Forecast by Country, 2020-2035
  • Table 26: Latin America Market Volume (Units) Forecast by Country, 2020-2035
  • Table 27: Latin America Market Value (USD Million) Forecast by Number of Heads, 2020-2035
  • Table 28: Latin America Market Volume (Units) Forecast by Number of Heads, 2020-2035
  • Table 29: Latin America Market Value (USD Million) Forecast by Machine Type, 2020-2035
  • Table 30: Latin America Market Volume (Units) Forecast by Machine Type, 2020-2035
  • Table 31: Latin America Market Value (USD Million) Forecast by Machine Output, 2020-2035
  • Table 32: Latin America Market Volume (Units) Forecast by Machine Output, 2020-2035
  • Table 33: Latin America Market Value (USD Million) Forecast by Maximum Weight Measurement, 2020-2035
  • Table 34: Latin America Market Volume (Units) Forecast by Maximum Weight Measurement, 2020-2035
  • Table 35: Latin America Market Value (USD Million) Forecast by End Use, 2020-2035
  • Table 36: Latin America Market Volume (Units) Forecast by End Use, 2020-2035
  • Table 37: Western Europe Market Value (USD Million) Forecast by Country, 2020-2035
  • Table 38: Western Europe Market Volume (Units) Forecast by Country, 2020-2035
  • Table 39: Western Europe Market Value (USD Million) Forecast by Number of Heads, 2020-2035
  • Table 40: Western Europe Market Volume (Units) Forecast by Number of Heads, 2020-2035
  • Table 41: Western Europe Market Value (USD Million) Forecast by Machine Type, 2020-2035
  • Table 42: Western Europe Market Volume (Units) Forecast by Machine Type, 2020-2035
  • Table 43: Western Europe Market Value (USD Million) Forecast by Machine Output, 2020-2035
  • Table 44: Western Europe Market Volume (Units) Forecast by Machine Output, 2020-2035
  • Table 45: Western Europe Market Value (USD Million) Forecast by Maximum Weight Measurement, 2020-2035
  • Table 46: Western Europe Market Volume (Units) Forecast by Maximum Weight Measurement, 2020-2035
  • Table 47: Western Europe Market Value (USD Million) Forecast by End Use, 2020-2035
  • Table 48: Western Europe Market Volume (Units) Forecast by End Use, 2020-2035
  • Table 49: Eastern Europe Market Value (USD Million) Forecast by Country, 2020-2035
  • Table 50: Eastern Europe Market Volume (Units) Forecast by Country, 2020-2035
  • Table 51: Eastern Europe Market Value (USD Million) Forecast by Number of Heads, 2020-2035
  • Table 52: Eastern Europe Market Volume (Units) Forecast by Number of Heads, 2020-2035
  • Table 53: Eastern Europe Market Value (USD Million) Forecast by Machine Type, 2020-2035
  • Table 54: Eastern Europe Market Volume (Units) Forecast by Machine Type, 2020-2035
  • Table 55: Eastern Europe Market Value (USD Million) Forecast by Machine Output, 2020-2035
  • Table 56: Eastern Europe Market Volume (Units) Forecast by Machine Output, 2020-2035
  • Table 57: Eastern Europe Market Value (USD Million) Forecast by Maximum Weight Measurement, 2020-2035
  • Table 58: Eastern Europe Market Volume (Units) Forecast by Maximum Weight Measurement, 2020-2035
  • Table 59: Eastern Europe Market Value (USD Million) Forecast by End Use, 2020-2035
  • Table 60: Eastern Europe Market Volume (Units) Forecast by End Use, 2020-2035
  • Table 61: East Asia Market Value (USD Million) Forecast by Country, 2020-2035
  • Table 62: East Asia Market Volume (Units) Forecast by Country, 2020-2035
  • Table 63: East Asia Market Value (USD Million) Forecast by Number of Heads, 2020-2035
  • Table 64: East Asia Market Volume (Units) Forecast by Number of Heads, 2020-2035
  • Table 65: East Asia Market Value (USD Million) Forecast by Machine Type, 2020-2035
  • Table 66: East Asia Market Volume (Units) Forecast by Machine Type, 2020-2035
  • Table 67: East Asia Market Value (USD Million) Forecast by Machine Output, 2020-2035
  • Table 68: East Asia Market Volume (Units) Forecast by Machine Output, 2020-2035
  • Table 69: East Asia Market Value (USD Million) Forecast by Maximum Weight Measurement, 2020-2035
  • Table 70: East Asia Market Volume (Units) Forecast by Maximum Weight Measurement, 2020-2035
  • Table 71: East Asia Market Value (USD Million) Forecast by End Use, 2020-2035
  • Table 72: East Asia Market Volume (Units) Forecast by End Use, 2020-2035
  • Table 73: South Asia & Pacific Market Value (USD Million) Forecast by Country, 2020-2035
  • Table 74: South Asia & Pacific Market Volume (Units) Forecast by Country, 2020-2035
  • Table 75: South Asia & Pacific Market Value (USD Million) Forecast by Number of Heads, 2020-2035
  • Table 76: South Asia & Pacific Market Volume (Units) Forecast by Number of Heads, 2020-2035
  • Table 77: South Asia & Pacific Market Value (USD Million) Forecast by Machine Type, 2020-2035
  • Table 78: South Asia & Pacific Market Volume (Units) Forecast by Machine Type, 2020-2035
  • Table 79: South Asia & Pacific Market Value (USD Million) Forecast by Machine Output, 2020-2035
  • Table 80: South Asia & Pacific Market Volume (Units) Forecast by Machine Output, 2020-2035
  • Table 81: South Asia & Pacific Market Value (USD Million) Forecast by Maximum Weight Measurement, 2020-2035
  • Table 82: South Asia & Pacific Market Volume (Units) Forecast by Maximum Weight Measurement, 2020-2035
  • Table 83: South Asia & Pacific Market Value (USD Million) Forecast by End Use, 2020-2035
  • Table 84: South Asia & Pacific Market Volume (Units) Forecast by End Use, 2020-2035
  • Table 85: Middle East and Africa Market Value (USD Million) Forecast by Country, 2020-2035
  • Table 86: Middle East and Africa Market Volume (Units) Forecast by Country, 2020-2035
  • Table 87: Middle East and Africa Market Value (USD Million) Forecast by Number of Heads, 2020-2035
  • Table 88: Middle East and Africa Market Volume (Units) Forecast by Number of Heads, 2020-2035
  • Table 89: Middle East and Africa Market Value (USD Million) Forecast by Machine Type, 2020-2035
  • Table 90: Middle East and Africa Market Volume (Units) Forecast by Machine Type, 2020-2035
  • Table 91: Middle East and Africa Market Value (USD Million) Forecast by Machine Output, 2020-2035
  • Table 92: Middle East and Africa Market Volume (Units) Forecast by Machine Output, 2020-2035
  • Table 93: Middle East and Africa Market Value (USD Million) Forecast by Maximum Weight Measurement, 2020-2035
  • Table 94: Middle East and Africa Market Volume (Units) Forecast by Maximum Weight Measurement, 2020-2035
  • Table 95: Middle East and Africa Market Value (USD Million) Forecast by End Use, 2020-2035
  • Table 96: Middle East and Africa Market Volume (Units) Forecast by End Use, 2020-2035

List of Figures

  • Figure 1: Global Market Volume (Units) Forecast 2020-2035
  • Figure 2: Global Market Pricing Analysis
  • Figure 3: Global Market Value (USD Million) Forecast 2020-2035
  • Figure 4: Global Market Value Share and BPS Analysis by Number of Heads, 2025 and 2035
  • Figure 5: Global Market Y-o-Y Growth Comparison by Number of Heads, 2025-2035
  • Figure 6: Global Market Attractiveness Analysis by Number of Heads
  • Figure 7: Global Market Value Share and BPS Analysis by Machine Type, 2025 and 2035
  • Figure 8: Global Market Y-o-Y Growth Comparison by Machine Type, 2025-2035
  • Figure 9: Global Market Attractiveness Analysis by Machine Type
  • Figure 10: Global Market Value Share and BPS Analysis by Machine Output, 2025 and 2035
  • Figure 11: Global Market Y-o-Y Growth Comparison by Machine Output, 2025-2035
  • Figure 12: Global Market Attractiveness Analysis by Machine Output
  • Figure 13: Global Market Value Share and BPS Analysis by Maximum Weight Measurement, 2025 and 2035
  • Figure 14: Global Market Y-o-Y Growth Comparison by Maximum Weight Measurement, 2025-2035
  • Figure 15: Global Market Attractiveness Analysis by Maximum Weight Measurement
  • Figure 16: Global Market Value Share and BPS Analysis by End Use, 2025 and 2035
  • Figure 17: Global Market Y-o-Y Growth Comparison by End Use, 2025-2035
  • Figure 18: Global Market Attractiveness Analysis by End Use
  • Figure 19: Global Market Value (USD Million) Share and BPS Analysis by Region, 2025 and 2035
  • Figure 20: Global Market Y-o-Y Growth Comparison by Region, 2025-2035
  • Figure 21: Global Market Attractiveness Analysis by Region
  • Figure 22: North America Market Incremental $ Opportunity, 2025-2035
  • Figure 23: Latin America Market Incremental $ Opportunity, 2025-2035
  • Figure 24: Western Europe Market Incremental $ Opportunity, 2025-2035
  • Figure 25: Eastern Europe Market Incremental $ Opportunity, 2025-2035
  • Figure 26: East Asia Market Incremental $ Opportunity, 2025-2035
  • Figure 27: South Asia & Pacific Market Incremental $ Opportunity, 2025-2035
  • Figure 28: Middle East and Africa Market Incremental $ Opportunity, 2025-2035
  • Figure 29: North America Market Value Share and BPS Analysis by Country, 2025 and 2035
  • Figure 30: North America Market Value Share and BPS Analysis by Number of Heads, 2025 and 2035
  • Figure 31: North America Market Y-o-Y Growth Comparison by Number of Heads, 2025-2035
  • Figure 32: North America Market Attractiveness Analysis by Number of Heads
  • Figure 33: North America Market Value Share and BPS Analysis by Machine Type, 2025 and 2035
  • Figure 34: North America Market Y-o-Y Growth Comparison by Machine Type, 2025-2035
  • Figure 35: North America Market Attractiveness Analysis by Machine Type
  • Figure 36: North America Market Value Share and BPS Analysis by Machine Output, 2025 and 2035
  • Figure 37: North America Market Y-o-Y Growth Comparison by Machine Output, 2025-2035
  • Figure 38: North America Market Attractiveness Analysis by Machine Output
  • Figure 39: North America Market Value Share and BPS Analysis by Maximum Weight Measurement, 2025 and 2035
  • Figure 40: North America Market Y-o-Y Growth Comparison by Maximum Weight Measurement, 2025-2035
  • Figure 41: North America Market Attractiveness Analysis by Maximum Weight Measurement
  • Figure 42: North America Market Value Share and BPS Analysis by End Use, 2025 and 2035
  • Figure 43: North America Market Y-o-Y Growth Comparison by End Use, 2025-2035
  • Figure 44: North America Market Attractiveness Analysis by End Use
  • Figure 45: Latin America Market Value Share and BPS Analysis by Country, 2025 and 2035
  • Figure 46: Latin America Market Value Share and BPS Analysis by Number of Heads, 2025 and 2035
  • Figure 47: Latin America Market Y-o-Y Growth Comparison by Number of Heads, 2025-2035
  • Figure 48: Latin America Market Attractiveness Analysis by Number of Heads
  • Figure 49: Latin America Market Value Share and BPS Analysis by Machine Type, 2025 and 2035
  • Figure 50: Latin America Market Y-o-Y Growth Comparison by Machine Type, 2025-2035
  • Figure 51: Latin America Market Attractiveness Analysis by Machine Type
  • Figure 52: Latin America Market Value Share and BPS Analysis by Machine Output, 2025 and 2035
  • Figure 53: Latin America Market Y-o-Y Growth Comparison by Machine Output, 2025-2035
  • Figure 54: Latin America Market Attractiveness Analysis by Machine Output
  • Figure 55: Latin America Market Value Share and BPS Analysis by Maximum Weight Measurement, 2025 and 2035
  • Figure 56: Latin America Market Y-o-Y Growth Comparison by Maximum Weight Measurement, 2025-2035
  • Figure 57: Latin America Market Attractiveness Analysis by Maximum Weight Measurement
  • Figure 58: Latin America Market Value Share and BPS Analysis by End Use, 2025 and 2035
  • Figure 59: Latin America Market Y-o-Y Growth Comparison by End Use, 2025-2035
  • Figure 60: Latin America Market Attractiveness Analysis by End Use
  • Figure 61: Western Europe Market Value Share and BPS Analysis by Country, 2025 and 2035
  • Figure 62: Western Europe Market Value Share and BPS Analysis by Number of Heads, 2025 and 2035
  • Figure 63: Western Europe Market Y-o-Y Growth Comparison by Number of Heads, 2025-2035
  • Figure 64: Western Europe Market Attractiveness Analysis by Number of Heads
  • Figure 65: Western Europe Market Value Share and BPS Analysis by Machine Type, 2025 and 2035
  • Figure 66: Western Europe Market Y-o-Y Growth Comparison by Machine Type, 2025-2035
  • Figure 67: Western Europe Market Attractiveness Analysis by Machine Type
  • Figure 68: Western Europe Market Value Share and BPS Analysis by Machine Output, 2025 and 2035
  • Figure 69: Western Europe Market Y-o-Y Growth Comparison by Machine Output, 2025-2035
  • Figure 70: Western Europe Market Attractiveness Analysis by Machine Output
  • Figure 71: Western Europe Market Value Share and BPS Analysis by Maximum Weight Measurement, 2025 and 2035
  • Figure 72: Western Europe Market Y-o-Y Growth Comparison by Maximum Weight Measurement, 2025-2035
  • Figure 73: Western Europe Market Attractiveness Analysis by Maximum Weight Measurement
  • Figure 74: Western Europe Market Value Share and BPS Analysis by End Use, 2025 and 2035
  • Figure 75: Western Europe Market Y-o-Y Growth Comparison by End Use, 2025-2035
  • Figure 76: Western Europe Market Attractiveness Analysis by End Use
  • Figure 77: Eastern Europe Market Value Share and BPS Analysis by Country, 2025 and 2035
  • Figure 78: Eastern Europe Market Value Share and BPS Analysis by Number of Heads, 2025 and 2035
  • Figure 79: Eastern Europe Market Y-o-Y Growth Comparison by Number of Heads, 2025-2035
  • Figure 80: Eastern Europe Market Attractiveness Analysis by Number of Heads
  • Figure 81: Eastern Europe Market Value Share and BPS Analysis by Machine Type, 2025 and 2035
  • Figure 82: Eastern Europe Market Y-o-Y Growth Comparison by Machine Type, 2025-2035
  • Figure 83: Eastern Europe Market Attractiveness Analysis by Machine Type
  • Figure 84: Eastern Europe Market Value Share and BPS Analysis by Machine Output, 2025 and 2035
  • Figure 85: Eastern Europe Market Y-o-Y Growth Comparison by Machine Output, 2025-2035
  • Figure 86: Eastern Europe Market Attractiveness Analysis by Machine Output
  • Figure 87: Eastern Europe Market Value Share and BPS Analysis by Maximum Weight Measurement, 2025 and 2035
  • Figure 88: Eastern Europe Market Y-o-Y Growth Comparison by Maximum Weight Measurement, 2025-2035
  • Figure 89: Eastern Europe Market Attractiveness Analysis by Maximum Weight Measurement
  • Figure 90: Eastern Europe Market Value Share and BPS Analysis by End Use, 2025 and 2035
  • Figure 91: Eastern Europe Market Y-o-Y Growth Comparison by End Use, 2025-2035
  • Figure 92: Eastern Europe Market Attractiveness Analysis by End Use
  • Figure 93: East Asia Market Value Share and BPS Analysis by Country, 2025 and 2035
  • Figure 94: East Asia Market Value Share and BPS Analysis by Number of Heads, 2025 and 2035
  • Figure 95: East Asia Market Y-o-Y Growth Comparison by Number of Heads, 2025-2035
  • Figure 96: East Asia Market Attractiveness Analysis by Number of Heads
  • Figure 97: East Asia Market Value Share and BPS Analysis by Machine Type, 2025 and 2035
  • Figure 98: East Asia Market Y-o-Y Growth Comparison by Machine Type, 2025-2035
  • Figure 99: East Asia Market Attractiveness Analysis by Machine Type
  • Figure 100: East Asia Market Value Share and BPS Analysis by Machine Output, 2025 and 2035
  • Figure 101: East Asia Market Y-o-Y Growth Comparison by Machine Output, 2025-2035
  • Figure 102: East Asia Market Attractiveness Analysis by Machine Output
  • Figure 103: East Asia Market Value Share and BPS Analysis by Maximum Weight Measurement, 2025 and 2035
  • Figure 104: East Asia Market Y-o-Y Growth Comparison by Maximum Weight Measurement, 2025-2035
  • Figure 105: East Asia Market Attractiveness Analysis by Maximum Weight Measurement
  • Figure 106: East Asia Market Value Share and BPS Analysis by End Use, 2025 and 2035
  • Figure 107: East Asia Market Y-o-Y Growth Comparison by End Use, 2025-2035
  • Figure 108: East Asia Market Attractiveness Analysis by End Use
  • Figure 109: South Asia & Pacific Market Value Share and BPS Analysis by Country, 2025 and 2035
  • Figure 110: South Asia & Pacific Market Value Share and BPS Analysis by Number of Heads, 2025 and 2035
  • Figure 111: South Asia & Pacific Market Y-o-Y Growth Comparison by Number of Heads, 2025-2035
  • Figure 112: South Asia & Pacific Market Attractiveness Analysis by Number of Heads
  • Figure 113: South Asia & Pacific Market Value Share and BPS Analysis by Machine Type, 2025 and 2035
  • Figure 114: South Asia & Pacific Market Y-o-Y Growth Comparison by Machine Type, 2025-2035
  • Figure 115: South Asia & Pacific Market Attractiveness Analysis by Machine Type
  • Figure 116: South Asia & Pacific Market Value Share and BPS Analysis by Machine Output, 2025 and 2035
  • Figure 117: South Asia & Pacific Market Y-o-Y Growth Comparison by Machine Output, 2025-2035
  • Figure 118: South Asia & Pacific Market Attractiveness Analysis by Machine Output
  • Figure 119: South Asia & Pacific Market Value Share and BPS Analysis by Maximum Weight Measurement, 2025 and 2035
  • Figure 120: South Asia & Pacific Market Y-o-Y Growth Comparison by Maximum Weight Measurement, 2025-2035
  • Figure 121: South Asia & Pacific Market Attractiveness Analysis by Maximum Weight Measurement
  • Figure 122: South Asia & Pacific Market Value Share and BPS Analysis by End Use, 2025 and 2035
  • Figure 123: South Asia & Pacific Market Y-o-Y Growth Comparison by End Use, 2025-2035
  • Figure 124: South Asia & Pacific Market Attractiveness Analysis by End Use
  • Figure 125: Middle East and Africa Market Value Share and BPS Analysis by Country, 2025 and 2035
  • Figure 126: Middle East and Africa Market Value Share and BPS Analysis by Number of Heads, 2025 and 2035
  • Figure 127: Middle East and Africa Market Y-o-Y Growth Comparison by Number of Heads, 2025-2035
  • Figure 128: Middle East and Africa Market Attractiveness Analysis by Number of Heads
  • Figure 129: Middle East and Africa Market Value Share and BPS Analysis by Machine Type, 2025 and 2035
  • Figure 130: Middle East and Africa Market Y-o-Y Growth Comparison by Machine Type, 2025-2035
  • Figure 131: Middle East and Africa Market Attractiveness Analysis by Machine Type
  • Figure 132: Middle East and Africa Market Value Share and BPS Analysis by Machine Output, 2025 and 2035
  • Figure 133: Middle East and Africa Market Y-o-Y Growth Comparison by Machine Output, 2025-2035
  • Figure 134: Middle East and Africa Market Attractiveness Analysis by Machine Output
  • Figure 135: Middle East and Africa Market Value Share and BPS Analysis by Maximum Weight Measurement, 2025 and 2035
  • Figure 136: Middle East and Africa Market Y-o-Y Growth Comparison by Maximum Weight Measurement, 2025-2035
  • Figure 137: Middle East and Africa Market Attractiveness Analysis by Maximum Weight Measurement
  • Figure 138: Middle East and Africa Market Value Share and BPS Analysis by End Use, 2025 and 2035
  • Figure 139: Middle East and Africa Market Y-o-Y Growth Comparison by End Use, 2025-2035
  • Figure 140: Middle East and Africa Market Attractiveness Analysis by End Use
  • Figure 141: Global Market - Tier Structure Analysis
  • Figure 142: Global Market - Company Share Analysis

Frequently Asked Questions

How big is the multihead weighers market in 2025?

The global multihead weighers market is estimated to be valued at USD 256.8 million in 2025.

What will be the size of the multihead weighers market in 2035?

The market size for multihead weighers is projected to reach USD 365.8 million by 2035.

What is the projected growth rate of the multihead weighers market from 2025 to 2035?

The multihead weighers market is expected to grow at a CAGR of 3.6% between 2025 and 2035.

Which machine type leads the multihead weighers market in 2025?

Rotary machines dominate the market with an 80% share in 2025, due to high-speed capabilities, ease of maintenance, and suitability for large-scale operations.

Which machine output segment is the most prominent in the multihead weighers market?

Machines with output between 71 PPM to 140 PPM hold 40% share, balancing speed and accuracy for mid-to-large scale food and FMCG packaging applications.

Explore Similar Insights

Future Market Insights

Multihead Weighers Market

Chat With

MaRIA

Hi There, I am MaRIA, Your Market Research Intelligence Assistant. How may I help you?