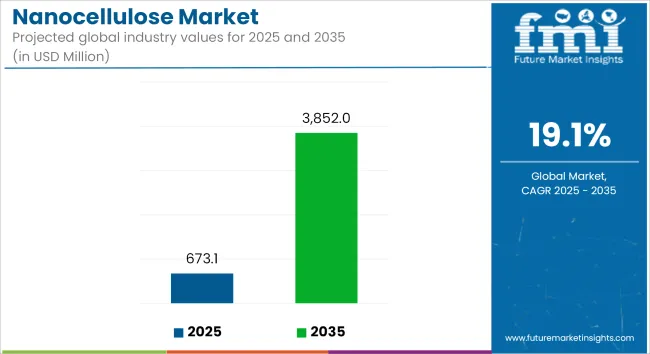
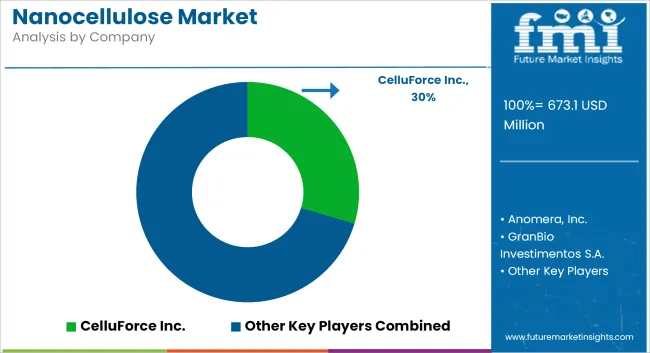
The global nanocellulose market is estimated at USD 673.1 million in 2025 and is forecast to expand to USD 3,852 million by 2035, advancing at a CAGR of 19.1% during the forecast period. Growth is being driven by the replacement of petroleum-based materials with biodegradable, lightweight, and renewable alternatives in packaging, coatings, and composite applications.
| Metrics | Values |
|---|---|
| Industry Size (2025E) | USD 673.1 million |
| Industry Value (2035F) | USD 3,852 million |
| CAGR | 19.1% |
Nanocellulose is being adopted across multiple sectors for its high strength-to-weight ratio, biodegradability, and superior barrier properties. In packaging, it is being incorporated into films and multilayer laminates to enhance shelf-life while complying with food safety and sustainability requirements. In paper coatings and printing applications, nanocellulose is being used to improve mechanical performance, reduce ink consumption, and support recyclable substrates.
In automotive and construction sectors, nanocellulose is being integrated into polymers and cementitious matrices as a lightweight reinforcement material. These applications are enabling manufacturers to reduce material usage while improving product strength and lifecycle emissions performance. The growing alignment of industrial sectors with environmental targets is expected to support continued adoption of nanocellulose-based components.
Government-backed bioeconomy policies and increasing consumer preference for green materials are supporting rapid market expansion in Asia-Pacific. In parallel, regulatory initiatives in Europe and North America are accelerating industrial shifts toward renewable, non-toxic material inputs across packaging and structural materials.
Sustainability objectives are also influencing upstream value chains. Efforts are being made by chemical formulators to ensure compatibility between nanocellulose and environmentally friendly treatment agents. For instance, coagulants and anti-scalants used in processing and wastewater recovery are being reformulated with bio-based inputs, enabling more sustainable nanocellulose production ecosystems.
The demand for green additives is also reflected in the rising application of nanocellulose in advanced filtration membranes and electronic substrates, where recyclability and biodegradability are required alongside technical performance.
The nanocellulose market is projected to maintain strong growth through 2035, supported by innovation in material engineering, compliance with green regulations, and industrial shifts toward circular manufacturing strategies. Its cross-sector applicability is expected to further enhance its role in the transition to sustainable material systems.
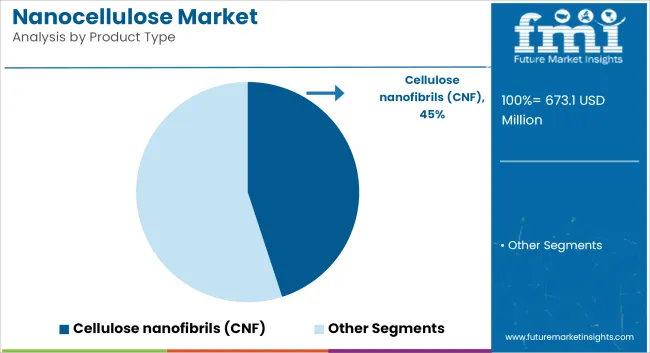
Cellulose nanofibrils (CNF) are projected to hold 45% of the global nanocellulose market share in 2025 and are expected to expand at a CAGR of 19.4% through 2035. CNFs are derived from plant fibers and are known for their high aspect ratio, tensile strength, and surface area. These properties make them well-suited for reinforcing materials in composites, thickening agents in pharmaceuticals, and additives in paper coatings.
Their rheological behavior is leveraged in personal care formulations and 3D bioprinting applications. Production technologies such as TEMPO-mediated oxidation and enzymatic hydrolysis are increasingly adopted to improve yield and energy efficiency. CNFs are also gaining traction in packaging films, where their low oxygen permeability supports food shelf-life extension.
Manufacturers are exploring CNFs as sustainable alternatives to synthetic polymers in automotive panels and industrial sealants. With growing investment in bio-based product development, CNFs are anticipated to remain a dominant nanocellulose type over the forecast period.
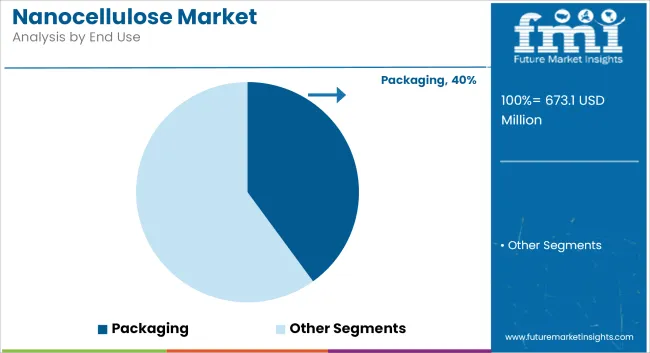
The packaging sector is expected to lead nanocellulose applications with a market share of 40% in 2025, growing at a CAGR of 19.7% through 2035. Nanocellulose materials-particularly cellulose nanofibrils (CNF) and cellulose nanocrystals (CNC)—offer excellent gas and moisture barrier properties, making them attractive for use in flexible and rigid packaging.
These characteristics are essential for food and pharmaceutical packaging, where spoilage prevention and shelf-life extension are key. Companies are integrating nanocellulose into coatings for paperboard, films, and multilayer laminates, with a focus on replacing conventional plastics. Nanocellulose also supports compostability and recyclability, helping brands meet sustainability targets.
Collaborations between nanocellulose producers and large packaging firms are increasing, particularly in Europe and North America, where environmental regulations are more stringent. Several pilot-scale projects are underway to scale up nanocellulose use in beverage cartons and snack wrappers. The demand for lightweight, biodegradable, and high-barrier materials is expected to accelerate market growth.
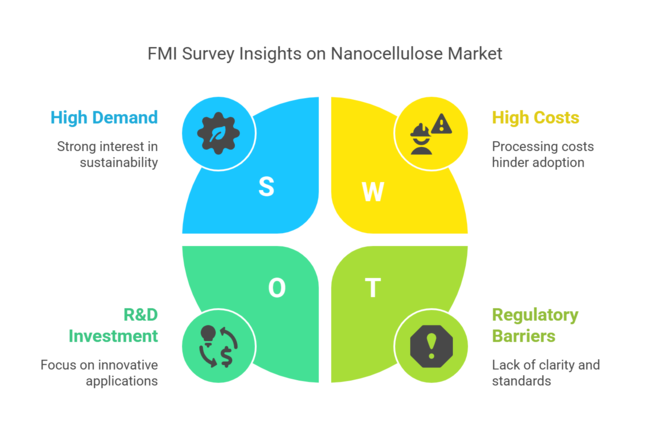
The nanocellulose industry has been undertaking robust growth, fueled by growing demand for high-performance, sustainable materials in the packaging, biomedical, and electronics sectors. The prime driver is its exclusive combination of mechanical strength and biodegradability, making it a preferred substitute for synthetic composites and plastics. The companies that invest in green materials and cutting-edge manufacturing will be the greatest beneficiaries, whereas the conventional plastic manufacturers can be expected to be displaced in the long term.
To stay competitive in the rapidly evolving nanocellulose market, stakeholders must prioritize three strategic imperatives. First, they should invest in scalable, sustainable manufacturing capacity to meet growing demand, particularly in packaging and biomedicine, while maintaining cost-efficiency and supply reliability.
Second, aligning product development with high-growth applications-such as medical hydrogels, flexible electronics, and food packaging-will allow companies to anticipate client needs and stay ahead of regulatory shifts focused on safety and sustainability.
Third, forging strategic partnerships or pursuing M&A with tech innovators specializing in nanocellulose functionalization and advanced composites can fast-track market entry, diversify product portfolios, and deliver intellectual property advantages in niche, high-value segments.
| Risk | Probability - Impact |
|---|---|
| High production costs limiting scalability and pricing competitiveness | Medium - High |
| Regulatory uncertainties around nanomaterials in food and medical use | Low - Medium |
| Supply chain bottlenecks for raw cellulose and specialized equipment | Medium - Medium |
| Priority | Immediate Action |
|---|---|
| Evaluate Production Viability | Run a feasibility study on scaling low-cost nanocellulose manufacturing across regions. |
| Align with End-User Demands | Initiate OEM and end-user feedback loop on packaging and biomedical application needs. |
| Strengthen Industry Access | Launch channel partner incentive pilot for distribution in Asia-Pacific and Europe |
The client should promptly focus on scaling up sustainable nanocellulose manufacturing and aligning innovation pipelines with quick-maturing applications in electronics, healthcare, and packaging. This insight emphasizes a critical inflection point-where early players can secure industry share and establish industry standards with the tightening of global sustainability regulations.
The roadmap needs to change from exploratory R&D to execution-driven investments, such as focused partnerships with biotech and materials science innovators, and strategic expansion in high-growth industries like Asia-Pacific. The time is now to lead, not follow-before cost, capacity, or compliance constraints harden and shrink the competitive window.
| Country/Region | Regulatory Impact & Certification Requirements |
|---|---|
| United States |
|
| European Union |
|
| Japan |
|
| South Korea |
|
| India |
|
The USA nanocellulose industry is driven by the robust adoption of sustainable packaging, composites, and biomedical applications. Clarity in regulations from the FDA and EPA is slowly increasing, enhancing investor confidence. Top universities and national laboratories, including Oak Ridge, are leading research commercialization.
Consumer pressure for biodegradable plastics alternatives is driving large FMCG brands to test nanocellulose packaging. The US military is also investigating nanocellulose for lightweightarmor and aerogels, which may drive significant public sector demand.
However, cost competitiveness against petroleum-derived materials is still an obstacle. Strategic partnerships among pulp manufacturers and biotech entrepreneurs are facilitating up-scaling of production, particularly in the Midwest and Pacific Northwest. Startups dedicated to advanced composites are attracting venture capital, suggesting increased confidence in long-term adoption.
FMI opines that United States nanocellulose sales are likely to expand at a CAGR of 18.2% during the projection period between 2025 and 2035.
India's nanocellulose industry is in its infancy but holds great promise, mainly in agriculture, textiles, and low-cost medical devices. The government's "National Mission on Nano Science & Technology" has increased funding, and IITs are working with state-owned paper mills to investigate industrial-scale CNF production.
Novel to India is the utilization of agro-waste (e.g., sugarcane bagasse, jute) as feedstock, lowering costs and guaranteeing local supply. Private sector demand is increasing for utilizing nanocellulose in water purification membranes and biodegradable sanitary items.
Export prospects, especially to the European industry, are also opening up with domestic manufacturers conforming to REACH standards. Limited regulatory transparency and lack of nanomaterial-specific safety legislation continue to be issues despite BIS working on guidelines.
FMI opines that India’s nanocellulose sales are likely to expand at a CAGR of 20.3% during the projection period between 2025 and 2035.
China leads the world in nanocellulose production by volume due to active state-sponsored innovation and vertical integration with its enormous pulp and paper sector. Key state-owned players are investing in nanocellulose-based textiles, construction additives, and electronics substrates. Nanomaterials are designated as key areas for R&D in the government's 14th Five-Year Plan, and it is pushing academic studies and industrial deployment at a breakneck pace. China is placing a strong emphasis on CNC (nanocrystals) for applications in light car components and flexible displays.
The West places less emphasis on sustainability labeling and more on performance measures and export value. Domestic electronics and packaging industries offer plenty of application areas, and favorable export policies could drive them to dominate international nanocellulose trade.
FMI opines that China’s nanocellulose sales are likely to expand at a CAGR of 19.6% during the projection period between 2025 and 2035.
The UK nanocellulose industry is defined by its innovation-driven, niche-oriented strategy, particularly in biomedical engineering, cosmetic ingredients, and eco-friendly packaging. Universities such as the University of Cambridge and Imperial College London are aggressively spinning out businesses that concentrate on nanocellulose hydrogels and skin-delivery systems. Brexit has caused regulatory divergence from the EU, allowing UK startups to have more space to tinker under changing MHRA regimes.
Also, significant investment in life sciences and green chemistry is a nurturing environment. UK premium cosmetic and FMCG brands are early embracers of nanocellulose films for biodegradable packaging. Government grant schemes like Innovate UK are increasingly financing nanomaterial scale-up projects.
FMI opines that the United Kingdom’s nanocellulose sales are likely to expand at a CAGR of 18.7% during the projection period between 2025 and 2035.
Germany is the EU's leader in nanocellulose uptake, with a strong emphasis on high-performance materials for the automotive, packaging, and electronics industries. Close institutional links among Fraunhofer Institutes and industry facilitate quick scale-up of research into product ranges.
Its ambitious carbon cut targets and extended producer responsibility (EPR) regulations are compelling manufacturers to replace plastics with bio-based ones such as nanocellulose. Germany also espouses circular economy concepts, hence the natural base for green composites.
There is growing application of nanocellulose in injection-molded materials and biopolymer blends by manufacturers. EV platforms are also being investigated as lightweight reinforcing material by car part suppliers with nanocellulose.
FMI opines that Germany’s nanocellulose sales are likely to expand at a CAGR of 19.3% during the projection period between 2025 and 2035.
South Korea's nanocellulose sector is picking up pace with high-tech and bio-electronic uses. State-sponsored programs like the "Green New Deal" have raised the profile of green nanomaterials. Leading universities and conglomerates such as LG Chem are researching bacterial nanocellulose for application in smart wearable sensors and see-through flexible displays.
South Korea is also alone in producing nanocellulose films for food-contact applications based on steam-treated bamboo. Restricted natural pulp resources are driving innovation in synthetic fermentation and recycling pathways. The regulatory environment, while stringent, is transparent and rapid, facilitating rapid commercialization of conforming products.
FMI opines that South Korea’s nanocellulose sales are likely to expand at a CAGR of 19.5% during the projection period between 2025 and 2035.
Japan's nanocellulose industry is influenced by its high-precision manufacturing culture and government-promoted R&D in institutions such as NEDO. Japan leads in bacterial cellulose usage, particularly in medical bandages, sound diaphragms, and precision coatings. Auto majors such as Toyota are using nanocellulose-strengthened plastics to minimize car weight, with 20% gains in fuel efficiency reported.
Land-constrained Japan promotes miniaturized, modular nanocellulose manufacturing units, frequently placed within university-industry collaboration complexes. However high production expenses and a risk-averse business culture hinder full-scale commercialization. Nevertheless, Japan's emphasis on functional material quality provides it with a competitive advantage in the specialized export industry.
FMI opines that Japan’s nanocellulose sales are likely to expand at a CAGR of 18.1% during the projection period between 2025 and 2035.
France's nanocellulose environment is being molded by its assertive position on plastic substitutes, supported by the Anti-Waste Law for a Circular Economy. French companies are incorporating nanocellulose into biodegradable packaging, coatings, and food packaging as they gear up for EU single-use plastic bans.
The country is also a leader in biopharmaceutical applications, specifically in topical wound treatment and drug delivery carriers. Public-private partnerships with CNRS and INRAE have promoted lab-to-industry developments.
France is also investing in agricultural waste valorization, converting grape pomace and wheat straw to cellulose feedstock. Direct incentives for biobased innovation are provided by the government under the France 2030 plan.
FMI opines that France’s nanocellulose sales are likely to expand at a CAGR of 19.2% during the projection period between 2025 and 2035.
Italy's nanocellulose sector is driven by demand for high-end packaging, furniture coatings, and textile treatments. Fashion and design industries are testing nanocellulose finishes on biodegradable, breathable fabrics.
Paper mills in Tuscany and Lombardy are retrofitted with the ability to convert traditional mills into CNF-ready facilities. Italy's innovation clusters for green chemistry-particularly the one around Milan-are creating the conditions for startup development.
The incentives from the government under the "Transition 4.0" initiative involve tax credits for industrial-scale nanomaterials, with an encouragement of SME adoption. Italian regulators are also harmonizing with EU REACH to support exports, especially to Germany and France.
FMI opines that Italy’s nanocellulose sales are likely to expand at a CAGR of 19.0% during the projection period between 2025 and 2035.
Australia and New Zealand are building a niche, forestry residue-use-orientated, sustainability-driven nanocellulose industry with a focus on forestry residues as a resource. CSIRO and Scion have leading programs in place to retrieve nanocellulose from eucalypt and pine waste materials. End applications encompass personal care formulations, pharmaceutical packages, and barrier food films.
Australia's geographic proximity to Asian industries positions it as a strategic export hub, whereas New Zealand is industrying its nanocellulose as "clean-tech" to attract environmentally friendly European consumers. Policy environments are favorable, particularly under Australia's National Waste Policy Action Plan. Scale is still an issue due to relatively small domestic industries.
FMI opines that Australia-New Zealand nanocellulose sales are likely to expand at a CAGR of 18.6% during the projection period between 2025 and 2035.
The nanocellulose market is evolving through innovation and collaboration. Key producers like Stora Enso, Nippon Paper, Borregaard, Daicel, and CelluForce are investing in pilot manufacturing facilities and partnerships with packaging and paper industries. R&D efforts focus on cost-effective processing, high-throughput production, and composite integration.
Strategic collaborations with automotive, cosmetics, and biomedical firms are expanding end-use utilization. Regional players in Europe and North America are building demonstration plants, while Asia-Pacific companies are entering through joint ventures and government-backed bioeconomy grants. The competitive environment is built around production cost, sustainability credentials, and alignment with end-user innovation strategies.
Cellulose Nanofibrils (CNF), Cellulose Nanocrystals (CNC), Bacterial Nanocellulose (BNC)
Packaging, Paper, Composites, Food Ingredients, Cosmetics and Personal Care, Textiles, Electronic Devices, Pharmaceutical and Biomedical, Others
North America, Latin America, Europe, East Asia, South Asia and Pacific, Middle East and Africa
Nanocellulose is a material derived from plant fibers, known for its strength and lightweight properties.
It is used in packaging, composites, electronics, and pharmaceuticals, among others.
It is produced through mechanical, chemical, or biological processes that break down cellulose fibers into nanoscale structures.
Industries like packaging, textiles, automotive, and healthcare benefit from its unique properties.
The demand for nanocellulose is expected to grow due to its eco-friendly nature and versatility in various industries.


Full Research Suite comprises of:
Market outlook & trends analysis
Interviews & case studies
Strategic recommendations
Vendor profiles & capabilities analysis
5-year forecasts
8 regions and 60+ country-level data splits
Market segment data splits
12 months of continuous data updates
DELIVERED AS:
PDF EXCEL ONLINE
Nanocellulose Coating Market Analysis - Size and Share Forecast Outlook 2025 to 2035
Nanocellulose Barrier Coating Market Analysis - Size and Share Forecast Outlook 2025 to 2035

Thank you!
You will receive an email from our Business Development Manager. Please be sure to check your SPAM/JUNK folder too.
Chat With
MaRIA