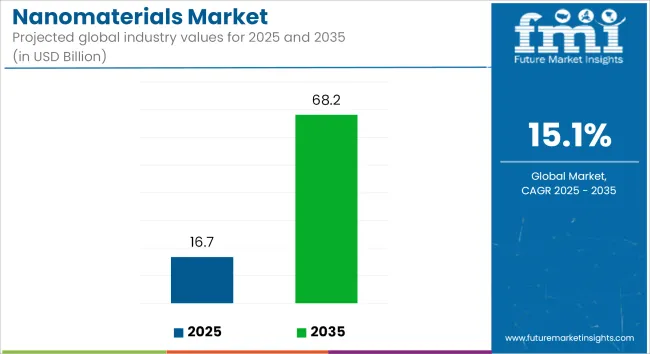
The global nanomaterials market is estimated to be valued at USD 16.7 billion in 2025 and is forecast to grow to USD 68.2 billion by 2035, advancing at a CAGR of 15.1% during the forecast period. Market expansion is being driven by increasing integration of nanotechnology across sectors such as healthcare, electronics, energy, and advanced materials, where nanoscale performance enhancements are enabling transformational innovation.
| Metrics | Values |
|---|---|
| Industry Size (2025E) | USD 16.7 billion |
| Industry Value (2035F) | USD 68.2 billion |
| CAGR (2025 to 2035) | 15.1% |
Nanomaterials are being utilized to provide superior mechanical strength, enhanced electrical and thermal conductivity, increased reactivity, and improved biocompatibility in various industrial applications. In healthcare, nanomaterials are being incorporated into diagnostics, drug delivery systems, and regenerative medicine.
Their ability to enhance drug solubility, target specificity, and controlled release kinetics is supporting advances in precision medicine and personalized therapies. Functionalized nanoparticles are also being applied in imaging modalities to improve disease detection accuracy at early stages.
In electronics, nanomaterials are being adopted in the fabrication of transistors, printed circuitry, conductive inks, and display panels. Their role in enabling miniaturization, flexible device structures, and low-energy consumption is supporting next-generation consumer and industrial electronics. Graphene, carbon nanotubes, and metal oxide nanoparticles are being developed to enhance performance in high-frequency and wearable electronics.
Energy storage and conversion technologies are also being transformed through the use of nanomaterials in battery electrodes, fuel cell membranes, and solar photovoltaic layers. Improvements in charge mobility, catalytic activity, and thermal stability are contributing to longer operational lifespans and improved energy efficiency in portable and grid-scale systems.
Sustainability objectives are further accelerating adoption in environmental applications. Nanomaterials are being incorporated into water filtration membranes, air purification systems, and antimicrobial packaging films. Their high surface area and reactivity allow for effective contaminant removal and reduced material consumption.
With rising demand for lightweight, multifunctional, and durable material systems, nanomaterials are expected to remain central to material innovation. The Asia-Pacific region is projected to lead global demand, supported by strategic R&D funding, nanotech commercialization initiatives, and strong manufacturing infrastructure.
The nanomaterials market is expected to maintain high growth momentum through 2035, supported by continued technological breakthroughs and cross-sector application diversification
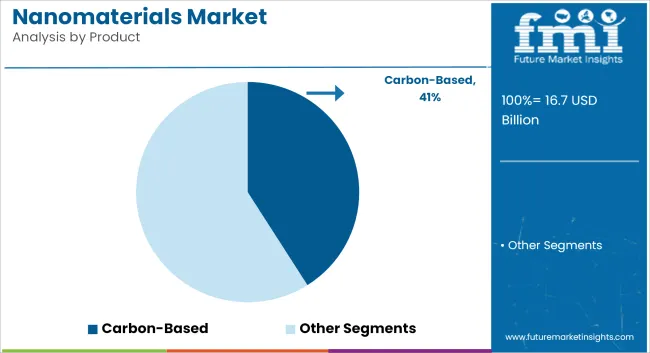
Carbon-based nanomaterials-primarily including carbon nanotubes (CNTs), graphene, and fullerenes-are expected to account for approximately 41% of the global nanomaterials market by 2025, and are projected to grow at a CAGR of 11.6% between 2025 and 2035, driven by their unique combination of high electrical conductivity, mechanical strength, and thermal stability.
These properties make them highly suitable for applications in electronics, sensors, aerospace components, and energy storage systems. In electronics, graphene is being widely explored for transparent conductive films, transistors, and next-gen flexible displays. Carbon nanotubes, due to their exceptional tensile strength and low weight, are increasingly used in structural composites and lithium-ion battery electrodes to improve charge mobility and cycle life.
Super capacitors and fuel cells also benefit from their large surface area and electron mobility. The continued push for lightweight, miniaturized, and energy-efficient devices is accelerating investments in carbon-based nanomaterials. Additionally, scalable production methods and functionalization technologies are making these materials more commercially viable, cementing their role in future materials innovation.
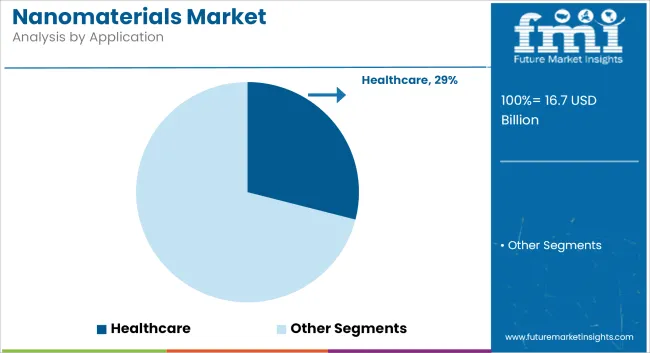
The healthcare industry is emerging as a key consumer of nanomaterials, projected to hold 29% of market share in 2025, with demand expanding at a CAGR of 15.6% through 2035. Nanomaterials are revolutionizing drug delivery systems by enabling targeted and controlled release of therapeutic agents, especially in oncology and immunotherapy.
Their nanoscale size allows them to navigate biological barriers and deliver drugs directly to affected tissues, reducing side effects and improving efficacy. They are also increasingly used as contrast agents in diagnostic imaging, significantly enhancing resolution in MRI, PET, and CT scans.
In regenerative medicine, nanomaterials facilitate cell growth and differentiation through their biomimetic surface properties and are used in scaffolds for tissue engineering. Additionally, their role in RNA-based therapies and vaccine delivery platforms has grown post-pandemic. With increasing funding in precision medicine and nanomedicine R&D, along with supportive regulatory frameworks, the healthcare sector is positioned as a leading and enduring application area for nanomaterials.
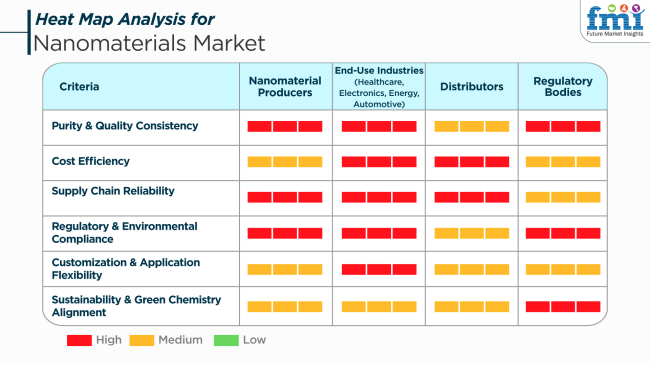
The industry is increasing at a rapid pace due to the increasing demand in industries such as healthcare, electronics, energy, and transportation. These materials are characterized by their unique properties at the nanoscale, are vital for product performance optimization and the creation of new applications.
In medicine, these materials find application in drug delivery and diagnostic devices; in electronics, they improve semiconductor and sensor performance; in energy, they help improve efficient batteries and solar cells; and in automotive, they help in manufacturing light-weight yet strong parts.Distributors focus on providing economical solutions and dependable supply chains that can fulfill the varied requirements of their customers. Distributors are instrumental in filling the gap between producers and final consumers by providing timely delivery and nanomaterial product availability.
Regulatory Organizations implement standards driving adoption of environment friendly and safe nanomaterials. These regulate the industry with rules and frameworks that facilitate effective implementation to maintain safety and efficiency of the used nanomaterials for diversified applications. The nanomaterial industry depicts a convergence towards developing and leveraging materials complying with performance requirements, environmental specifications, and accommodating shifting consumer expectations.
The industry is unstable to changes in raw material prices and the production cost. Instability in these costs has significant impacts on production costs and makes it difficult for producers to maintain competitive cost structures and therefore affect profit margins.
Stringent environmental and safety regulations pose major risks to business. Compliance with various regional regulations requires constant monitoring and adaptation. Failure to comply can result in legal problems and brand reputation loss, affecting industry share and customer trust.
Supply chain disruption, such as transport delays or geopolitical tension, can influence the timely supply of raw materials and finished products. Occasional disruption can cause production halts and deficiency in customer orders, hurting sales and long-term business relationships.
The sector is faced with the challenges of increased competition and technological evolution. Companies must invest in research and development to innovate and strengthen product offerings on a continuous basis. Otherwise, they risk becoming obsolete and losing industry share to more nimble competitors.
Relevance to major industries like electronics, healthcare, and energy implies that declines in these areas can have a direct effect on the demand. Diversifying the customer base among different industries can mitigate this.
| Countries | CAGR (2025 to 2035) |
|---|---|
| USA | 10.2% |
| UK | 8.1% |
| France | 7.8% |
| Germany | 8.5% |
| Italy | 7.3% |
| South Korea | 10.7% |
| Japan | 8.4% |
| China | 12.3% |
| Australia | 6.9% |
| New Zealand | 6.1% |
The USAindustry is anticipated to increase at a CAGR of 10.2% during 2025 to 2035, driven by strong R&D infrastructure and widespread uses in the aerospace, electronics, and biomedical sectors. Government funding and planned partnerships among universities, private enterprises, and national laboratories continue to drive innovation in engineered nanomaterials.
Key participants such as DuPont, Nanocomposix, and Arkema are investing in high-performance nanomaterial platforms to find use in drug delivery, advanced coatings, and energy storage. Applications in defense and environmental cleanup technologies are increasingly significant, with new opportunities for growth both in the public and private sectors.
The industry in the UK is projected to grow at a CAGR of 8.1% between 2025 and 2035. Growth is supported by industrial-academic collaboration and government-initiated frameworks for innovation in advanced materials. Domestic demand is being led by the rising application in life sciences, particularly diagnostics and imaging.
Leading companies such as Thomas Swan & Co., Haydale Graphene Industries, and Renishaw are building carbon nanomaterial and nano-additive manufacturing capacities. Green energy transitions and healthcare innovation are priority areas that the UK is targeting, providing important opportunities for nanomaterial-based technologies, particularly in solar cells, batteries, and biosensors.
France is anticipated to achieve a CAGR of 7.8% in the industry over the period from 2025 to 2035. Developments lead to growth in nanostructured coatings, catalysts, and nanocomposites applied across different automotive, aerospace, and pharmaceutical applications. National research institutes play a central role in transferring laboratory technologies to industrial scales.
Major players such as Arkema and Saint-Gobain are emphasizing sustainable paths of production as well as multifunctional design of materials. The demand is also emerging in cosmetic formulas and water purification technologies. Partnerships between industries across the EU strengthen France's regional value chains for high-precision nanomaterials.
Germany's industry is to expand at a CAGR of 8.5% through 2035, with the driving force being a strong engineering culture and emphasis on material technology innovation. High-end nanostructured material demand verticals include automotive production, electronics, and additive manufacturing.
Key players like BASF, Evonik Industries, and Bayer MaterialScience are heavily investing in nanomaterial research, especially in graphene, quantum dots, and nanoporous materials. Policy stimuli for Industry 4.0 technologies and circular economy frameworks also boost the industry. Germany is also aided by robust cross-sector collaborations that facilitate the rapid commercialization of new nanomaterial applications.
The Italian industry is expected to register a CAGR of 7.3% during the forecast period. It is increasing on the strength of demand from construction, textiles, and electronics, as well as the pharmaceutical sector. The need for nano-coated materials for construction and coating industries drives the broader application of nanotechnology in the creation of infrastructure.
Key players such as Colorobbia Group and Finceramica Faenza are investing in functional ceramics' applied nanotechnology and smart coatings. Italy also benefits from EU-sponsored projects on green nanotechnology and material recycling, which encourage local firms to integrate nanomaterials into product design for sustainable products.
South Korea is projected to be among the fastest-growing markets between 2025 and 2035, with a CAGR of 10.7%. A highly industrialized ecosystem leads the growth with vast experience in electronics, semiconductors, and display technologies. They are increasingly becoming critical in high-resolution imaging, sensors, and energy storage systems.
These companies consist of LG Chem, Samsung SDI, and Hanwha Solutions, being pioneers in the commercialization such as carbon nanotubes, nano-silicon, and conductive inks. Government backing for commercializing nano-enabled products promotes global competition and encourages investment in R&D infrastructure in the long term.
Japan's industry is expected to record a CAGR of 8.4% from 2025 to 2035. Technological maturity and established presence in life sciences and advanced electronics facilitate industry growth. The application is increasing in fuel cells, nanoelectronics, and functional food packaging.
Industry leaders such as Sumitomo Chemical, Mitsubishi Chemical, and Showa Denko continue to improve their portfolios through strategic R&D and international collaborations. The focus on energy efficiency and green performance is supplemented by the use in clean energy and sustainable coating, which helps create resilience in the industry.
China is likely to lead world growth in the industry at a CAGR of 12.3% during the forecast period. Government-led initiatives, as well as significant industrial demand along with enormous investment in nanotechnology infrastructure, drive development in applications ranging from energy to construction and biomedicine. Government-led initiatives also drive commercialization.
Industry leaders such as BYK Additives, Jiangsu Cnano Technology, and Beijing Dk Nano Technology are increasing their capacity to serve local as well as overseas industries. Leadership in supply chains for inorganic and nanocarbons positions China at the top of the global leadership table. Continued policy attention to frontier technologies attracts considerable private capital into the manufacture and study of the industry.
Australia's industry is projected to grow at a CAGR of 6.9% from 2025 to 2035. It possesses a robust start-up and research ecosystem in environmental nanotechnology and bio-nanomaterials. Applications in mining, water treatment, and agriculture are emerging as high-growth areas.
Key companies such as Antaria and Bluechiip are pioneering nano-enabled antimicrobial and diagnostic technologies. The national advanced manufacturing and clean energy strategy will drive demand for nanostructured materials in future manufacturing industries. Harmonization of regulatory environments with international standards makes commercial scale-up easier.
New Zealand is projected to exhibit a CAGR of 6.1% in the industry during the forecast period. Research-based efforts in nanobiotechnology and sustainable agriculture drive growth in the industry. Applications in food packaging and intelligent sensing technology have promising prospects.
Key advancements are made possible with the help of academic-industrial partnerships. Small companies are taking advantage of advancements in biodegradable nanocomposites and advanced diagnostics. While the industry size is limited, strategic concentration on life sciences and environmental applications ensures steady development in the field of nanomaterials.
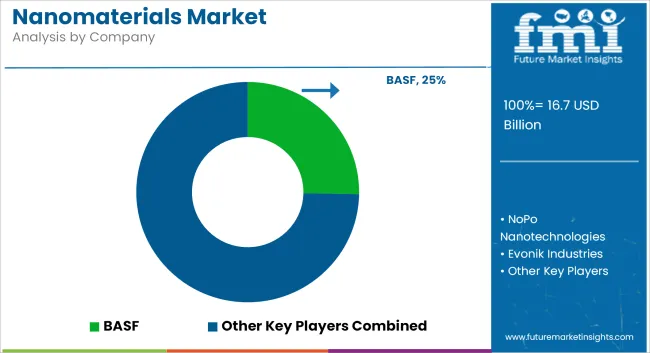
The nanomaterials market is intensely competitive, with global players like BASF, Arkema, Evonik, Cabot Corporation, and Showa Denko investing heavily in innovation, pilot-scale production, and nanomaterial functionalization technologies. Startups and academic institutions are also contributing to a highly dynamic innovation pipeline. Partnerships between nanotech developers and end-use industries-especially in biotech, semiconductors, and clean energy-are accelerating commercialization.
Companies are focusing on developing application-specific nanomaterials that deliver multifunctional performance such as antimicrobial, self-healing, or energy-efficient capabilities. As environmental and safety regulations around nanotechnology evolve, firms with advanced toxicology and lifecycle analysis capabilities are expected to gain a competitive edge.
The industry is segmented into carbon-based, metal-based, dendrimers-based, and composite segments.
The industry is segmented into transportation, electrical & electronics, healthcare, construction, packaging, consumer goods, and energy.
The industry is segmented into North America, Latin America, Western Europe, Eastern Europe, South Asia and Pacific, East Asia, and Middle East and Africa.
The global industry is estimated to be USD 16.7 billion in 2025.
Sales are projected to grow significantly, reaching USD 68.2 billion by 2035.
China is expected to experience a 12.3% CAGR.
The industry itself is experiencing growth, with strong demand for products like carbon nanotubes and nanocomposites, which are used in a variety of advanced applications.
Prominent companies include BASF, Evonik Industries, Bayer AG, SkySpring Nanomaterials, LG Chem, EMFUTUR Technologies, Sigma-Aldrich Co. LLC, Altair Nanotechnologies Inc., NANOCO TECHNOLOGIES LIMITED, and NANOCYL S.A.


Full Research Suite comprises of:
Market outlook & trends analysis
Interviews & case studies
Strategic recommendations
Vendor profiles & capabilities analysis
5-year forecasts
8 regions and 60+ country-level data splits
Market segment data splits
12 months of continuous data updates
DELIVERED AS:
PDF EXCEL ONLINE
Peptide Based Nanomaterials Market Size and Share Forecast Outlook 2025 to 2035

Thank you!
You will receive an email from our Business Development Manager. Please be sure to check your SPAM/JUNK folder too.
Chat With
MaRIA