Necrobiosis Lipoidica Diabeticorum Market
Market Insights on Necrobiosis Lipoidica Diabeticorum sales outlook, demand forecast & up-to-date key trends
Necrobiosis Lipoidica Diabeticorum (NLD) Market by Procedure, Application & Region – Forecast 2023–2033
Necrobiosis Lipoidica Diabeticorum (NLD) Market Snapshot (2023-2033)
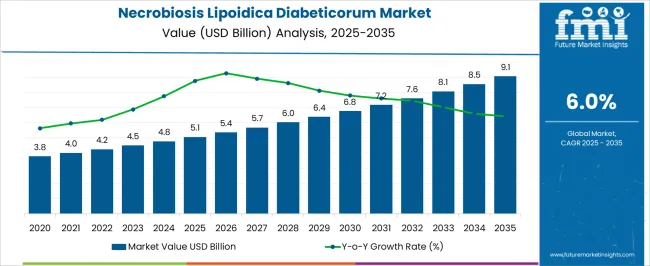
The global Necrobiosis Lipoidica Diabeticorum (NLD) market is expected to garner a market value of US$ 4.5 Billion in 2023 and is expected to accumulate a market value of US$ 8.06 Billion by registering a CAGR of 6% in the forecast period 2023-2033. The market for Necrobiosis Lipoidica Diabeticorum (NLD) registered a CAGR of 4% in the historical period 2017-2022.
An increase in the incidence of diabetes, as well as shifts in urbanization and sedentary lifestyle, are important factors driving the Necrobiosis Lipoidica Diabeticorum (NLD) market growth. Furthermore, technological improvements in the field of diabetes, as well as an increase in the diabetic population is propelling the growth.
According to the International Diabetes Federation, Diabetes is becoming more prevalent globally, accounting for 6.7 million deaths by 2021. As a result, Clinical examinations and procedures are carried out to diagnose the condition, which aids medical professionals in making additional decisions about medicine, testing, and recuperation and is expected to accelerate market expansion throughout the projection period.
Report Attribute |
Details |
Expected Market Value (2023) |
US$ 4.5 Billion |
Anticipated Forecast Value (2033) |
US$ 8.06 Billion |
Projected Growth Rate (2023-2033) |
6% CAGR |
Let us know your requirement to get
100% FREE customization
2017-2022 Necrobiosis Lipoidica Diabeticorum (NLD) Market Demand Analysis vs. Forecast 2023-2033
According to market research and competitive intelligence provider Future Market Insights- the market for Necrobiosis Lipoidica Diabeticorum (NLD) reflected a value of 4% during the historical period, 2017-2022. Various factors such as awareness in wellness and health, the diagnostics, and pathology segment are improving in the developing countries nowadays which grows the therapeutics market. The research and development activities in the field like emerging novel therapeutics, increasing the efficacy of medicine as well as treatment.
Selling campaigns initiated by the global players is growing the market progressively. Increasing focus by government organizations and private agencies like WHO and pharmaceutical companies to create awareness of Necrobiosis Lipoidica Diabeticorum (NLD) is fuelling the market growth. Thus, the market for Necrobiosis Lipoidica Diabeticorum (NLD) is expected to register a CAGR of 6% in the forecast period 2023-2033.
Which are Some Prominent Drivers of the Necrobiosis Lipoidica Diabeticorum (NLD) Market?
Strong Relation Between Diabetes & Necrobiosis Lipoidica Diabeticorum (NLD) to push the market growth
The increasing prevalence of Necrobiosis Lipoidica Diabeticorum (NLD) disease is one of the biggest drivers of the market. The massive growth in the diabetic population is primarily attributable to rising NLD rates around the world, as well as sedentary lifestyles defined by poor diets and decreased physical exercise.
According to a study conducted by National Center for Biotechnology Information, Necrobiosis lipoidica diabeticorum (NLD) is a rare chronic and granulomatous skin disorder that affects 0.3% of diabetic patients. The legs are the most common site for NLD, but involvement of other areas such as the abdomen, upper extremities and scalp has been reported. There is no rational therapy.
Furthermore, strong relationship between diabetes and NLD, many studies have focused on diabetic microangiopathy as the leading etiologic theory. Diabetic alterations of the kidney and eye vasculature are similar to the vascular changes seen in NLD. A deposition of glycoprotein in blood vessel walls may be the cause of diabetic microangiopathy. A similar glycoprotein deposition is seen in NLD. Doppler flow study showed lowered O2 tensions within the lesions.
Considering these in depth studies, the market is projected to show considerable growth through 2033.
Find your sweet spots for generating winning opportunities in this market.
Talk to AnalystWhat are the Challenges Faced by the Necrobiosis Lipoidica Diabeticorum (NLD) Market?
Expensive Cost of Treatment to restrict Market Growth
The expensive treatment of Necrobiosis Lipoidica Diabeticorum (NLD), less awareness of Necrobiosis Lipoidica Diabeticorum (NLD) disease, and insubstantial treatment options are hampering the market growth.
Region-Wise Insights
How is the Market for Necrobiosis Lipoidica Diabeticorum (NLD) Turning Out in the Asia Pacific Region?
Improvement in healthcare spending propelling growth of Necrobiosis Lipoidica Diabeticorum (NLD) in Asia Pacific
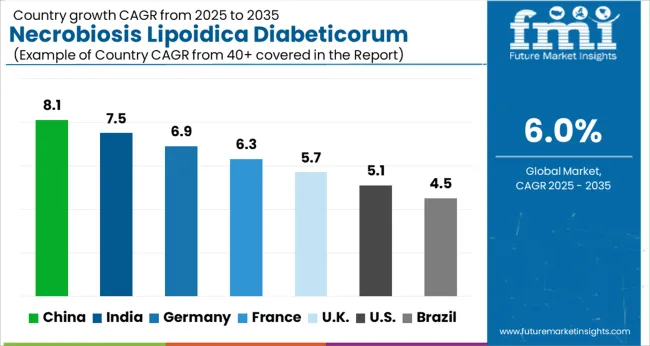
The Asia Pacific is expected to exhibit the significant growth rate of all regions over the forecast period, with a CAGR of 5% during the forecast period. The growth is owed to increased awareness, significant increases in healthcare spending, and a rising frequency of Necrobiosis Lipoidica Diabeticorum (NLD) in the region. Asia Pacific is an emerging market due to the increase in point of care approach to health & care. Increasing number of hospitals in India and China makes a promising market for the treatment market worldwide.
What are the Factors Boosting the Market for Necrobiosis Lipoidica Diabeticorum (NLD) in North America?
High prevalence of Skin Infections shaping landscape for Necrobiosis Lipoidica Diabeticorum (NLD) in North America
North America is anticipated to acquire a market share of about 34% in the forecast period. This growth is attributable to the rising prevalence of the condition in the region. As per the ClinicalTrials.gov posted on January 2020, study title "Development of a New Critical Pathway for Treatment of Acute Bacterial Skin and Skin Structure Infections (ABSSSI)" under the clinical development for the drug Dalbavancin from the allergen pharmaceutical in the United States.
Apart from this, An estimated 34.2 million people have diabetes (10.5 percent of the U.S. population). Therefore, the risk of Necrobiosis Lipoidica Diabeticorum (NLD) rises in the region.

A unified Market Research Subscription Platform, built for today's disparate research needs.
Category-Wise Insights
By Application, Which End-User is Likely to Account for the Highest Share?
Hospitals to take the lead and drive market growth
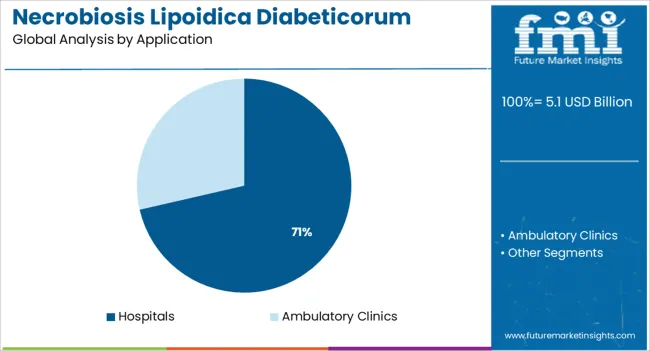
The application segment has been divided into hospital, retail pharmacies, and Ambulatory Surgical Centres. According to the FMI analysis, Hospitals account for the largest market share. The requirement for several hospital stays and visits during NLD treatment facilitates the growth of this segment.
Start-Ups in the Necrobiosis Lipoidica Diabeticorum (NLD) Market
Key start-up players in the Necrobiosis Lipoidica Diabeticorum (NLD) market are-
- Quin is using science, engineering and design to help people who take insulin make the best possible decisions. The company has a multi-factorial approach to managing insulin doses. Quin is building an app that combines daily life experience with data from diabetes devices and phones, and helps people decide how much insulin to take and when. With large measures of empathy and ingenuity, it can create previously unseen insights into why blood glucose fluctuates so much and inspire new approaches to treatment and research.
- Jade scales diabetes management for both patients and doctors. Jade is the only diabetes platform that holistically uses every piece of diabetes data to unpick interactions and detect patterns – in a powerful, visual way that patients understand. This builds health literacy, and empowers patients to make better self-management decisions. Jade uses personalized predictive analytics to provide specific and accurate alerts of future risks.
Market Competition
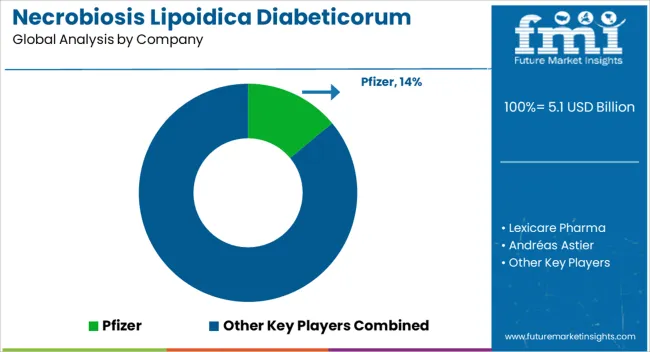
Key players in the Necrobiosis Lipoidica Diabeticorum (NLD) market are ALexicare Pharma, Andréas Astier, Mayo Clinic, AbbVie Inc, Merck & Co., Inc., Bristol-Myers Squibb Company, Johnson & Johnson Services Inc., Pfizer, Novartis AG, and GlaxoSmithKline Plc..
- In June 2022, Basilea Pharmaceutica Ltd announced today positive topline results for the Phase III ERADICATE study, evaluating ceftobiprole in the treatment of adult patients with bacterial bloodstream infections caused by Staphylococcus aureus (SAB).
- In January 2022, Paladin Labs Inc., a subsidiary of Endo International PLC launched the Xydalba (dalbavancin for injection), a 30-minute intravenous (IV) therapy for acute bacterial skin and skin structure infections (ABSSSI) that can be administered as a single- or two-dose.
Report Scope
Report Attribute |
Details |
Market Value in 2023 |
US$ 4.5 Billion |
Market Value in 2033 |
US$ 8.06 Billion |
Growth Rate |
CAGR of 6% from 2023 to 2033 |
Base Year for Estimation |
2022 |
Historical Data |
2017-2022 |
Forecast Period |
2023-2033 |
Quantitative Units |
Revenue in USD Million and CAGR from 2023-2033 |
Report Coverage |
Revenue Forecast, Volume Forecast, Company Ranking, Competitive Landscape, Growth Factors, Trends and Pricing Analysis |
Segments Covered |
|
Regions Covered |
|
Key Countries Profiled |
|
Key Companies Profiled |
Lexicare Pharma, Andréas Astier, Mayo Clinic, AbbVie Inc, Merck & Co., Inc., Bristol-Myers Squibb Company, Johnson & Johnson Services Inc., Pfizer, Novartis AG, GlaxoSmithKline Plc. |
Customization |
Available Upon Request |
Key Segments Profiled in the Necrobiosis Lipoidica Diabeticorum (NLD) Industry Survey:
Procedure:
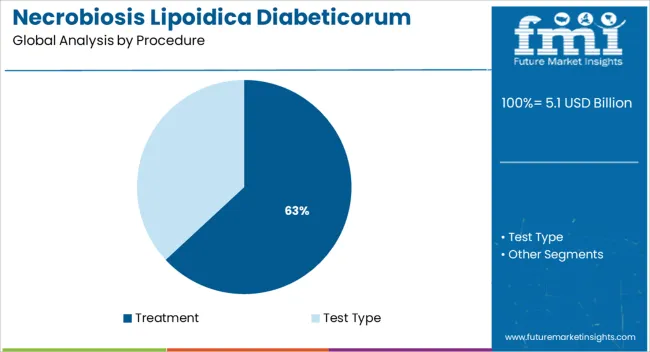
- Treatment
- Corticosteroid Creams
- Injected Corticosteroids
- Drugs that Suppress the Immune System
- Anti-inflammatory Drugs
- Medicines that Improve Blood Flow
- Hyperbaric Oxygen Therapy
- Phototherapy
- Laser Therapy
- Test Type
- Punch Biopsy
- Glucose Tolerance Test
Application:
- Hospitals
- Ambulatory Clinics
Region:
- North America
- Latin America
- Europe
- Asia Pacific
- MEA
Frequently Asked Questions
From 2017-2022, the Necrobiosis Lipoidica Diabeticorum (NLD) market grew at a CAGR of 4%.
The global Necrobiosis Lipoidica Diabeticorum (NLD) market is expected to grow with a 6% CAGR during 2023-2033.
As of 2033, the Necrobiosis Lipoidica Diabeticorum (NLD) market is expected to reach US$ 8.06 Billion
According to the FMI analysis, hospitals account for the largest market share.
North America is expected to possess 34% market share for the Necrobiosis Lipoidica Diabeticorum (NLD) market.
The Asia Pacific market is predicted to increase significantly throughout the forecast period, with a CAGR of 5% during the forecast period.
Table of Content
1. Executive Summary
1.1. Global Market Outlook
1.2. Demand-side Trends
1.3. Supply-side Trends
1.4. Technology Roadmap Analysis
1.5. Analysis and Recommendations
2. Market Overview
2.1. Market Coverage / Taxonomy
2.2. Market Definition / Scope / Limitations
3. Market Background
3.1. Market Dynamics
3.1.1. Drivers
3.1.2. Restraints
3.1.3. Opportunity
3.1.4. Trends
3.2. Scenario Forecast
3.2.1. Demand in Optimistic Scenario
3.2.2. Demand in Likely Scenario
3.2.3. Demand in Conservative Scenario
3.3. Opportunity Map Analysis
3.4. Investment Feasibility Matrix
3.5. PESTLE and Porter’s Analysis
3.6. Regulatory Landscape
3.6.1. By Key Regions
3.6.2. By Key Countries
3.7. Regional Parent Market Outlook
4. Global Market Analysis 2018-2022 and Forecast, 2023-2033
4.1. Historical Market Size Value (US$ Mn) Analysis, 2018-2022
4.2. Current and Future Market Size Value (US$ Mn) Projections, 2023-2033
4.2.1. Y-o-Y Growth Trend Analysis
4.2.2. Absolute $ Opportunity Analysis
5. Global Market Analysis 2018-2022 and Forecast 2023-2033, By Procedure
5.1. Introduction / Key Findings
5.2. Historical Market Size Value (US$ Mn) Analysis By Procedure, 2018-2022
5.3. Current and Future Market Size Value (US$ Mn) Analysis and Forecast By Procedure, 2023-2033
5.3.1. Treatment
5.3.1.1. Corticosteroid Creams
5.3.1.2. Injected Corticosteroids
5.3.1.3. Drugs that Suppress the Immune System
5.3.1.4. Anti-inflammatory Drugs
5.3.1.5. Medicines that Improve Blood Flow
5.3.1.6. Hyperbaric Oxygen Therapy
5.3.1.7. Phototherapy
5.3.1.8. Laser Therapy
5.3.2. Test Type
5.3.2.1. Punch Biopsy
5.3.2.2. Glucose Tolerance Test
5.4. Y-o-Y Growth Trend Analysis By Procedure, 2018-2022
5.5. Absolute $ Opportunity Analysis By Procedure, 2023-2033
6. Global Market Analysis 2018-2022 and Forecast 2023-2033, By Application
6.1. Introduction / Key Findings
6.2. Historical Market Size Value (US$ Mn) Analysis By Application, 2018-2022
6.3. Current and Future Market Size Value (US$ Mn) Analysis and Forecast By Application, 2023-2033
6.3.1. Hospitals
6.3.2. Ambulatory Surgical Centres
6.4. Y-o-Y Growth Trend Analysis By Application, 2018-2022
6.5. Absolute $ Opportunity Analysis By Application, 2023-2033
7. Global Market Analysis 2018-2022 and Forecast 2023-2033, By Region
7.1. Introduction
7.2. Historical Market Size Value (US$ Mn) Analysis By Region, 2018-2022
7.3. Current Market Size Value (US$ Mn) Analysis and Forecast By Region, 2023-2033
7.3.1. North America
7.3.2. Latin America
7.3.3. Europe
7.3.4. Asia Pacific
7.3.5. MEA
7.4. Market Attractiveness Analysis By Region
8. North America Market Analysis 2018-2022 and Forecast 2023-2033, By Country
8.1. Historical Market Size Value (US$ Mn) Trend Analysis By Market Taxonomy, 2018-2022
8.2. Market Size Value (US$ Mn) Forecast By Market Taxonomy, 2023-2033
8.2.1. By Country
8.2.1.1. U.S.
8.2.1.2. Canada
8.2.2. By Procedure
8.2.3. By Application
8.3. Market Attractiveness Analysis
8.3.1. By Country
8.3.2. By Procedure
8.3.3. By Application
8.4. Key Takeaways
9. Latin America Market Analysis 2018-2022 and Forecast 2023-2033, By Country
9.1. Historical Market Size Value (US$ Mn) Trend Analysis By Market Taxonomy, 2018-2022
9.2. Market Size Value (US$ Mn) Forecast By Market Taxonomy, 2023-2033
9.2.1. By Country
9.2.1.1. Brazil
9.2.1.2. Mexico
9.2.1.3. Rest of Latin America
9.2.2. By Procedure
9.2.3. By Application
9.3. Market Attractiveness Analysis
9.3.1. By Country
9.3.2. By Procedure
9.3.3. By Application
9.4. Key Takeaways
10. Europe Market Analysis 2018-2022 and Forecast 2023-2033, By Country
10.1. Historical Market Size Value (US$ Mn) Trend Analysis By Market Taxonomy, 2018-2022
10.2. Market Size Value (US$ Mn) Forecast By Market Taxonomy, 2023-2033
10.2.1. By Country
10.2.1.1. Germany
10.2.1.2. U.K.
10.2.1.3. France
10.2.1.4. Spain
10.2.1.5. Italy
10.2.1.6. Rest of Europe
10.2.2. By Procedure
10.2.3. By Application
10.3. Market Attractiveness Analysis
10.3.1. By Country
10.3.2. By Procedure
10.3.3. By Application
10.4. Key Takeaways
11. Asia Pacific Market Analysis 2018-2022 and Forecast 2023-2033, By Country
11.1. Historical Market Size Value (US$ Mn) Trend Analysis By Market Taxonomy, 2018-2022
11.2. Market Size Value (US$ Mn) Forecast By Market Taxonomy, 2023-2033
11.2.1. By Country
11.2.1.1. China
11.2.1.2. Japan
11.2.1.3. South Korea
11.2.1.4. Singapore
11.2.1.5. Thailand
11.2.1.6. Indonesia
11.2.1.7. Australia
11.2.1.8. New Zealand
11.2.1.9. Rest of Asia Pacific
11.2.2. By Procedure
11.2.3. By Application
11.3. Market Attractiveness Analysis
11.3.1. By Country
11.3.2. By Procedure
11.3.3. By Application
11.4. Key Takeaways
12. MEA Market Analysis 2018-2022 and Forecast 2023-2033, By Country
12.1. Historical Market Size Value (US$ Mn) Trend Analysis By Market Taxonomy, 2018-2022
12.2. Market Size Value (US$ Mn) Forecast By Market Taxonomy, 2023-2033
12.2.1. By Country
12.2.1.1. GCC Countries
12.2.1.2. South Africa
12.2.1.3. Israel
12.2.1.4. Rest of MEA
12.2.2. By Procedure
12.2.3. By Application
12.3. Market Attractiveness Analysis
12.3.1. By Country
12.3.2. By Procedure
12.3.3. By Application
12.4. Key Takeaways
13. Key Countries Market Analysis
13.1. U.S.
13.1.1. Pricing Analysis
13.1.2. Market Share Analysis, 2022
13.1.2.1. By Procedure
13.1.2.2. By Application
13.2. Canada
13.2.1. Pricing Analysis
13.2.2. Market Share Analysis, 2022
13.2.2.1. By Procedure
13.2.2.2. By Application
13.3. Brazil
13.3.1. Pricing Analysis
13.3.2. Market Share Analysis, 2022
13.3.2.1. By Procedure
13.3.2.2. By Application
13.4. Mexico
13.4.1. Pricing Analysis
13.4.2. Market Share Analysis, 2022
13.4.2.1. By Procedure
13.4.2.2. By Application
13.5. Germany
13.5.1. Pricing Analysis
13.5.2. Market Share Analysis, 2022
13.5.2.1. By Procedure
13.5.2.2. By Application
13.6. U.K.
13.6.1. Pricing Analysis
13.6.2. Market Share Analysis, 2022
13.6.2.1. By Procedure
13.6.2.2. By Application
13.7. France
13.7.1. Pricing Analysis
13.7.2. Market Share Analysis, 2022
13.7.2.1. By Procedure
13.7.2.2. By Application
13.8. Spain
13.8.1. Pricing Analysis
13.8.2. Market Share Analysis, 2022
13.8.2.1. By Procedure
13.8.2.2. By Application
13.9. Italy
13.9.1. Pricing Analysis
13.9.2. Market Share Analysis, 2022
13.9.2.1. By Procedure
13.9.2.2. By Application
13.10. China
13.10.1. Pricing Analysis
13.10.2. Market Share Analysis, 2022
13.10.2.1. By Procedure
13.10.2.2. By Application
13.11. Japan
13.11.1. Pricing Analysis
13.11.2. Market Share Analysis, 2022
13.11.2.1. By Procedure
13.11.2.2. By Application
13.12. South Korea
13.12.1. Pricing Analysis
13.12.2. Market Share Analysis, 2022
13.12.2.1. By Procedure
13.12.2.2. By Application
13.13. Singapore
13.13.1. Pricing Analysis
13.13.2. Market Share Analysis, 2022
13.13.2.1. By Procedure
13.13.2.2. By Application
13.14. Thailand
13.14.1. Pricing Analysis
13.14.2. Market Share Analysis, 2022
13.14.2.1. By Procedure
13.14.2.2. By Application
13.15. Indonesia
13.15.1. Pricing Analysis
13.15.2. Market Share Analysis, 2022
13.15.2.1. By Procedure
13.15.2.2. By Application
13.16. Australia
13.16.1. Pricing Analysis
13.16.2. Market Share Analysis, 2022
13.16.2.1. By Procedure
13.16.2.2. By Application
13.17. New Zealand
13.17.1. Pricing Analysis
13.17.2. Market Share Analysis, 2022
13.17.2.1. By Procedure
13.17.2.2. By Application
13.18. GCC Countries
13.18.1. Pricing Analysis
13.18.2. Market Share Analysis, 2022
13.18.2.1. By Procedure
13.18.2.2. By Application
13.19. South Africa
13.19.1. Pricing Analysis
13.19.2. Market Share Analysis, 2022
13.19.2.1. By Procedure
13.19.2.2. By Application
13.20. Israel
13.20.1. Pricing Analysis
13.20.2. Market Share Analysis, 2022
13.20.2.1. By Procedure
13.20.2.2. By Application
14. Market Structure Analysis
14.1. Competition Dashboard
14.2. Competition Benchmarking
14.3. Market Share Analysis of Top Players
14.3.1. By Regional
14.3.2. By Procedure
14.3.3. By Application
15. Competition Analysis
15.1. Competition Deep Dive
15.1.1. Lexicare Pharma
15.1.1.1. Overview
15.1.1.2. Product Portfolio
15.1.1.3. Profitability by Market Segments
15.1.1.4. Sales Footprint
15.1.1.5. Strategy Overview
15.1.1.5.1. Marketing Strategy
15.1.2. Andréas Astier
15.1.2.1. Overview
15.1.2.2. Product Portfolio
15.1.2.3. Profitability by Market Segments
15.1.2.4. Sales Footprint
15.1.2.5. Strategy Overview
15.1.2.5.1. Marketing Strategy
15.1.3. Mayo Clinic
15.1.3.1. Overview
15.1.3.2. Product Portfolio
15.1.3.3. Profitability by Market Segments
15.1.3.4. Sales Footprint
15.1.3.5. Strategy Overview
15.1.3.5.1. Marketing Strategy
15.1.4. AbbVie Inc
15.1.4.1. Overview
15.1.4.2. Product Portfolio
15.1.4.3. Profitability by Market Segments
15.1.4.4. Sales Footprint
15.1.4.5. Strategy Overview
15.1.4.5.1. Marketing Strategy
15.1.5. Merck & Co., Inc.
15.1.5.1. Overview
15.1.5.2. Product Portfolio
15.1.5.3. Profitability by Market Segments
15.1.5.4. Sales Footprint
15.1.5.5. Strategy Overview
15.1.5.5.1. Marketing Strategy
15.1.6. Bristol-Myers Squibb Company
15.1.6.1. Overview
15.1.6.2. Product Portfolio
15.1.6.3. Profitability by Market Segments
15.1.6.4. Sales Footprint
15.1.6.5. Strategy Overview
15.1.6.5.1. Marketing Strategy
15.1.7. Johnson & Johnson Services Inc.
15.1.7.1. Overview
15.1.7.2. Product Portfolio
15.1.7.3. Profitability by Market Segments
15.1.7.4. Sales Footprint
15.1.7.5. Strategy Overview
15.1.7.5.1. Marketing Strategy
15.1.8. Pfizer
15.1.8.1. Overview
15.1.8.2. Product Portfolio
15.1.8.3. Profitability by Market Segments
15.1.8.4. Sales Footprint
15.1.8.5. Strategy Overview
15.1.8.5.1. Marketing Strategy
15.1.9. Novartis AG
15.1.9.1. Overview
15.1.9.2. Product Portfolio
15.1.9.3. Profitability by Market Segments
15.1.9.4. Sales Footprint
15.1.9.5. Strategy Overview
15.1.9.5.1. Marketing Strategy
15.1.10. GlaxoSmithKline Plc.
15.1.10.1. Overview
15.1.10.2. Product Portfolio
15.1.10.3. Profitability by Market Segments
15.1.10.4. Sales Footprint
15.1.10.5. Strategy Overview
15.1.10.5.1. Marketing Strategy
16. Assumptions & Acronyms Used
17. Research Methodology
Let us know your requirement to get
100% FREE customization
List of Tables
Table 1: Global Market Value (US$ Mn) Forecast by Region, 2018-2033
Table 2: Global Market Value (US$ Mn) Forecast by Procedure, 2018-2033
Table 3: Global Market Value (US$ Mn) Forecast by Application, 2018-2033
Table 4: North America Market Value (US$ Mn) Forecast by Country, 2018-2033
Table 5: North America Market Value (US$ Mn) Forecast by Procedure, 2018-2033
Table 6: North America Market Value (US$ Mn) Forecast by Application, 2018-2033
Table 7: Latin America Market Value (US$ Mn) Forecast by Country, 2018-2033
Table 8: Latin America Market Value (US$ Mn) Forecast by Procedure, 2018-2033
Table 9: Latin America Market Value (US$ Mn) Forecast by Application, 2018-2033
Table 10: Europe Market Value (US$ Mn) Forecast by Country, 2018-2033
Table 11: Europe Market Value (US$ Mn) Forecast by Procedure, 2018-2033
Table 12: Europe Market Value (US$ Mn) Forecast by Application, 2018-2033
Table 13: Asia Pacific Market Value (US$ Mn) Forecast by Country, 2018-2033
Table 14: Asia Pacific Market Value (US$ Mn) Forecast by Procedure, 2018-2033
Table 15: Asia Pacific Market Value (US$ Mn) Forecast by Application, 2018-2033
Table 16: MEA Market Value (US$ Mn) Forecast by Country, 2018-2033
Table 17: MEA Market Value (US$ Mn) Forecast by Procedure, 2018-2033
Table 18: MEA Market Value (US$ Mn) Forecast by Application, 2018-2033
Find your sweet spots for generating winning opportunities in this market.
Talk to AnalystList of Charts
Figure 1: Global Market Value (US$ Mn) by Procedure, 2023-2033
Figure 2: Global Market Value (US$ Mn) by Application, 2023-2033
Figure 3: Global Market Value (US$ Mn) by Region, 2023-2033
Figure 4: Global Market Value (US$ Mn) Analysis by Region, 2018-2033
Figure 5: Global Market Value Share (%) and BPS Analysis by Region, 2023-2033
Figure 6: Global Market Y-o-Y Growth (%) Projections by Region, 2023-2033
Figure 7: Global Market Value (US$ Mn) Analysis by Procedure, 2018-2033
Figure 8: Global Market Value Share (%) and BPS Analysis by Procedure, 2023-2033
Figure 9: Global Market Y-o-Y Growth (%) Projections by Procedure, 2023-2033
Figure 10: Global Market Value (US$ Mn) Analysis by Application, 2018-2033
Figure 11: Global Market Value Share (%) and BPS Analysis by Application, 2023-2033
Figure 12: Global Market Y-o-Y Growth (%) Projections by Application, 2023-2033
Figure 13: Global Market Attractiveness by Procedure, 2023-2033
Figure 14: Global Market Attractiveness by Application, 2023-2033
Figure 15: Global Market Attractiveness by Region, 2023-2033
Figure 16: North America Market Value (US$ Mn) by Procedure, 2023-2033
Figure 17: North America Market Value (US$ Mn) by Application, 2023-2033
Figure 18: North America Market Value (US$ Mn) by Country, 2023-2033
Figure 19: North America Market Value (US$ Mn) Analysis by Country, 2018-2033
Figure 20: North America Market Value Share (%) and BPS Analysis by Country, 2023-2033
Figure 21: North America Market Y-o-Y Growth (%) Projections by Country, 2023-2033
Figure 22: North America Market Value (US$ Mn) Analysis by Procedure, 2018-2033
Figure 23: North America Market Value Share (%) and BPS Analysis by Procedure, 2023-2033
Figure 24: North America Market Y-o-Y Growth (%) Projections by Procedure, 2023-2033
Figure 25: North America Market Value (US$ Mn) Analysis by Application, 2018-2033
Figure 26: North America Market Value Share (%) and BPS Analysis by Application, 2023-2033
Figure 27: North America Market Y-o-Y Growth (%) Projections by Application, 2023-2033
Figure 28: North America Market Attractiveness by Procedure, 2023-2033
Figure 29: North America Market Attractiveness by Application, 2023-2033
Figure 30: North America Market Attractiveness by Country, 2023-2033
Figure 31: Latin America Market Value (US$ Mn) by Procedure, 2023-2033
Figure 32: Latin America Market Value (US$ Mn) by Application, 2023-2033
Figure 33: Latin America Market Value (US$ Mn) by Country, 2023-2033
Figure 34: Latin America Market Value (US$ Mn) Analysis by Country, 2018-2033
Figure 35: Latin America Market Value Share (%) and BPS Analysis by Country, 2023-2033
Figure 36: Latin America Market Y-o-Y Growth (%) Projections by Country, 2023-2033
Figure 37: Latin America Market Value (US$ Mn) Analysis by Procedure, 2018-2033
Figure 38: Latin America Market Value Share (%) and BPS Analysis by Procedure, 2023-2033
Figure 39: Latin America Market Y-o-Y Growth (%) Projections by Procedure, 2023-2033
Figure 40: Latin America Market Value (US$ Mn) Analysis by Application, 2018-2033
Figure 41: Latin America Market Value Share (%) and BPS Analysis by Application, 2023-2033
Figure 42: Latin America Market Y-o-Y Growth (%) Projections by Application, 2023-2033
Figure 43: Latin America Market Attractiveness by Procedure, 2023-2033
Figure 44: Latin America Market Attractiveness by Application, 2023-2033
Figure 45: Latin America Market Attractiveness by Country, 2023-2033
Figure 46: Europe Market Value (US$ Mn) by Procedure, 2023-2033
Figure 47: Europe Market Value (US$ Mn) by Application, 2023-2033
Figure 48: Europe Market Value (US$ Mn) by Country, 2023-2033
Figure 49: Europe Market Value (US$ Mn) Analysis by Country, 2018-2033
Figure 50: Europe Market Value Share (%) and BPS Analysis by Country, 2023-2033
Figure 51: Europe Market Y-o-Y Growth (%) Projections by Country, 2023-2033
Figure 52: Europe Market Value (US$ Mn) Analysis by Procedure, 2018-2033
Figure 53: Europe Market Value Share (%) and BPS Analysis by Procedure, 2023-2033
Figure 54: Europe Market Y-o-Y Growth (%) Projections by Procedure, 2023-2033
Figure 55: Europe Market Value (US$ Mn) Analysis by Application, 2018-2033
Figure 56: Europe Market Value Share (%) and BPS Analysis by Application, 2023-2033
Figure 57: Europe Market Y-o-Y Growth (%) Projections by Application, 2023-2033
Figure 58: Europe Market Attractiveness by Procedure, 2023-2033
Figure 59: Europe Market Attractiveness by Application, 2023-2033
Figure 60: Europe Market Attractiveness by Country, 2023-2033
Figure 61: Asia Pacific Market Value (US$ Mn) by Procedure, 2023-2033
Figure 62: Asia Pacific Market Value (US$ Mn) by Application, 2023-2033
Figure 63: Asia Pacific Market Value (US$ Mn) by Country, 2023-2033
Figure 64: Asia Pacific Market Value (US$ Mn) Analysis by Country, 2018-2033
Figure 65: Asia Pacific Market Value Share (%) and BPS Analysis by Country, 2023-2033
Figure 66: Asia Pacific Market Y-o-Y Growth (%) Projections by Country, 2023-2033
Figure 67: Asia Pacific Market Value (US$ Mn) Analysis by Procedure, 2018-2033
Figure 68: Asia Pacific Market Value Share (%) and BPS Analysis by Procedure, 2023-2033
Figure 69: Asia Pacific Market Y-o-Y Growth (%) Projections by Procedure, 2023-2033
Figure 70: Asia Pacific Market Value (US$ Mn) Analysis by Application, 2018-2033
Figure 71: Asia Pacific Market Value Share (%) and BPS Analysis by Application, 2023-2033
Figure 72: Asia Pacific Market Y-o-Y Growth (%) Projections by Application, 2023-2033
Figure 73: Asia Pacific Market Attractiveness by Procedure, 2023-2033
Figure 74: Asia Pacific Market Attractiveness by Application, 2023-2033
Figure 75: Asia Pacific Market Attractiveness by Country, 2023-2033
Figure 76: MEA Market Value (US$ Mn) by Procedure, 2023-2033
Figure 77: MEA Market Value (US$ Mn) by Application, 2023-2033
Figure 78: MEA Market Value (US$ Mn) by Country, 2023-2033
Figure 79: MEA Market Value (US$ Mn) Analysis by Country, 2018-2033
Figure 80: MEA Market Value Share (%) and BPS Analysis by Country, 2023-2033
Figure 81: MEA Market Y-o-Y Growth (%) Projections by Country, 2023-2033
Figure 82: MEA Market Value (US$ Mn) Analysis by Procedure, 2018-2033
Figure 83: MEA Market Value Share (%) and BPS Analysis by Procedure, 2023-2033
Figure 84: MEA Market Y-o-Y Growth (%) Projections by Procedure, 2023-2033
Figure 85: MEA Market Value (US$ Mn) Analysis by Application, 2018-2033
Figure 86: MEA Market Value Share (%) and BPS Analysis by Application, 2023-2033
Figure 87: MEA Market Y-o-Y Growth (%) Projections by Application, 2023-2033
Figure 88: MEA Market Attractiveness by Procedure, 2023-2033
Figure 89: MEA Market Attractiveness by Application, 2023-2033
Figure 90: MEA Market Attractiveness by Country, 2023-2033
Need specific information?
Request CustomizationExplore Healthcare Insights
View Reports