NetOps Market
Market Insights on NetOps covering sales outlook, demand forecast & up-to-date key trends
NetOps Market Analysis By Solution, Deployment, Enterprise Size, Network Type, Industry and Region- Forecast for 2022 – 2032
NetOps Market Outlook
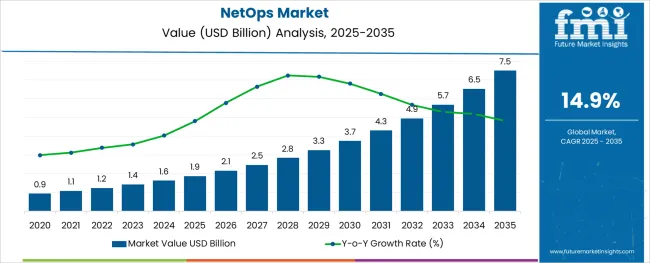
The NetOps market revenue was totaled ~US$ 1,073.2 Mn in 2022. The NetOps market revenue is expected to reach ~US$ 4,288.8 Mn by 2032, growing at a CAGR of 14.9% for 2022 – 2032.
Estimated year (2022) Market Value |
US$ 1,073.2 Mn |
Projected year (2032) Market Value |
US$ 4,288.8 Mn |
CAGR% (2022-2032) |
14.9% |
Top 5 Vendor Market Share |
Around 35% |
NetOps, also known as “Network Operations” is a method of improving the operations at a network operation centre, by implementing the principles and tools from DevOps (Development Operations) and SecOps (Security operations). The focus of NetOps is to improve the velocity and automation of the network operation processes. NetOps is used for creating scalable and programmable networks. NetOps refers to NetOps 2.0, since NetOps 1.0 refers to the manual network operations that occur in the NOCs. NetOps solution contributes nearly 5% market share to global network management market.
Let us know your requirement to get
100% FREE customization
2017-2021 NetOps Market Demand Outlook Compared to 2022-2032 Forecast
The NetOps market demand is expected to increase at 14.9% CAGR between 2022 and 2032 in comparison with 6.4% CAGR registered during 2017-2021. Several IT solution vendors have started deploying their solutions to clients using DevOps tools and methods. The present-day network faces difficulties keeping up with the developments that are occurring.
NetOps deployment could assist enterprises in handling the rapidly and continuously developing DevOps solutions. Because of the growth in DevOps solutions, enterprises could find the need to deploy NetOps solutions and tools to keep up with the pace, thus allowing the NetOps market to grow.
Improvement of Traditional Network Operations Driving Demand for NetOps Solutions and Services
The traditional network operations refer to the tasks performed by the network team of any organisation to monitor the performance of the organization's network. This task is often performed from the network operation centre (NOC) of the organization, and upon the detection of errors and anomalies, they perform these tasks for both the hardware and software components of the organisation.
NetOps solutions, tools, and practises allow the NOCs of any organisation to improve their efficiency, performance, and speed, something that could be a beneficial necessity for organisations, especially large organisations with numerous networks being worked upon. It also allows the implication of infrastructure as a code (IAC) for services and applications at the NOCs.
Find your sweet spots for generating winning opportunities in this market.
Talk to AnalystExplanation of Preview Image
The two countries in North America, the US and Canada, have similar economic conditions, reducing revenue volatility; the presence of numerous large enterprises improves demand consistency; and the presence of several well-developed industries pushes the scope of differentiation.
Latin America has several countries with different economic conditions, increasing the revenue volatility. The infrastructure necessary for NetOps is not up to the mark in some countries, raising the capital intensiveness.
Europe has several countries that are technologically advanced and also has several large enterprises, allowing the consistency of demand to be high; however, there are numerous stringent regulatory rules and regulations in the region, raising the regulatory complexity.
South Asia and Pacific is a developing region, with numerous enterprises entering the large enterprise segment, hence improving the demand for NetOps. Infrastructure deployment would require moderate investment, causing the region to have capital intensity.
East Asia is a well-developed region with countries with similar economic conditions. Barriers to entry could be high because of well-established local vendors.
The Middle East and Africa have high revenue volatility and would require high initial investments. Consistency in demand can be less in this region because only certain specific industries are well developed and do not have the latest technological solutions.
Regional Analysis
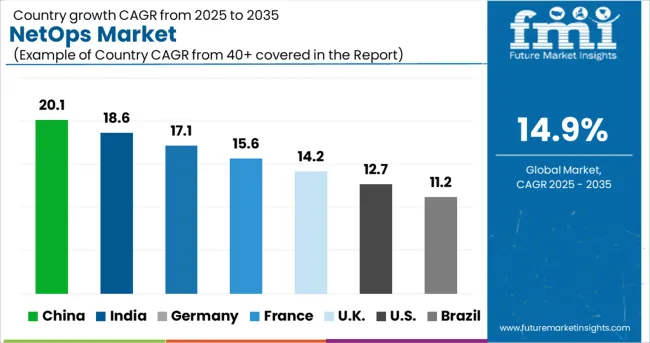
North America had the largest market share for NetOps market for the year 2022, with a market share of 36.1%. While South Asia and Pacific is expected to be the fastest growing region with a CAGR of 19.4%.
One of the reasons why South Asia and Pacific region is fastest growing region because IT & TELECOM sector is growing at rapid pace and the use of network automation, orchestration and virtualization, as network operation is increasing.

A unified Market Research Subscription Platform, built for today's disparate research needs.
Country-wise Insights
How will the sales prospects for NetOps unfold in India?
NetOps offers advantages like it has the capability to make network changes more rapidly utilizing automated tools. NetOps approach would generally necessitate the utilization of tools that can determine the optimal configuration build on the demands of the network, and in many cases execute it automatically.
This kind of network automation supports the continual enhancement of application delivery and services. Due to these factors, the sales in India are predicted to increase at the CAGR of 23.8% during the predicted period 2022-32.
How big is the opportunity for NetOps market in Germany?
NetOps solutions are utilized in the business procedure because it offers advantages like reduction in network operating costs, time and labour are saved, management of security, immediate handling of network incidents at all times. It also offers increased support through around clock networking monitoring, latest infrastructure with the highest quality, and prevention from network attacks. Thus, the advantages offered by the NetOps in business is driving the market demand in Germany.
Why UK is Estimated to be One of the Fort Runners for The NetOps Market?
It is anticipated that workplace teams would be able to get over the traditional barriers between operational, network, and data teams with the use of NetOps. Any NetOps project must therefore go beyond the realm of networking. The entire procedure is made digital, virtual, and software-defined by the contemporary NetOps methodology. It facilitates simple management and improves the organization's adaptability and agility. Thus, it is anticipated that market demand in the U.K. region will be driven by the benefits that NetOps offers.
Category-wise Insights
Why Cloud Deployment Mode is Estimated to the Higher Growth Rate?
The cloud deployment model is expected to dominate the market. NetOps in the cloud balances the total cost of ownership involved with managing the development and internal runtime infrastructure with the flexibility and speed with which services may be deployed. By enhancing agility and efficiency while providing IT resources quickly and at an affordable price, cloud has made it feasible to narrow the gap between the IT industry and enterprises. The adoption of the cloud model has accelerated, nevertheless, because transitioning between cloud models is expensive. In the upcoming years, market expansion would be accelerated.
Due to this, cloud deployment is estimated to grow at a CAGR of 18.4% over the forecast period.
Why will Virtual Network Type Segment account for Largest Market Share in 2022?
Virtual network type segment is estimated to grow at a CAGR of 20.2% over the forecast period. Instead of using numerous screens, each dedicated to a separate monitoring tool, a virtual network type segment can assist teams in collaborating during the incident management process, diagnosing and resolving problems through a single perspective.
Why SMEs Segment has the Greatest Market Share by Enterprise Size?
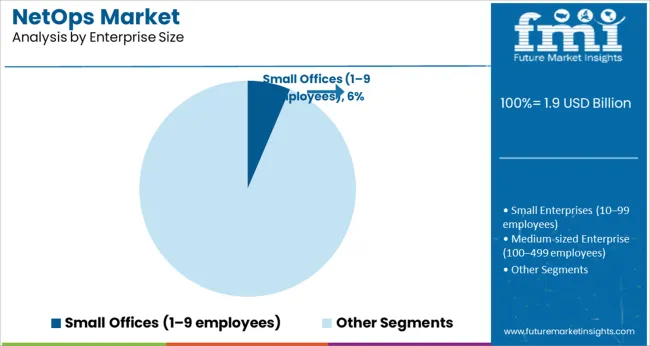
The small enterprises and medium-sized enterprises is expected to drive the segment growth due to the increasing adoption of NetOps in network optimization and development. NetOps have several benefits like it saves time for network implementation, network designing, and testing for business development; thus most of the small and medium sized enterprises are increasing the implementation of NetOps technologies to provide network automating procedure, which is estimated to increase the development of the market.
Competitive Landscape
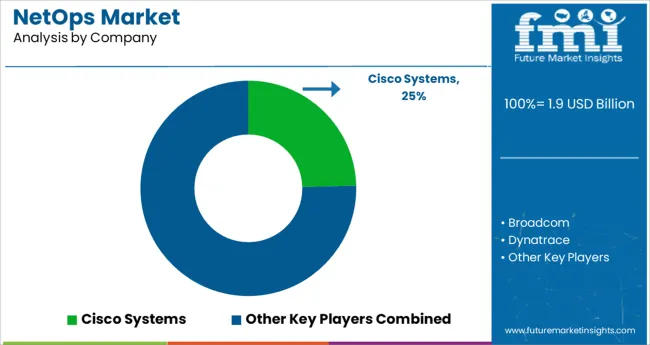
NetOps technology companies are primarily investing in product enhancements, upgradation for network implementation to address unmet needs of the customers. Vendors are also focusing on strategic partnerships and collaborations to expand their customer base.
- In October 2022, CodeMettle, a developer of network operations software was contracted to expand upon the technological abilities of US Army’s NetOps solutions. The initial contract was from January 2022 to January 2023, but has now been extended to May 2023 by the army.
Scope of Report
Attribute |
Details |
Market value in 2022 |
US$ 1,073.2 Mn |
Market CAGR 2022 to 2032 |
14.9 |
Share of top 5 players |
Around 35% |
Forecast Period |
2022-2032 |
Historical Data Available for |
2017-2021 |
Market Analysis |
USD Million for Value |
Key Regions Covered |
North America, Latin America, Europe, East Asia, South Asia & Pacific, and the Middle East & Africa |
Key Countries Covered |
US, Canada, Germany, U.K., France, Italy, Spain, Russia, China, Japan, South Korea, India, Malaysia, Indonesia, Singapore, Australia & New Zealand, GCC Countries, Turkey, North Africa and South Africa |
Key Segments Covered |
Solution, Deployment, Enterprise Size Network Type, and Region |
Key Companies Profiled |
|
Report Coverage |
Market Forecast, Company Share Analysis, Competition Intelligence, DROT Analysis, Market Dynamics and Challenges, and Strategic Growth Initiatives |
Customization & Pricing |
Available upon Request |
NetOps Market Outlook by Category
By Solution, NetOps Market is segmented as:
- Network Operation Tools
- Services
- Professional Services
- Network Consulting and Planning
- Network Integration and Implementation
- Support and Maintenance
- Managed Services
By Deployment, NetOps Market is segmented as:
- On-premises
- Cloud-based
By Enterprise Size, NetOps Market is segmented as:
- Small Offices (1–9 employees)
- Small Enterprises (10–99 employees)
- Medium-sized Enterprise (100–499 employees)
- Large Enterprises (500–999 employees)
- Very Large Enterprises (1,000+ employees)
By Network Type, NetOps Market is segmented as:
- Physical
- Virtual
- Hybrid
By Industry, NetOps Market is segmented as:
- Finance
- Banking
- Insurance
- Investment/Securities
- Manufacturing & Resources
- Discrete Manufacturing
- Process Manufacturing
- Resource industries
- Agriculture
- Distribution Services
- Retail
- Wholesales
- Transportation /Logistics Services
- Warehousing & Storage
- Shipping
- Services
- IT/Professional Services
- Consumer & Personal Services
- Media, Entertainment & Publishing
- Travel & Hospitality
- Legal Services
- Public Sector
- Government (State/Central)
- Education
- Healthcare
- Aerospace & Defense
- Non-Profit
- Infrastructure
- Telecommunication
- Energy & Utilities
- Building & Construction
By Region, NetOps Market Sales is segmented as:
- North America
- Latin America
- Europe
- East Asia
- South Asia & Pacific
- Middle East and Africa (MEA)
Frequently Asked Questions
South Asia and Pacific is projected to register strong growth in the market, exhibiting a CAGR of nearly 19.4% during the forecast period. However, North America was leading the global market with share of around 36.1% in 2021.
Key trends in the market includes: • Improvement of traditional network operations driving demand • NetOps offers advantages such as agility, resilience, and transparency needed for effective network management
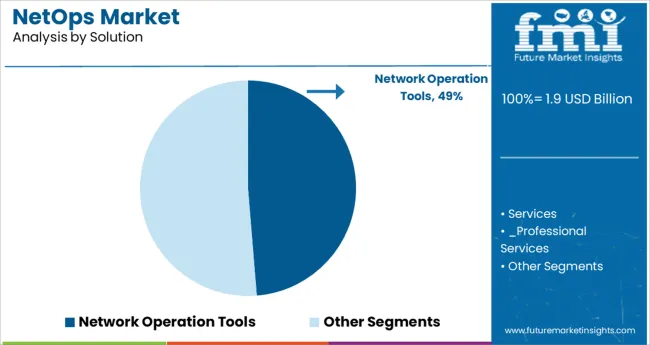
Network operation tools market segment is expected to dominate the market over the forecast period, generating a maximum revenue, among all solution segment, in the year 2022.
The NetOps market was valued at ~US$ 986.1 Mn in 2021, and is estimated to grow at a substantial pace with a CAGR of 14.9% to reach ~US$ 4,288.8 Mn in 2032.
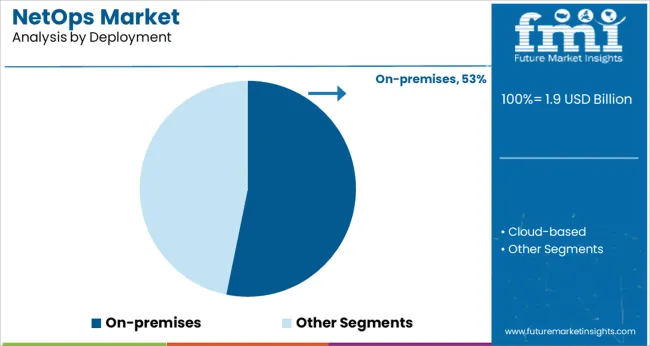
On-premises segment is expected to dominate the market over the forecast period, generating a maximum revenue, among all deployment mode, in the year 2022.
The market in last 5 years (2017 – 2021) grew by a CAGR of 6.4%.
Growing demand of DevOps solutions acting as a driver for NetOps market
East Asia is predicted to remain one of the most attractive markets during the forecast period 2022-2032. According to Future Market Insights, Japan accounted for nearly 6.5% market share of East Asia in 2021.
The global market growth between 2021 and 2022 is around 21.6%.
Top 5 countries driving demand for NetOps include U.S., Germany, U.K., India and Japan.
Europe is predicted to remain one of the most attractive markets during the forecast period, according to Future Market Insights. According to the study, U.K. is expected to account for 5.2% of the Europe market in 2021.
Some of the leading companies in this landscape are Cisco, Broadcom, Opengear, Dynatrace, and Progress Software, among others. As per Future Market Insights, nearly 35% of the market share is currently covered by the top players.
Table of Content
1. Executive Summary
1.1. Global Market Outlook
1.2. Demand Side Trends
1.3. Supply Side Trends
1.4. Analysis and Recommendations
2. Market Overview
2.1. Market Coverage / Taxonomy
2.2. Market Definition / Scope / Limitations
3. Key Market Trends
3.1. Key Trends Impacting the Market
3.2. Product Innovation / Development Trends
4. Pricing Analysis
4.1. Types of Pricing Model
4.1.1. Subscription Pricing Model
4.1.2. Perpetual Licensing
4.2. Average Pricing Analysis Benchmark
5. Global Market Demand (in Value in US$ Mn) Analysis 2017-2021 and Forecast, 2022-2032
5.1. Historical Market Value (US$ Mn) Analysis, 2017-2021
5.2. Current and Future Market Value (US$ Mn) Projections, 2022-2032
5.2.1. Y-o-Y Growth Trend Analysis
5.2.2. Absolute $ Opportunity Analysis
6. Market Background
6.1. Macro-Economic Factors
6.2. Forecast Factors - Relevance & Impact
6.3. Value Chain Analysis
6.4. COVID-19 Crisis – Impact Assessment
6.4.1. Current Statistics
6.4.2. Short-Mid-Long Term Outlook
6.4.3. Likely Rebound
6.5. Market Dynamics
6.5.1. Drivers
6.5.2. Restraints
6.5.3. Opportunities
7. Global Market Analysis 2017-2021 and Forecast 2022-2032, By Solution
7.1. Introduction / Key Findings
7.2. Historical Market Size (US$ Mn) Analysis By Solution, 2017-2021
7.3. Current and Future Market Size (US$ Mn) Analysis and Forecast By Solution, 2022-2032
7.3.1. Network Operation Tools
7.3.2. Services
7.3.2.1. Professional Services
7.3.2.1.1. Network Consulting & Planning
7.3.2.1.2. Network Integration & Implementation
7.3.2.1.3. Support and Maintenance
7.3.2.2. Managed Services
7.4. Market Attractiveness Analysis By Solution
8. Global Market Analysis 2017-2021 and Forecast 2022-2032, By Deployment
8.1. Introduction / Key Findings
8.2. Historical Market Size (US$ Mn) Analysis By Deployment, 2017-2021
8.3. Current and Future Market Size (US$ Mn) Analysis and Forecast By Deployment, 2022-2032
8.3.1. On-premises
8.3.2. Cloud-based
8.4. Market Attractiveness Analysis By Deployment
9. Global Market Analysis 2017-2021 and Forecast 2022-2032, By Network Type
9.1. Introduction / Key Findings
9.2. Historical Market Size (US$ Mn) Analysis By Network Type, 2017-2021
9.3. Current and Future Market Size (US$ Mn) Analysis and Forecast By Network Type, 2022-2032
9.3.1. Physical
9.3.2. Virtual
9.3.3. Hybrid
9.4. Market Attractiveness Analysis By Network Type
10. Global Market Analysis 2017-2021 and Forecast 2022-2032, By Enterprise Size
10.1. Introduction / Key Findings
10.2. Historical Market Size (US$ Mn) Analysis by Enterprise Size, 2017-2021
10.3. Current and Future Market Size (US$ Mn) Analysis and Forecast by Enterprise Size, 2022-2032
10.3.1. Small Offices (1–9 employees)
10.3.2. Small Enterprises (10–99 employees)
10.3.3. Medium-sized Enterprise (100–499 employees)
10.3.4. Large Enterprises (500–999 employees)
10.3.5. Very Large Enterprises (1,000+ employees)
10.4. Market Attractiveness Analysis By Enterprise Size
11. Global Market Analysis 2017-2021 and Forecast 2022-2032, By Industry
11.1. Introduction / Key Findings
11.2. Historical Market Size (US$ Mn) Analysis by Industry, 2017-2021
11.3. Current and Future Market Size (US$ Mn) Analysis and Forecast by Industry, 2022-2032
11.3.1. Finance
11.3.1.1. Banking
11.3.1.2. Insurance
11.3.1.3. Investment/Securities
11.3.2. Manufacturing & Resources
11.3.2.1. Discrete Manufacturing
11.3.2.2. Process Manufacturing
11.3.2.3. Resource industries
11.3.2.4. Agriculture
11.3.3. Distribution Services
11.3.3.1. Retail
11.3.3.2. Wholesales
11.3.3.3. Transportation /Logistics Services
11.3.3.4. Warehousing & Storage
11.3.3.5. Shipping
11.3.4. Services
11.3.4.1. IT/Professional Services
11.3.4.2. Consumer & Personal Services
11.3.4.3. Media, Entertainment & Publishing
11.3.4.4. Travel & Hospitality
11.3.4.5. Legal Services
11.3.5. Public Sector
11.3.5.1. Government (State/Central)
11.3.5.2. Education
11.3.5.3. Healthcare
11.3.5.4. Aerospace & Defense
11.3.5.5. Non-Profit
11.3.6. Infrastructure
11.3.6.1. Telecommunication
11.3.6.2. Energy & Utilities
11.3.6.3. Building & Construction
11.4. Market Attractiveness Analysis By Industry
12. Global Market Analysis 2017-2021 and Forecast 2022-2032, by Region
12.1. Introduction / Key Findings
12.2. Historical Market Size (US$ Mn) Analysis By Region, 2017-2021
12.3. Current Market Size (US$ Mn) Analysis and Forecast By Region, 2022-2032
12.3.1. North America
12.3.2. Latin America
12.3.3. Europe
12.3.4. East Asia
12.3.5. South Asia & Pacific
12.3.6. Middle East and Africa (MEA)
12.4. Market Attractiveness Analysis By Region
13. North America Market Analysis 2017-2021 and Forecast 2022-2032
13.1. Introduction / Key Findings
13.2. Historical Market Size (US$ Mn) Analysis By Market Taxonomy, 2017-2021
13.3. Market Size (US$ Mn) Forecast By Market Taxonomy, 2022-2032
13.3.1. By Country
13.3.1.1. U.S.
13.3.1.2. Canada
13.3.2. By Solution
13.3.3. By Deployment
13.3.4. By Network Type
13.3.5. By Enterprise Size
13.3.6. By Industry
13.4. Market Attractiveness Analysis
13.4.1. By Country
13.4.2. By Solution
13.4.3. By Deployment
13.4.4. By Network Type
13.4.5. By Enterprise Size
13.4.6. By Industry
14. Latin America Market Analysis 2017-2021 and Forecast 2022-2032
14.1. Introduction / Key Findings
14.2. Historical Market Size (US$ Mn) Analysis By Market Taxonomy, 2017-2021
14.3. Market Size (US$ Mn) Forecast By Market Taxonomy, 2022-2032
14.3.1. By Country
14.3.1.1. Brazil
14.3.1.2. Mexico
14.3.1.3. Rest of Latin America
14.3.2. By Solution
14.3.3. By Deployment
14.3.4. By Network Type
14.3.5. By Enterprise Size
14.3.6. By Industry
14.4. Market Attractiveness Analysis
14.4.1. By Country
14.4.2. By Solution
14.4.3. By Deployment
14.4.4. By Network Type
14.4.5. By Enterprise Size
14.4.6. By Industry
15. Europe Market Analysis 2017-2021 and Forecast 2022-2032
15.1. Introduction / Key Findings
15.2. Historical Market Size (US$ Mn) Analysis By Market Taxonomy, 2017-2021
15.3. Market Size (US$ Mn) Forecast By Market Taxonomy, 2022-2032
15.3.1. By Country
15.3.1.1. UK
15.3.1.2. France
15.3.1.3. Germany
15.3.1.4. Italy
15.3.1.5. Spain
15.3.1.6. BENELUX
15.3.1.7. Russia
15.3.1.8. Rest of Europe
15.3.2. By Solution
15.3.3. By Deployment
15.3.4. By Network Type
15.3.5. By Enterprise Size
15.3.6. By Industry
15.4. Market Attractiveness Analysis
15.4.1. By Country
15.4.2. By Solution
15.4.3. By Deployment
15.4.4. By Network Type
15.4.5. By Enterprise Size
15.4.6. By Industry
16. East Asia Market Analysis 2017-2021 and Forecast 2022-2032
16.1. Introduction / Key Findings
16.2. Historical Market Size (US$ Mn) Analysis By Market Taxonomy, 2017-2021
16.3. Market Size (US$ Mn) Forecast By Market Taxonomy, 2022-2032
16.3.1. By Country
16.3.1.1. China
16.3.1.2. Japan
16.3.1.3. South Korea
16.3.2. By Solution
16.3.3. By Deployment
16.3.4. By Network Type
16.3.5. By Enterprise Size
16.3.6. By Industry
16.4. Market Attractiveness Analysis
16.4.1. By Solution
16.4.2. By Deployment
16.4.3. By Network Type
16.4.4. By Enterprise Size
16.4.5. By Industry
17. South Asia & Pacific Market Analysis 2017-2021 and Forecast 2022-2032
17.1. Introduction / Key Findings
17.2. Historical Market Size (US$ Mn) Analysis By Market Taxonomy, 2017-2021
17.3. Market Size (US$ Mn) Forecast By Market Taxonomy, 2022-2032
17.3.1. By Country
17.3.1.1. India
17.3.1.2. ASEAN
17.3.1.3. Australia & New Zealand
17.3.1.4. Rest of South Asia & Pacific
17.3.2. By Solution
17.3.3. By Deployment
17.3.4. By Network Type
17.3.5. By Enterprise Size
17.3.6. By Industry
17.4. Market Attractiveness Analysis
17.4.1. By Country
17.4.2. By Solution
17.4.3. By Deployment
17.4.4. By Network Type
17.4.5. By Enterprise Size
17.4.6. By Industry
18. Middle East and Africa Market Analysis 2017-2021 and Forecast 2022-2032
18.1. Introduction / Key Findings
18.2. Historical Market Size (US$ Mn) Analysis By Market Taxonomy, 2017-2021
18.3. Market Size (US$ Mn) Forecast By Market Taxonomy, 2022-2032
18.3.1. By Country
18.3.1.1. GCC Countries
18.3.1.2. Turkey
18.3.1.3. South Africa
18.3.1.4. Rest of Middle East and Africa
18.3.2. By Solution
18.3.3. By Deployment
18.3.4. By Network Type
18.3.5. By Enterprise Size
18.3.6. By Industry
18.4. Market Attractiveness Analysis
18.4.1. By Country
18.4.2. By Solution
18.4.3. By Deployment
18.4.4. By Network Type
18.4.5. By Enterprise Size
18.4.6. By Industry
19. Key Countries Analysis
19.1. U.S. Market Analysis
19.1.1. By Solution
19.1.2. By Deployment
19.1.3. By Network Type
19.1.4. By Enterprise Size
19.1.5. By Industry
19.2. Canada Market Analysis
19.2.1. By Solution
19.2.2. By Deployment
19.2.3. By Network Type
19.2.4. By Enterprise Size
19.2.5. By Industry
19.3. Brazil Market Analysis
19.3.1. By Solution
19.3.2. By Deployment
19.3.3. By Network Type
19.3.4. By Enterprise Size
19.3.5. By Industry
19.4. Mexico Market Analysis
19.4.1. By Solution
19.4.2. By Deployment
19.4.3. By Network Type
19.4.4. By Enterprise Size
19.4.5. By Industry
19.5. UK Market Analysis
19.5.1. By Solution
19.5.2. By Deployment
19.5.3. By Network Type
19.5.4. By Enterprise Size
19.5.5. By Industry
19.6. Germany Market Analysis
19.6.1. By Solution
19.6.2. By Deployment
19.6.3. By Network Type
19.6.4. By Enterprise Size
19.6.5. By Industry
19.7. France Market Analysis
19.7.1. By Solution
19.7.2. By Deployment
19.7.3. By Network Type
19.7.4. By Enterprise Size
19.7.5. By Industry
19.8. Spain Market Analysis
19.8.1. By Solution
19.8.2. By Deployment
19.8.3. By Network Type
19.8.4. By Enterprise Size
19.8.5. By Industry
19.9. Italy Market Analysis
19.9.1. By Solution
19.9.2. By Deployment
19.9.3. By Network Type
19.9.4. By Enterprise Size
19.9.5. By Industry
19.10. BENELUX Market Analysis
19.10.1. By Solution
19.10.2. By Deployment
19.10.3. By Network Type
19.10.4. By Enterprise Size
19.10.5. By Industry
19.11. Russia Market Analysis
19.11.1. By Solution
19.11.2. By Deployment
19.11.3. By Network Type
19.11.4. By Enterprise Size
19.11.5. By Industry
19.12. China Market Analysis
19.12.1. By Solution
19.12.2. By Deployment
19.12.3. By Network Type
19.12.4. By Enterprise Size
19.12.5. By Industry
19.13. Japan Market Analysis
19.13.1. By Solution
19.13.2. By Deployment
19.13.3. By Network Type
19.13.4. By Enterprise Size
19.13.5. By Industry
19.14. South Korea Market Analysis
19.14.1. By Solution
19.14.2. By Deployment
19.14.3. By Network Type
19.14.4. By Enterprise Size
19.14.5. By Industry
19.15. India Market Analysis
19.15.1. By Solution
19.15.2. By Deployment
19.15.3. By Network Type
19.15.4. By Enterprise Size
19.15.5. By Industry
19.16. ASEAN Market Analysis
19.16.1. By Solution
19.16.2. By Deployment
19.16.3. By Network Type
19.16.4. By Enterprise Size
19.16.5. By Industry
19.17. Australia & New Zealand Market Analysis
19.17.1. By Solution
19.17.2. By Deployment
19.17.3. By Network Type
19.17.4. By Enterprise Size
19.17.5. By Industry
19.18. GCC Countries Market Analysis
19.18.1. By Solution
19.18.2. By Deployment
19.18.3. By Network Type
19.18.4. By Enterprise Size
19.18.5. By Industry
19.19. Turkey Market Analysis
19.19.1. By Solution
19.19.2. By Deployment
19.19.3. By Network Type
19.19.4. By Enterprise Size
19.19.5. By Industry
19.20. South Africa Market Analysis
19.20.1. By Solution
19.20.2. By Deployment
19.20.3. By Network Type
19.20.4. By Enterprise Size
19.20.5. By Industry
20. Market Structure Analysis
20.1. Market Analysis by Tier of Companies
20.2. Market Share Analysis of Top Players
20.3. Market Presence Analysis, Regional footprint by Players
21. Competition Analysis
21.1. Competition Dashboard
21.2. Competition Deep Dive
21.2.1. Cisco Systems
21.2.1.1. Business Overview
21.2.1.2. Product/Service Portfolio
21.2.1.3. Profitability by Market Segments (Business Segment/Region)
21.2.1.4. Sales Footprint
21.2.1.5. Strategy Overview
21.2.2. Broadcom
21.2.2.1. Business Overview
21.2.2.2. Product/Service Portfolio
21.2.2.3. Profitability by Market Segments (Business Segment/Region)
21.2.2.4. Sales Footprint
21.2.2.5. Strategy Overview
21.2.3. Dynatrace
21.2.3.1. Business Overview
21.2.3.2. Product/Service Portfolio
21.2.3.3. Profitability by Market Segments (Business Segment/Region)
21.2.3.4. Sales Footprint
21.2.3.5. Strategy Overview
21.2.4. Microsoft
21.2.4.1. Business Overview
21.2.4.2. Product/Service Portfolio
21.2.4.3. Profitability by Market Segments (Business Segment/Region)
21.2.4.4. Sales Footprint
21.2.4.5. Strategy Overview
21.2.5. Logic Monitor
21.2.5.1. Business Overview
21.2.5.2. Product/Service Portfolio
21.2.5.3. Profitability by Market Segments (Business Segment/Region)
21.2.5.4. Sales Footprint
21.2.5.5. Strategy Overview
21.2.6. Datadog
21.2.6.1. Business Overview
21.2.6.2. Product/Service Portfolio
21.2.6.3. Profitability by Market Segments (Business Segment/Region)
21.2.6.4. Sales Footprint
21.2.6.5. Strategy Overview
21.2.7. Motadata
21.2.7.1. Business Overview
21.2.7.2. Product/Service Portfolio
21.2.7.3. Profitability by Market Segments (Business Segment/Region)
21.2.7.4. Sales Footprint
21.2.7.5. Strategy Overview
21.2.8. Nefeli Networks
21.2.8.1. Business Overview
21.2.8.2. Product/Service Portfolio
21.2.8.3. Profitability by Market Segments (Business Segment/Region)
21.2.8.4. Sales Footprint
21.2.8.5. Strategy Overview
21.2.9. NinjaOne
21.2.9.1. Business Overview
21.2.9.2. Product/Service Portfolio
21.2.9.3. Profitability by Market Segments (Business Segment/Region)
21.2.9.4. Sales Footprint
21.2.9.5. Strategy Overview
21.2.10. Progress Software
21.2.10.1. Business Overview
21.2.10.2. Product/Service Portfolio
21.2.10.3. Profitability by Market Segments (Business Segment/Region)
21.2.10.4. Sales Footprint
21.2.10.5. Strategy Overview
21.2.11. Opengear
21.2.11.1. Business Overview
21.2.11.2. Product/Service Portfolio
21.2.11.3. Profitability by Market Segments (Business Segment/Region)
21.2.11.4. Sales Footprint
21.2.11.5. Strategy Overview
21.2.12. SolarWinds
21.2.12.1. Business Overview
21.2.12.2. Product/Service Portfolio
21.2.12.3. Profitability by Market Segments (Business Segment/Region)
21.2.12.4. Sales Footprint
21.2.12.5. Strategy Overview
21.2.13. Auvik
21.2.13.1. Business Overview
21.2.13.2. Product/Service Portfolio
21.2.13.3. Profitability by Market Segments (Business Segment/Region)
21.2.13.4. Sales Footprint
21.2.13.5. Strategy Overview
21.2.14. Atera
21.2.14.1. Business Overview
21.2.14.2. Product/Service Portfolio
21.2.14.3. Profitability by Market Segments (Business Segment/Region)
21.2.14.4. Sales Footprint
21.2.14.5. Strategy Overview
21.2.15. Zabbix
21.2.15.1. Business Overview
21.2.15.2. Product/Service Portfolio
21.2.15.3. Profitability by Market Segments (Business Segment/Region)
21.2.15.4. Sales Footprint
21.2.15.5. Strategy Overview
22. Assumptions and Acronyms Used
23. Research Methodology
Let us know your requirement to get
100% FREE customization
List of Tables
Table 01: Global Market Value (US$ Mn) Analysis (2017 – 2021) by Solution
Table 02: Global Market Value (US$ Mn) Analysis (2017 – 2021) by Solution
Table 03: Global Market Value (US$ Mn) Analysis (2017 – 2021) by Solution
Table 04: Global Market Value (US$ Mn) Analysis (2017 – 2021) by Solution
Table 05: Global Market Value (US$ Mn) Analysis (2017 – 2021) by Deployment
Table 06: Global Market Value (US$ Mn) Analysis (2017 – 2021) by Deployment
Table 07: Global Market Value (US$ Mn) Analysis (2017 – 2021) by Network Type
Table 08: Global Market Value (US$ Mn) Analysis (2017 – 2021) by Network Type
Table 09: Global Market Value (US$ Mn) Analysis (2017 – 2021) by Enterprise Size
Table 10: Global Market Value (US$ Mn) Analysis (2017 – 2021) by Enterprise Size
Table 11: Global Market Value (US$ Mn) Analysis (2017 – 2021) by Region
Table 12: Global Market Value (US$ Mn) Analysis (2017 – 2021) by Region
Table 13: North America Market Value (US$ Mn) Analysis (2017 – 2021) by Solution
Table 14: North America Market Value (US$ Mn) Analysis (2017 – 2021) by Solution
Table 15: North America Market Value (US$ Mn) Analysis (2017 – 2021) by Solution
Table 16: North America Market Value (US$ Mn) Analysis (2017 – 2021) by Solution
Table 17: North America Market Value (US$ Mn) Analysis (2017 – 2021) by Deployment
Table 18: North America Market Value (US$ Mn) Analysis (2017 – 2021) by Deployment
Table 19: North America Market Value (US$ Mn) Analysis (2017 – 2021) by Network Type
Table 20: North America Market Value (US$ Mn) Analysis (2017 – 2021) by Network Type
Table 21: North America Market Value (US$ Mn) Analysis (2017 – 2021) by Enterprise Size
Table 22: North America Market Value (US$ Mn) Analysis (2017 – 2021) by Enterprise Size
Table 23: North America Market Value (US$ Mn) Analysis (2017 – 2021) by Country
Table 24: North America Market Value (US$ Mn) Analysis (2017 – 2021) by Country
Table 25: Latin America Market Value (US$ Mn) Analysis (2017 – 2021) by Solution
Table 26: Latin America Market Value (US$ Mn) Analysis (2017 – 2021) by Solution
Table 27: Latin America Market Value (US$ Mn) Analysis (2017 – 2021) by Solution
Table 28: Latin America Market Value (US$ Mn) Analysis (2017 – 2021) by Solution
Table 29: Latin America Market Value (US$ Mn) Analysis (2017 – 2021) by Deployment
Table 30: Latin America Market Value (US$ Mn) Analysis (2017 – 2021) by Deployment
Table 31: Latin America Market Value (US$ Mn) Analysis (2017 – 2021) by Network Type
Table 32: Latin America Market Value (US$ Mn) Analysis (2017 – 2021) by Network Type
Table 33: Latin America Market Value (US$ Mn) Analysis (2017 – 2021) by Enterprise Size
Table 34: Latin America Market Value (US$ Mn) Analysis (2017 – 2021) by Enterprise Size
Table 35: Latin America Market Value (US$ Mn) Analysis (2017 – 2021) by Country
Table 36: Latin America Market Value (US$ Mn) Analysis (2017 – 2021) by Country
Table 37: Europe Market Value (US$ Mn) Analysis (2017 – 2021) by Solution
Table 38: Europe Market Value (US$ Mn) Analysis (2017 – 2021) by Solution
Table 39: Europe Market Value (US$ Mn) Analysis (2017 – 2021) by Solution
Table 40: Europe Market Value (US$ Mn) Analysis (2017 – 2021) by Solution
Table 41: Europe Market Value (US$ Mn) Analysis (2017 – 2021) by Deployment
Table 42: Europe Market Value (US$ Mn) Analysis (2017 – 2021) by Deployment
Table 43: Europe Market Value (US$ Mn) Analysis (2017 – 2021) by Network Type
Table 44: Europe Market Value (US$ Mn) Analysis (2017 – 2021) by Network Type
Table 45: Europe Market Value (US$ Mn) Analysis (2017 – 2021) by Enterprise Size
Table 46: Europe Market Value (US$ Mn) Analysis (2017 – 2021) by Enterprise Size
Table 47: Europe Market Value (US$ Mn) Analysis (2017 – 2021) by Country
Table 48: Europe Market Value (US$ Mn) Analysis (2017 – 2021) by Country
Table 49: East Asia Market Value (US$ Mn) Analysis (2017 – 2021) by Solution
Table 50: East Asia Market Value (US$ Mn) Analysis (2017 – 2021) by Solution
Table 51: East Asia Market Value (US$ Mn) Analysis (2017 – 2021) by Solution
Table 52: East Asia Market Value (US$ Mn) Analysis (2017 – 2021) by Solution
Table 53: East Asia Market Value (US$ Mn) Analysis (2017 – 2021) by Deployment
Table 54: East Asia Market Value (US$ Mn) Analysis (2017 – 2021) by Deployment
Table 55: East Asia Market Value (US$ Mn) Analysis (2017 – 2021) by Network Type
Table 56: East Asia Market Value (US$ Mn) Analysis (2017 – 2021) by Network Type
Table 57: East Asia Market Value (US$ Mn) Analysis (2017 – 2021) by Enterprise Size
Table 58: East Asia Market Value (US$ Mn) Analysis (2017 – 2021) by Enterprise Size
Table 59: East Asia Market Value (US$ Mn) Analysis (2017 – 2021) by Country
Table 60: East Asia Market Value (US$ Mn) Analysis (2017 – 2021) by Country
Table 61: South Asia & Pacific Market Value (US$ Mn) Analysis (2017 – 2021) by Solution
Table 62: South Asia & Pacific Market Value (US$ Mn) Analysis (2017 – 2021) by Solution
Table 63: South Asia & Pacific Market Value (US$ Mn) Analysis (2017 – 2021) by Solution
Table 64: South Asia & Pacific Market Value (US$ Mn) Analysis (2017 – 2021) by Solution
Table 65: South Asia & Pacific Market Value (US$ Mn) Analysis (2017 – 2021) by Deployment
Table 66: South Asia & Pacific Market Value (US$ Mn) Analysis (2017 – 2021) by Deployment
Table 67: South Asia & Pacific Market Value (US$ Mn) Analysis (2017 – 2021) by Network Type
Table 68: South Asia & Pacific Market Value (US$ Mn) Analysis (2017 – 2021) by Network Type
Table 69: South Asia & Pacific Market Value (US$ Mn) Analysis (2017 – 2021) by Enterprise Size
Table 70: South Asia & Pacific Market Value (US$ Mn) Analysis (2017 – 2021) by Enterprise Size
Table 71: South Asia & Pacific Market Value (US$ Mn) Analysis (2017 – 2021) by Country
Table 72: South Asia & Pacific Market Value (US$ Mn) Analysis (2017 – 2021) by Country
Table 73: Middle East & Africa Market Value (US$ Mn) Analysis (2017 – 2021) by Solution
Table 74: Middle East & Africa Market Value (US$ Mn) Analysis (2017 – 2021) by Solution
Table 75: Middle East & Africa Market Value (US$ Mn) Analysis (2017 – 2021) by Solution
Table 76: Middle East & Africa Market Value (US$ Mn) Analysis (2017 – 2021) by Solution
Table 77: Middle East & Africa Market Value (US$ Mn) Analysis (2017 – 2021) by Deployment
Table 78: Middle East & Africa Market Value (US$ Mn) Analysis (2017 – 2021) by Deployment
Table 79: Middle East & Africa Market Value (US$ Mn) Analysis (2017 – 2021) by Network Type
Table 80: Middle East & Africa Market Value (US$ Mn) Analysis (2017 – 2021) by Network Type
Table 81: Middle East & Africa Market Value (US$ Mn) Analysis (2017 – 2021) by Enterprise Size
Table 82: Middle East & Africa Market Value (US$ Mn) Analysis (2017 – 2021) by Enterprise Size
Table 83: Middle East & Africa Market Value (US$ Mn) Analysis (2017 – 2021) by Country
Table 84: Middle East & Africa Market Value (US$ Mn) Analysis (2017 – 2021) by Country
Find your sweet spots for generating winning opportunities in this market.
Talk to AnalystList of Charts
Figure 01: Global Market Value (US$ Mn), 2017-2021
Figure 02: Global Market Value (US$ Mn), 2022-2032
Figure 03: Global Market Size (US$ Mn) and Y-o-Y Growth Rate from 2022-2032
Figure 04: Global Market Size and Y-o-Y Growth Rate from 2022-2032
Figure 05: Global Market Value Y-o-Y Growth Trend Analysis (2019 – 2032) by Solution
Figure 06: Global Market Value Share Analysis (2022 – 2032) by Solution
Figure 07: Global Market Attractiveness by Solution
Figure 08: Global Market Value Y-o-Y Growth Trend Analysis (2019 – 2032) by Deployment
Figure 09: Global Market Value Share Analysis (2022 – 2032) by Deployment
Figure 10: Global Market Attractiveness by Deployment
Figure 11: Global Market Value Y-o-Y Growth Trend Analysis (2019 – 2032) by Network Type
Figure 12: Global Market Value Share Analysis (2022 – 2032) by Network Type
Figure 13: Global Market Attractiveness by Network Type
Figure 14: Global Market Value Y-o-Y Growth Trend Analysis (2019 – 2032) by Enterprise Size
Figure 15: Global Market Value Share Analysis (2022 – 2032) by Enterprise Size
Figure 16: Global Market Attractiveness by Enterprise Size
Figure 17: Global Market Value Y-o-Y Growth Trend Analysis (2019 – 2032) by Region
Figure 18: Global Market Value Share Analysis (2022 – 2032) by Region
Figure 19: Global Market Attractiveness by Region
Figure 20: North America Market Absolute $ Opportunity (US$ Mn), 2017 – 2032
Figure 21: Latin America Market Absolute $ Opportunity (US$ Mn), 2017 – 2032
Figure 22: Europe Market Absolute $ Opportunity (US$ Mn), 2017 – 2032
Figure 23: East Asia Market Absolute $ Opportunity (US$ Mn), 2017 – 2032
Figure 24: South Asia & Pacific Market Absolute $ Opportunity (US$ Mn), 2017 – 2032
Figure 25: Middle East & Africa Market Absolute $ Opportunity (US$ Mn), 2017 – 2032
Figure 26: North America Market Value (US$ Mn), 2017-2021
Figure 27: North America Market Value (US$ Mn), 2022-2032
Figure 28: North America Market Value Y-o-Y Growth Trend Analysis (2019 – 2032) by Solution
Figure 29: North America Market Value Share Analysis (2022 – 2032) by Solution
Figure 30: North America Market Attractiveness by Solution
Figure 31: North America Market Value Y-o-Y Growth Trend Analysis (2019 – 2032) by Deployment
Figure 32: North America Market Value Share Analysis (2022 – 2032) by Deployment
Figure 33: North America Market Attractiveness by Deployment
Figure 34: North America Market Value Y-o-Y Growth Trend Analysis (2019 – 2032) by Network Type
Figure 35: North America Market Value Share Analysis (2022 – 2032) by Network Type
Figure 36: North America Market Attractiveness by Network Type
Figure 37: North America Market Value Y-o-Y Growth Trend Analysis (2019 – 2032) by Enterprise Size
Figure 38: North America Market Value Share Analysis (2022 – 2032) by Enterprise Size
Figure 39: North America Market Attractiveness by Enterprise Size
Figure 40: North America Market Value Y-o-Y Growth Trend Analysis (2019 – 2032) by Country
Figure 41: North America Market Value Share Analysis (2022 – 2032) by Country
Figure 42: North America Market Attractiveness by Country
Figure 43: U.S. Market Absolute $ Opportunity (US$ Mn), 2017 – 2032
Figure 44: Canada Market Absolute $ Opportunity (US$ Mn), 2017 – 2032
Figure 45: Latin America Market Value (US$ Mn), 2017-2021
Figure 46: Latin America Market Value (US$ Mn), 2022-2032
Figure 47: Latin America Market Value Y-o-Y Growth Trend Analysis (2019 – 2032) by Solution
Figure 48: Latin America Market Value Share Analysis (2022 – 2032) by Solution
Figure 49: Latin America Market Attractiveness by Solution
Figure 50: Latin America Market Value Y-o-Y Growth Trend Analysis (2019 – 2032) by Deployment
Figure 51: Latin America Market Value Share Analysis (2022 – 2032) by Deployment
Figure 52: Latin America Market Attractiveness by Deployment
Figure 53: Latin America Market Value Y-o-Y Growth Trend Analysis (2019 – 2032) by Network Type
Figure 54: Latin America Market Value Share Analysis (2022 – 2032) by Network Type
Figure 55: Latin America Market Attractiveness by Network Type
Figure 56: Latin America Market Value Y-o-Y Growth Trend Analysis (2019 – 2032) by Enterprise Size
Figure 57: Latin America Market Value Share Analysis (2022 – 2032) by Enterprise Size
Figure 58: Latin America Market Attractiveness by Enterprise Size
Figure 59: Latin America Market Value Y-o-Y Growth Trend Analysis (2019 – 2032) by Country
Figure 60: Latin America Market Value Share Analysis (2022 – 2032) by Country
Figure 61: Latin America Market Attractiveness by Country
Figure 62: Brazil Market Absolute $ Opportunity (US$ Mn), 2017 – 2032
Figure 63: Mexico Market Absolute $ Opportunity (US$ Mn), 2017 – 2032
Figure 64: Rest of Latin America Market Absolute $ Opportunity (US$ Mn), 2017 – 2032
Figure 65: Europe Market Value (US$ Mn), 2017-2021
Figure 66: Europe Market Value (US$ Mn), 2022-2032
Figure 67: Europe Market Value Y-o-Y Growth Trend Analysis (2019 – 2032) by Solution
Figure 68: Europe Market Value Share Analysis (2022 – 2032) by Solution
Figure 69: Europe Market Attractiveness by Solution
Figure 70: Europe Market Value Y-o-Y Growth Trend Analysis (2019 – 2032) by Deployment
Figure 71: Europe Market Value Share Analysis (2022 – 2032) by Deployment
Figure 72: Europe Market Attractiveness by Deployment
Figure 73: Europe Market Value Y-o-Y Growth Trend Analysis (2019 – 2032) by Network Type
Figure 74: Europe Market Value Share Analysis (2022 – 2032) by Network Type
Figure 75: Europe Market Attractiveness by Network Type
Figure 76: Europe Market Value Y-o-Y Growth Trend Analysis (2019 – 2032) by Enterprise Size
Figure 77: Europe Market Value Share Analysis (2022 – 2032) by Enterprise Size
Figure 78: Europe Market Attractiveness by Enterprise Size
Figure 79: Europe Market Value Y-o-Y Growth Trend Analysis (2019 – 2032) by Country
Figure 80: Europe Market Value Share Analysis (2022 – 2032) by Country
Figure 81: Europe Market Attractiveness by Country
Figure 82: Germany Market Absolute $ Opportunity (US$ Mn), 2017 – 2032
Figure 83: Italy Market Absolute $ Opportunity (US$ Mn), 2017 – 2032
Figure 84: France Market Absolute $ Opportunity (US$ Mn), 2017 – 2032
Figure 85: U.K. Market Absolute $ Opportunity (US$ Mn), 2017 – 2032
Figure 86: Spain Market Absolute $ Opportunity (US$ Mn), 2017 – 2032
Figure 87: BENELUX Market Absolute $ Opportunity (US$ Mn), 2017 – 2032
Figure 88: Russia Market Absolute $ Opportunity (US$ Mn), 2017 – 2032
Figure 89: Rest of Europe Market Absolute $ Opportunity (US$ Mn), 2017 – 2032
Figure 90: East Asia Market Value (US$ Mn), 2017-2021
Figure 91: East Asia Market Value (US$ Mn), 2022-2032
Figure 92: East Asia Market Value Y-o-Y Growth Trend Analysis (2019 – 2032) by Solution
Figure 93: East Asia Market Value Share Analysis (2022 – 2032) by Solution
Figure 94: East Asia Market Attractiveness by Solution
Figure 95: East Asia Market Value Y-o-Y Growth Trend Analysis (2019 – 2032) by Deployment
Figure 96: East Asia Market Value Share Analysis (2022 – 2032) by Deployment
Figure 97: East Asia Market Attractiveness by Deployment
Figure 98: East Asia Market Value Y-o-Y Growth Trend Analysis (2019 – 2032) by Network Type
Figure 99: East Asia Market Value Share Analysis (2022 – 2032) by Network Type
Figure 100: East Asia Market Attractiveness by Network Type
Figure 101: East Asia Market Value Y-o-Y Growth Trend Analysis (2019 – 2032) by Enterprise Size
Figure 102: East Asia Market Value Share Analysis (2022 – 2032) by Enterprise Size
Figure 103: East Asia Market Attractiveness by Enterprise Size
Figure 104: East Asia Market Value Y-o-Y Growth Trend Analysis (2019 – 2032) by Country
Figure 105: East Asia Market Value Share Analysis (2022 – 2032) by Country
Figure 106: East Asia Market Attractiveness by Country
Figure 107: China Market Absolute $ Opportunity (US$ Mn), 2017 – 2032
Figure 108: Japan Market Absolute $ Opportunity (US$ Mn), 2017 – 2032
Figure 109: South Korea Market Absolute $ Opportunity (US$ Mn), 2017 – 2032
Figure 110: South Asia & Pacific Market Value (US$ Mn), 2017-2021
Figure 111: South Asia & Pacific Market Value (US$ Mn), 2022-2032
Figure 112: South Asia & Pacific Market Value Y-o-Y Growth Trend Analysis (2019 – 2032) by Solution
Figure 113: South Asia & Pacific Market Value Share Analysis (2022 – 2032) by Solution
Figure 114: South Asia & Pacific Market Attractiveness by Solution
Figure 115: South Asia & Pacific Market Value Y-o-Y Growth Trend Analysis (2019 – 2032) by Deployment
Figure 116: South Asia & Pacific Market Value Share Analysis (2022 – 2032) by Deployment
Figure 117: South Asia & Pacific Market Attractiveness by Deployment
Figure 118: South Asia & Pacific Market Value Y-o-Y Growth Trend Analysis (2019 – 2032) by Network Type
Figure 119: South Asia & Pacific Market Value Share Analysis (2022 – 2032) by Network Type
Figure 120: South Asia & Pacific Market Attractiveness by Network Type
Figure 121: South Asia & Pacific Market Value Y-o-Y Growth Trend Analysis (2019 – 2032) by Enterprise Size
Figure 122: South Asia & Pacific Market Value Share Analysis (2022 – 2032) by Enterprise Size
Figure 123: South Asia & Pacific Market Attractiveness by Enterprise Size
Figure 124: South Asia & Pacific Market Value Y-o-Y Growth Trend Analysis (2019 – 2032) by Country
Figure 125: South Asia & Pacific Market Value Share Analysis (2022 – 2032) by Country
Figure 126: South Asia & Pacific Market Attractiveness by Country
Figure 127: India Market Absolute $ Opportunity (US$ Mn), 2017 – 2032
Figure 128: ASEAN Market Absolute $ Opportunity (US$ Mn), 2017 – 2032
Figure 129: Australia & New Zealand Market Absolute $ Opportunity (US$ Mn), 2017 – 2032
Figure 130: Rest of South Asia & Pacific Market Absolute $ Opportunity (US$ Mn), 2017 – 2032
Figure 131: Middle East & Africa Market Value (US$ Mn), 2017-2021
Figure 132: Middle East & Africa Market Value (US$ Mn), 2022-2032
Figure 133: Middle East & Africa Market Value Y-o-Y Growth Trend Analysis (2019 – 2032) by Solution
Figure 134: Middle East & Africa Market Value Share Analysis (2022 – 2032) by Solution
Figure 135: Middle East & Africa Market Attractiveness by Solution
Figure 136: Middle East & Africa Market Value Y-o-Y Growth Trend Analysis (2019 – 2032) by Deployment
Figure 137: Middle East & Africa Market Value Share Analysis (2022 – 2032) by Deployment
Figure 138: Middle East & Africa Market Attractiveness by Deployment
Figure 139: Middle East & Africa Market Value Y-o-Y Growth Trend Analysis (2019 – 2032) by Network Type
Figure 140: Middle East & Africa Market Value Share Analysis (2022 – 2032) by Network Type
Figure 141: Middle East & Africa Market Attractiveness by Network Type
Figure 142: Middle East & Africa Market Value Y-o-Y Growth Trend Analysis (2019 – 2032) by Enterprise Size
Figure 143: Middle East & Africa Market Value Share Analysis (2022 – 2032) by Enterprise Size
Figure 144: Middle East & Africa Market Attractiveness by Enterprise Size
Figure 145: Middle East & Africa Market Value Y-o-Y Growth Trend Analysis (2019 – 2032) by Country
Figure 146: Middle East & Africa Market Value Share Analysis (2022 – 2032) by Country
Figure 147: Middle East & Africa Market Attractiveness by Country
Figure 148: GCC Countries Market Absolute $ Opportunity (US$ Mn), 2017 – 2032
Figure 149: North Africa Market Absolute $ Opportunity (US$ Mn), 2017 – 2032
Figure 150: South Africa Market Absolute $ Opportunity (US$ Mn), 2017 – 2032
Figure 151: Turkey Market Absolute $ Opportunity (US$ Mn), 2017 – 2032
Figure 152: Rest of Middle East & Africa Market Absolute $ Opportunity (US$ Mn), 2017 – 2032
Need specific information?
Request CustomizationExplore Technology Insights
View Reports