The Non-Aerosol Overcaps Market is estimated to be valued at USD 269.4 million in 2025 and is projected to reach USD 406.5 million by 2035, registering a compound annual growth rate (CAGR) of 4.2% over the forecast period.
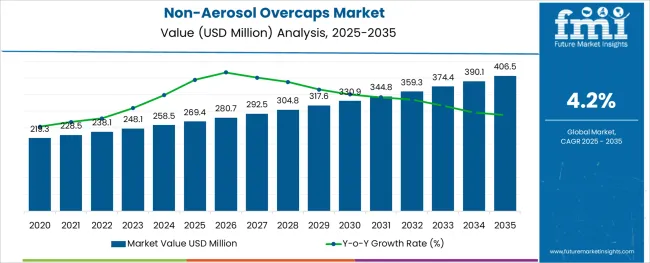
The non-aerosol overcaps market is gaining traction amid growing regulatory focus on product safety, hygiene, and sustainable design in secondary packaging formats. As consumer goods companies shift toward non-pressurized dispensing systems, demand has increased for functional overcaps that offer secure sealing, tamper evidence, and visual differentiation.
The rise in e-commerce and shelf-ready packaging formats is reinforcing the need for overcaps that enhance product protection during transit and support brand visibility. Materials innovation, such as the use of post-consumer recycled resins and lightweight polymer blends, is driving cost and environmental efficiencies.
Compatibility with advanced injection and compression molding technologies is enabling rapid, high-volume production of customized overcaps tailored for diverse packaging neck finishes. With increasing focus on recyclability, mono-material compatibility, and downstream sorting, non-aerosol overcaps are expected to play a vital role in the circular packaging economy.
The market is segmented by Material Type, Diameter, Application, and End-Use Industry and region. By Material Type, the market is divided into Plastic Non-Aerosol Overcaps, Metal Non-Aerosol Overcaps, and Others. In terms of Diameter, the market is classified into Non-Aerosol Overcaps measuring 31 to 40 mm, Non-Aerosol Overcaps measuring less than 30 mm, Non-Aerosol Overcaps measuring 41 to 50 mm, and Non-Aerosol Overcaps measuring more than 50 mm.
Based on Application, the market is segmented into Non-Aerosol Overcaps for Bottles and Non-Aerosol Overcaps for Cans. By End-Use Industry, the market is divided into Non-Aerosol Overcaps for Personal Care & Cosmetics, Non-Aerosol Overcaps for Food & Beverages, Non-Aerosol Overcaps for Consumer Goods, Non-Aerosol Overcaps for Automotive, Non-Aerosol Overcaps for Pharmaceuticals & Healthcare, Non-Aerosol Overcaps for Painting and Coating Industry, and Non-Aerosol Overcaps for Other End-Use Industries.
Regionally, the market is classified into North America, Latin America, Western Europe, Eastern Europe, Balkan & Baltic Countries, Russia & Belarus, Central Asia, East Asia, South Asia & Pacific, and the Middle East & Africa.
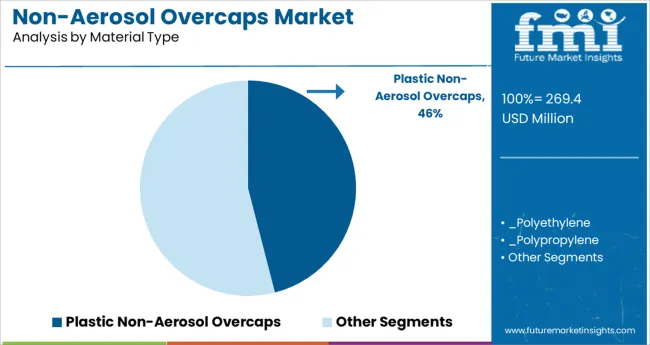
Plastic non-aerosol overcaps are projected to account for 46.0% of the total market revenue in 2025, positioning them as the leading material segment. This leadership is attributed to plastic’s versatility, lightweight properties, and adaptability to high-volume molding techniques. Plastic overcaps offer excellent design flexibility, allowing for integration of snap-fit, twist-lock, and tamper-evident features while maintaining low production costs.
Their ability to accommodate varying closure diameters and finishes makes them ideal for multiple consumer and industrial product types. The segment’s growth is also supported by rising use of recyclable and bio-based plastics, which align with evolving sustainability requirements.
Moreover, plastics ensure product integrity and safety, offering a barrier against contaminants and unintentional dispensing, which is critical in home care, healthcare, and food packaging. Ongoing innovation in polymer formulation and tooling is expected to reinforce the segment’s continued dominance in both legacy and emerging markets.
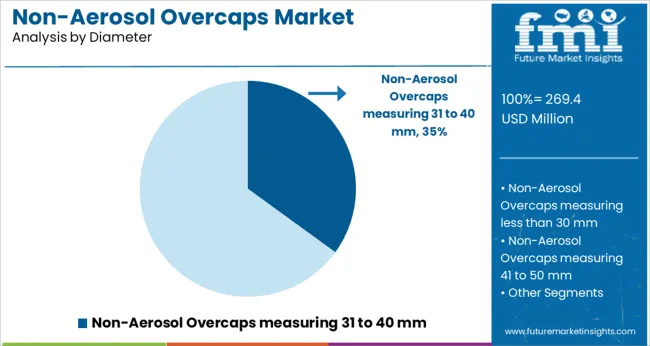
Non-aerosol overcaps with diameters ranging from 31 to 40 mm are expected to represent 35.0% of the total market share in 2025. This segment’s prominence is being driven by its broad applicability across medium-sized containers in personal care, cosmetics, pharmaceuticals, and household products. The 31-40 mm range strikes an ideal balance between ergonomic usability and structural stability, making it compatible with a wide range of dispensing closures, pumps, and sprayers.
Manufacturers prefer this diameter for its adaptability to automated capping equipment and standard neck finishes, which reduces production line reconfiguration. Additionally, consumer preference for compact, travel-friendly packaging formats has contributed to the increased adoption of this segment.
With rising demand for controlled dispensing and aesthetic packaging, overcaps in this size range are becoming integral to product protection and differentiation strategies, particularly in high-velocity retail and e-commerce distribution channels.
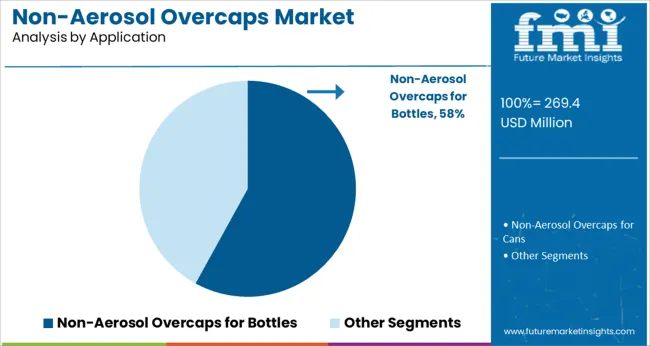
Non-aerosol overcaps for bottles are projected to hold a dominant 58.0% share of the market in 2025. This leadership is supported by widespread usage of bottles across personal care, home cleaning, and OTC pharmaceutical categories, where non-aerosol formats are preferred for safety, refillability, and cost efficiency. Bottled products require overcaps that provide both functional protection-against dust, leakage, and tampering-and aesthetic enhancement for branding on shelves.
The growing shift from pressurized aerosols to pump-based or squeeze dispensing has made bottles the preferred format in many segments, further driving overcap usage. In addition, regulatory demands for child-resistant, tamper-evident, and recyclable packaging have encouraged innovation in overcap design specifically tailored for bottle applications.
As manufacturers prioritize packaging that supports refill systems, sustainability, and shelf impact, the bottle application segment is expected to remain the central growth driver for non-aerosol overcaps.
The global demand for non-aerosol overcaps is projected to increase at a CAGR of 4.2% during the forecast period between 2025 and 2035, reaching a total of USD 406.5 Million in 2035, according to a report from Future Market Insights (FMI). From 2020 to 2024, sales witnessed significant growth, registering a CAGR of 2.9%.
Non-aerosol overcaps suit a variety of bottles and cans, and can also be used as a measuring cup for liquids. Consumers have a straightforward attitude to packaging: they want packaging that is intuitive, simple to use, safe, sustainable, and cost-effective. Customers are increasingly turning to internet purchasing and mobile product consumption. This has resulted in a shift in consumer engagement and their approach to packaging solutions.
Dispensing solutions play a critical part in providing customers with a safe experience while utilizing products. Non-aerosol overcaps prevent non-aerosol containers, bottles, and cans from spilling and wasting liquid. Non-aerosol overcaps are used in a variety of sectors, including food and beverage, cosmetics, healthcare, automotive, and others. Manufacturers supply non-aerosol overcaps to industries for basic packaging solutions or respond to their client's demands with bespoke choices. The market for non-aerosol overcaps is expected to grow at a steady rate in the coming years.
Rising Demand from Various End-Use Sectors to Accelerate the Market Growth
The rising need for non-aerosol solutions across various end-use sectors such as healthcare, cosmetics, paint, and automotive is expected to drive considerable growth potential in the non-aerosol overcaps market.
Demand for medicinal goods, cosmetic creams, paint products, and other non-aerosol solutions drives the industry. The ever increasing demand for products necessitates the selection of a substantial closure for a packaging solution. Overcaps are a practical need to ensure product integrity in addition to being a customized extension of packaging solutions. These reasons will raise the need for non-aerosol overcaps significantly in the near future.
Recycling Concerns to Restrain the Market Growth
Weight reduction has harmed the integrity of non-aerosol cans, which feature overcaps. As a result, manufacturers are working on producing more consumer-oriented products in order to ensure safe packaging.
Aside from that, recycling concerns are a danger to the expansion of the non-aerosol overcaps industry. However, with changing trends and the use of biodegradable non-aerosol overcaps, recycling concerns are addressed, and demand for non-aerosol overcaps increases during the projection period.
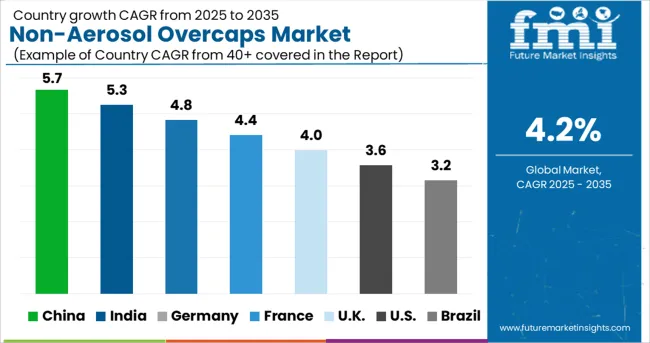
Exponential Rise in Packaging for Personal Care & Cosmetics Items in the Region to Fuel the Market Growth
The non-aerosol overcaps market in Asia-Pacific is expected to accumulate a significant market share of 13% in 2025 and is expected to continue to maintain the trend over the forecast period as well.
Due to an exponential rise in packaging for personal care & cosmetics, and pharmaceutical items, India will acquire a substantial chunk of the non-aerosol overcaps market by the end of 2035. Low tax rates on food, cosmetics, and personal care items, as well as readily accessible and inexpensive trained labor, will further contribute to India's increased market dominance.
The increasing number of Indian end-use sectors such as FMCG, internet retail, and home care items would benefit the country's market share in APAC. Taking all of these considerations into account, India will have a significant presence in the non-aerosol overcaps market throughout the projected period.
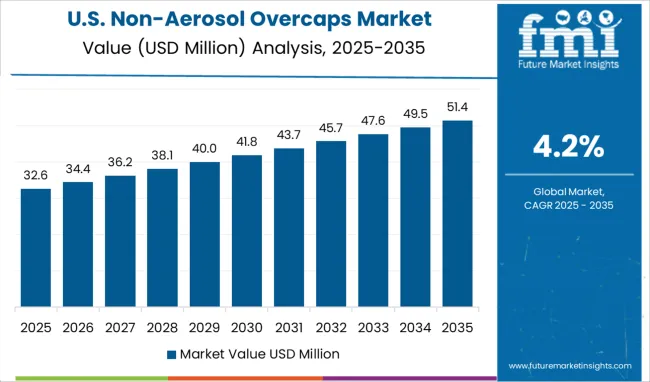
Lucrative Development Possibilities and Rising Consumer Demand to Fuel the Market Growth
The non-aerosol overcaps market in North America is expected to accumulate the highest market share of 28% in 2025. North America is the market's dominant region, with a high CAGR projected over the projection period. Personal care and cosmetics, as well as the food and beverage sectors, drive the global market for non-aerosol overcaps.
Lucrative development possibilities and rising consumer demand are expected to benefit the region's market. Furthermore, rising consumer expenditure in growing economies such as the United States and Canada drives up demand for non-aerosol in the personal care industry.
Growing Demand from the Pharmaceutical and Personal Care Sectors in the Region
The non-aerosol overcaps market in Europe is expected to accumulate a market share value of 19%in 2025. Because of the rising usage of the product in the pharmaceutical and personal care sectors, Europe dominates the non-aerosol overcaps industry.
The Personal Care & Cosmetics Segment to Drive the Non-Aerosol Overcaps Market
Non-aerosol overcaps are expected to dominate the market due to their high demand in a variety of end-user sectors, including personal care and cosmetics. Non-aerosol overcaps are a self-contained dispensing method in which a material is held inside a compact metal canister and pushed out as a fine mist, spray, or foam.
Non-aerosols can be used extensively in the cosmetic industry, followed by pharmaceutical, industrial, and other industries. Packaging for Perfumes & Health Hygiene items such as body deodorants, perfume sprays, room fresheners, shaving foams, hair colors, and others are among the cosmetic uses which are bound to fuel the market growth during the forecast period.
Lightweight non-aerosol cans and bottles have become more popular in recent years than regular items. Many new manufacturers are focusing on developing more sustainable items that are easy to recycle and have no negative environmental impact. Spending on research and development has grown over the last decade in order to supply customers with a cost-effective product, which will generate several opportunities for the non-aerosol overcaps market during the projected period. Here are a few of the non-aerosol overcaps start-ups:
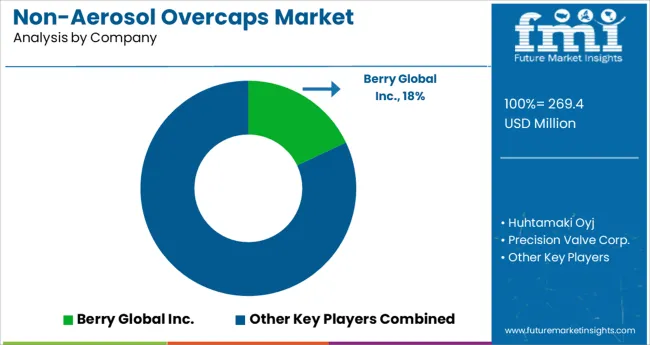
Prominent players in the Non-Aerosol Overcaps market are Berry Global Inc., Huhtamaki Oyj, Precision Valve Corp., Claytoon Corp., O.Berk Company, Cobra Plastics, Dubuque Plastics, InterPac International LLC and Rieke Corp, among others. The competitors in the non-aerosol overcaps market are attempting to expand their market reach by establishing a presence in previously unexplored regions. Furthermore, the leading companies are attempting to focus on growing their production capacity through the development of manufacturing facilities or acquisitions.
| Report Attribute | Details |
|---|---|
| Growth Rate | CAGR of 4.2% from 2025 to 2035 |
| Market Value in 2025 | USD 269.4 million |
| Market Value in 2035 | USD 406.5 million |
| Base Year for Estimation | 2024 |
| Historical Data | 2020 to 2024 |
| Forecast Period | 2025 to 2035 |
| Quantitative Units | Revenue in million and CAGR from 2025 to 2035 |
| Report Coverage | Revenue Forecast, Company Ranking, Competitive Landscape, Growth Factors, Trends, and Pricing Analysis |
| Segments Covered | Material Used, Diameter, Application, End-use Industries, Region |
| Regions Covered | North America; Latin America; Europe; East Asia; South Asia; Middle East and Africa; Oceania |
| Key Countries Profiled | The USA, Canada, Brazil, Mexico, Germany, The United Kingdom, France, Spain, Italy, China, Japan, South Korea, India, Malaysia, Singapore, Thailand, Australia, New Zealand, GCC, South Africa, Israel |
| Key Companies Profiled | Berry Global Inc.; Huhtamaki Oyj; Precision Valve Corp.; Claytoon Corp.; O. Berk Company; Cobra Plastics; Dubuque Plastics; InterPac International LLC; Rieke Corp; Limner Technology Co. Ltd.; Wuzhi Sunmart Science and Technology Co. Ltd.; Whea-Stone Co. Ltd.; Daisaku Trading Co. Ltd.; Dhiren Plastic Industries; AG Poly Packs |
| Customization & Pricing | Available upon Request |
The global non-aerosol overcaps market is estimated to be valued at USD 269.4 million in 2025.
It is projected to reach USD 406.5 million by 2035.
The market is expected to grow at a 4.2% CAGR between 2025 and 2035.
The key product types are plastic non-aerosol overcaps, _polyethylene, _polypropylene, _others, metal non-aerosol overcaps, _aluminium, _steel and others.
non-aerosol overcaps measuring 31 to 40 mm segment is expected to dominate with a 35.0% industry share in 2025.


Full Research Suite comprises of:
Market outlook & trends analysis
Interviews & case studies
Strategic recommendations
Vendor profiles & capabilities analysis
5-year forecasts
8 regions and 60+ country-level data splits
Market segment data splits
12 months of continuous data updates
DELIVERED AS:
PDF EXCEL ONLINE
Overcaps Market Growth - Demand & Trends Forecast 2025 to 2035

Thank you!
You will receive an email from our Business Development Manager. Please be sure to check your SPAM/JUNK folder too.
Chat With
MaRIA