Non-Sterile Liquids/Suspensions Market Snapshot

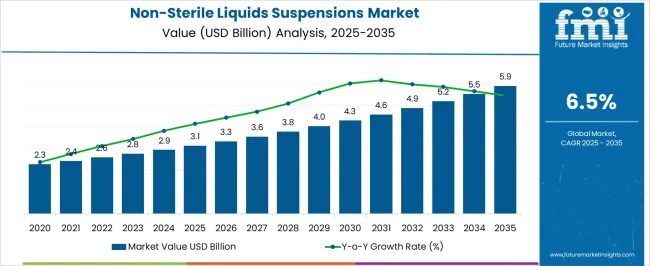
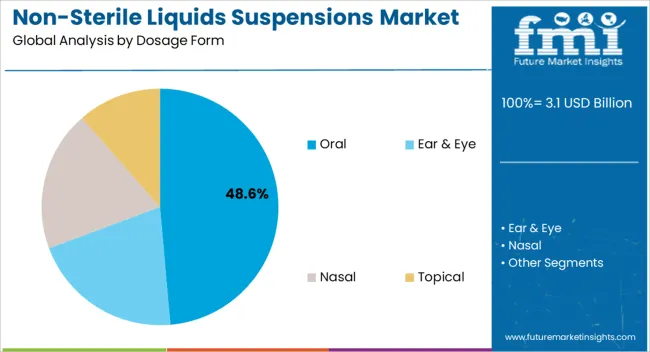
The global non-sterile liquids/suspensions market held a valuation of US$ 2.6 Billion in 2022, and it is further projected to expand at a CAGR of 6.5% over the forecasted years. According to a recent study by Future Market Insights, the oral dosage form is leading the market with a share of about 29.5% in the year 2022, within the global market.

Market Outlook:

Data Points Market Insights
Market Value 2022 US$ 2.6 Billion
Market Value 2033 US$ 5.2 Billion
CAGR  2023 to 2033 6.5%
Market Share of Top 5 Countries 53.0%
Key Market Players AbbVie Pharmaceutical Contract Manufacturing, Aenova Group, APPCO Pharmaceutical Corporation, Atral Pharmaceutical, Aurigene Pharmaceutical Services (Dr. Reddy’s), Biological E. Ltd., BioPlus Life Sciences, Bora Pharmaceuticals, Cambrex Corporation, COC Farmaceutici, Contract Pharmaceuticals Limited (CPL), DPT Laboratories, Ltd., Eurofins, JGL d.d., Mikart, PharmaVision (Vizyon Holding), Pierre Fabre, TriRx Pharmaceutical Services, UI Pharmaceuticals, Wasdell Group, Aphena Pharma, and Syngene International

Active pharmaceutical ingredients (API) are dissolved in aqueous and non-aqueous solvents, suspended in suitable media, or incorporated into oil or water phases to create liquid dosage forms. As a result, there are many different formulations of pharmaceutical liquids. Liquids that are not sterile are prepared in settings that are clean but not entirely sterile. These non-sterile liquid pharmaceuticals can be applied internally or externally. An oral or topical route of drug administration can be used to provide a non-sterile liquid dose form. Moreover, liquid dosage forms provide advantages over other specialized dosage forms, including better patient compliance, quicker absorption, and more dosing flexibility.

Don't pay for what you don't need

Customize your report by selecting specific countries or regions and save 30%!

Sales Analysis of Non-Sterile Liquids/Suspensions Market from 2012 to 2022 Vs Market Outlook for 2023 to 2033.

The global sales of the market are anticipated to rise at a CAGR of 6.5% between 2023 and 2033, owing to the various applications in a wide range of medication formulations. The demand for these products is increasing with respect to the pediatric and geriatric formulations and apart from this, the convenience and compliance provided by the products like mouth washes, gels, creams in reference to the way they are applied or consumed is something which fuels the growth of this market.

The global market holds around 7.3% share of the overall global solvent market with a value of around US$ 35.6 Billion, in 2022.

Non-sterile liquids/suspensions can be used to deliver a variety of medications, including prescription drugs, non-prescription drugs, vitamins, dietary supplements, and nutraceuticals. As the population ages, there is a growing demand for formulations that address the specific needs of the elderly. Pediatric formulations are also gaining traction, driven by the need for dosage forms that are easier to administer in children, example oral dosage forms. Pharmaceutical formulations, such as oral syrups, cough medicines, and other liquid drugs, frequently contain non-sterile liquids and suspensions. The demand for medicines may be influenced by the expanding access to healthcare in emerging nations, the rising prevalence of chronic diseases, and the expanding use of non-sterile fluids or suspensions.

It is also typical practice to produce nutraceuticals and nutritional supplements, such as vitamins, minerals, and botanical extracts, using non-sterile liquid or suspension formulations. The demand for non-sterile liquid or suspension formulations in this sector may rise as a result of rising consumer knowledge of the advantages of nutraceuticals and dietary supplements for health and wellness.

The aforementioned factors are expected to cause the global market to expand swiftly and reach an estimated value of US$ 5.2 Billion in 2033.

What are the Key Opportunities for the Manufacturers Operating in the Global Market?

Due to ease of administration, better taste, and easier swallowing, many consumers, especially kids and elderly patients, may choose liquid formulations over solid dose forms like tablets or capsules. This can result in a rise in demand for non-sterile suspension or liquid formulations. This growing preference of liquid formulations would present lucrative opportunities for the market in the coming years.

Moreover, the creation of non-sterile liquids or suspensions with improved drug stability, bioavailability, and therapeutic efficacy may be made possible by the development of innovative drug delivery technologies like nanotechnology, liposomes, and microencapsulation. The market for non-sterile liquid or suspension formulations may be stimulated by these developments. In fact, companies today are utilizing cutting-edge technologies to improve both patient compliance and the bioavailability of dose forms.

Sabyasachi Ghosh
Sabyasachi Ghosh

Principal Consultant

Talk to Analyst

Find your sweet spots for generating winning opportunities in this market.

What are the Factors Restraining Demand within the Global Market?

Non-sterile liquid or suspension formulations may need to adhere to stringent regulatory criteria, such as those for quality assurance, safety, labeling, and manufacturing procedures. The market may be constrained by meeting these legal standards because they can be time-consuming and expensive, especially for startups or smaller firms.

Other than this, in comparison to solid dosage forms, non-sterile liquids or suspensions may have a shorter shelf life because they may be more prone to deterioration, microbial development, and other stability issues. This could shorten the shelf life of non-sterile liquid or suspension items, which might lead to product waste and higher expenditures for product expiry or recalls.
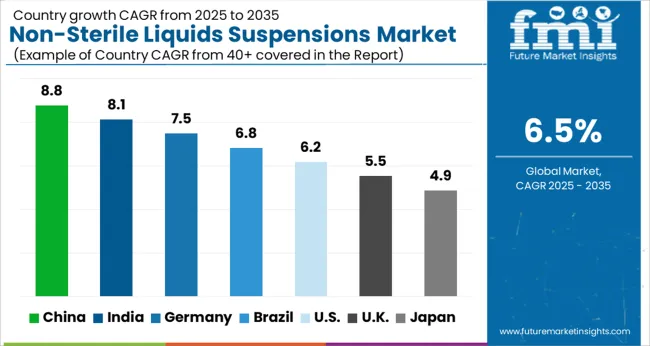
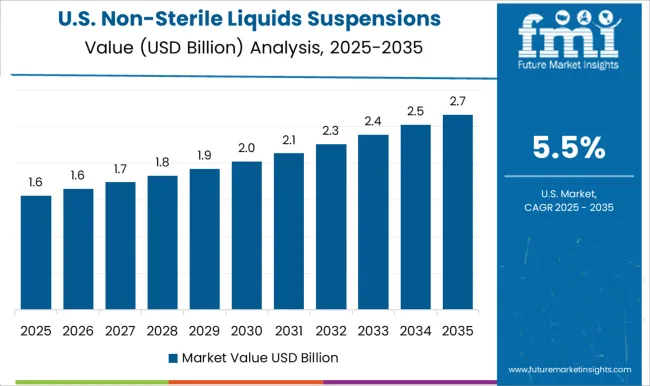
Country-wise Insights

What Makes the USA a Large Market for Non-Sterile Liquids/Suspensions?

The USA dominated the North American region with market share of around 23.3% in the global market in 2022.

The USA market for non-sterile liquids/suspensions is driven by several factors, including the increasing demand for oral and topical dosage forms, the need for customized solutions that are designed for palatability and patient compliance, and the cost-effectiveness of non-sterile formulations compared to sterile formulations.

The USA market is characterized by a high level of innovation and technological advancement, which drives the development of new and improved non-sterile liquid/suspension formulations. The use of advanced technologies such as nanotechnology, microencapsulation, and spray drying can improve the stability, bioavailability, and efficacy of non-sterile liquid/suspension formulations.
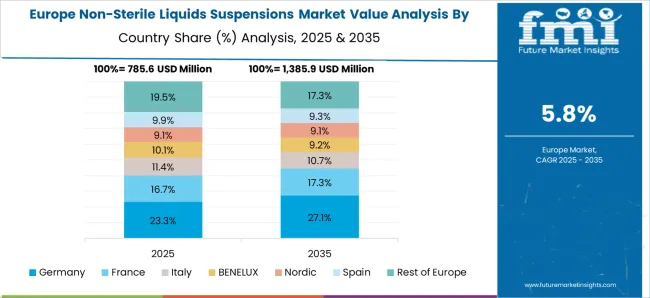
What is the Scenario of Germany within the Global Market Space?

Germany held a market share of 4.9% in 2022 in the global market. Non-sterile liquids/suspensions are frequently used to treat a variety of medical conditions such as cough, cold, allergies, and pain relief. The rising demand for OTC medications is propelling this market forward in this region.

With a focus on enhancing the patient experience and medication adherence, there is an increasing emphasis on patient-centric treatment in Germany. Non-sterile liquid or suspension formulations may have benefits for patients in terms of dosing flexibility, ease of administration, and patient convenience, all of which are consistent with patient-centric care paradigms.

The elderly population in Germany may have particular demands and preferences when it comes to the administration of medications. Older adults who may have trouble swallowing pills or capsules may prefer non-sterile liquid or suspension forms, which could increase demand for these formulations.

What is the Outlook of India in the Global Market?

India had a market share of 8.8% in the global market in 2022. India's population is large and growing, which is driving demand for non-sterile liquids/suspensions. Chronic diseases such as diabetes, cardiovascular disease, and cancer are becoming more common in India. With a population of over 1.3 Billion people, India has a high demand for pharmaceutical products, including non-sterile liquids/suspensions. The increasing population and urbanization in India have led to a rise in the prevalence of diseases and health conditions, which has increased the demand for medications.

Get the data you need at a Fraction of the cost

Personalize your report by choosing insights you need
and save 40%!

Category-wise Insights

Which Dosage Form is Driving the Market Growth of Non-Sterile Liquids/Suspensions?

The oral dosage form held a market share of 29.5% in the global market in 2022.

For patients who might have trouble swallowing solid dosage forms like pills or capsules, non-sterile liquid or suspension formulations are frequently simple to administer. They are thus especially well-suited for certain patient groups, including kids, the elderly, and people who have trouble swallowing or who have other medical issues that make it difficult to take solid dosage forms. Many patients prefer liquid or suspension formulations due to their ease of use, convenience, and familiarity. This can contribute to the wide acceptance of oral dosage forms in the non-sterile liquid or suspensions market, as patient preference and convenience are important factors in medication selection and adherence.

Which Application Holds a Larger Share within the Global Market?

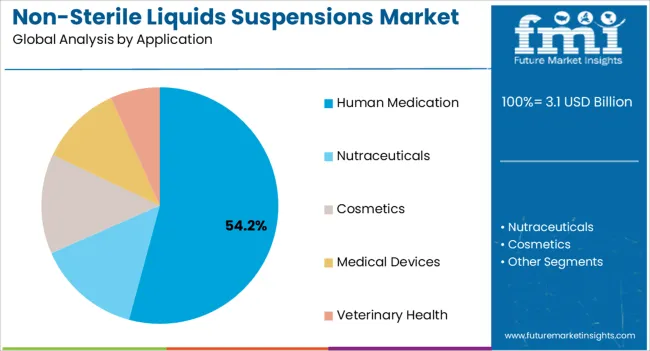
The human medication segment held a market share of 40.1% in the global market in 2022. It is expected to expand due to technological advancements in disease diagnosis and treatment and increasing human populations with various acute diseases like acute pain and cold symptoms, and chronic diseases like cancer and diabetes. This further increases the adoption of pharmaceutical medicines.

Overall, the use of non-sterile liquids/suspensions in human medication offers advantages like enhanced bioavailability, rapid onset of action, improved medication adherence, and flexible dosing, thus driving the global market.

Which End User Benefits the Most from the Sales within the Market?

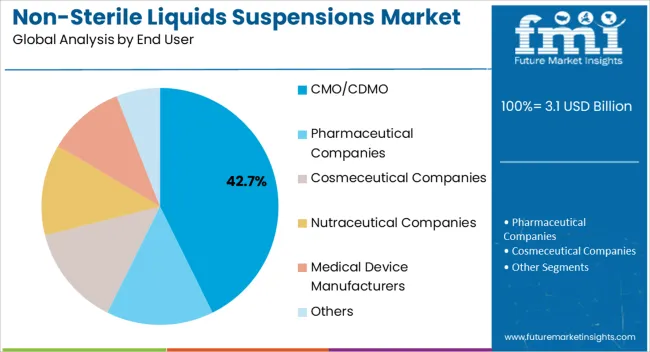
Pharmaceutical companies held a market share of 33.1% in the year 2022. Pharmaceutical companies are using more non-sterile liquids/suspensions in the production of medications due to the various advantages associated with formulations in human medications and veterinary medications. Pharmaceutical companies are taking non-sterile liquids/suspensions in bulk or package form for various applications like various dosage formulations with parenteral as well for rinsing of equipment. Apart from this, the rising number of pharmaceutical companies around the globe is another point as to which it dominates this segment.
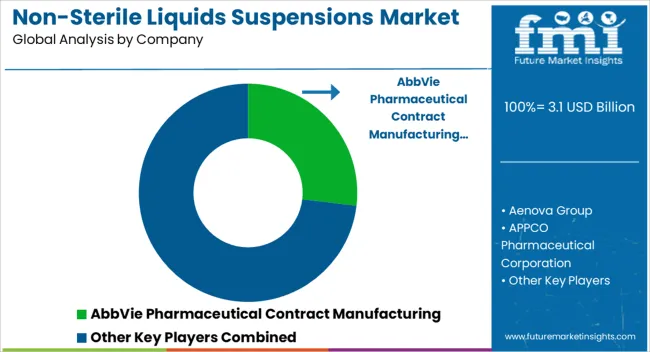
Competitive Landscape

Key players are focusing on agreements, mergers, partnerships, collaborations, and acquisitions as well as the introduction and commercialization of novel products and pharmaceuticals in order to broaden their clientele and raise business income. A few examples of strategies acquired by the key players:

  • On 20th April 2022, BORA Pharmaceuticals reported a strategically planned investment of US $10 Million to extend its drug development ability in present services in regions like Zhunan, Taiwan and Mississauga, and Ontario.
  • On 17th November 2019, UI Pharmaceuticals opened a new 16,000 sq. ft. state-of-the-art sterile manufacturing facility.
  • On 27th November 2017, with a new 70,000 sq. ft. manufacturing facility at the IDA Dundalk Science and Technology Park, Mullagharlin, Wasdell Group declared its entry into the Irish market.

Similarly, recent developments related to non-sterile liquids/suspensions market has been tracked by the team at Future Market Insights. These are available in the full report.

Report Scope as per Non-Sterile Liquids/Suspensions Market Analysis

Attribute Details
Historical Data Available for 2023 to 2033
Forecast Period 2012 to 2022
Market Analysis US$ Million for Value
Key Regions Covered North America, Latin America, Europe, South Asia, East Asia, Oceania, and the Middle East & Africa
Key Countries Covered USA, Canada, Mexico, Brazil, Argentina, United Kingdom., Germany, Italy, Spain, France, Russia, Benelux, India, Thailand, Indonesia, Malaysia, Japan, China, South Korea, Australia, New Zealand, Türkiye, GCC Countries, and South Africa
Key Market Segments Covered Dosage Form, Application, End User, and Region
Key Companies Profiled
  • AbbVie Pharmaceutical Contract Manufacturing
  • Aenova Group
  • APPCO Pharmaceutical Corporation
  • Atral Pharmaceutical
  • Aurigene Pharmaceutical Services (Dr. Reddy’s)
  • Biological E. Ltd.
  • BioPlus Life Sciences
  • Bora Pharmaceuticals
  • Cambrex Corporation
  • COC Farmaceutici
  • Contract Pharmaceuticals Limited (CPL)
  • DPT Laboratories, Ltd.
  • Eurofins
  • JGL d.d.
  • Mikart
  • PharmaVision (Vizyon Holding)
  • Pierre Fabre
  • TriRx Pharmaceutical Services
  • UI Pharmaceuticals
  • Wasdell Group
  • Aphena Pharma
  • Syngene International
Pricing Available upon Request

Key Market Segments Covered in the Industry Research

Dosage Form:

  • Oral
    • Mixtures
    • Linctures
    • Syrups
    • Elixirs
    • Mouth Washes/Gargles
    • Drops
  • Ear & Eye
    • Drops
    • Lotions
  • Nasal
    • Drops
    • Sprays
  • Topical
    • Gel
    • Creams
  • Parenteral

Application:

  • Human Medication
  • Nutraceuticals
  • Cosmetics
  • Medical Devices
  • Veterinary Health

End User:

  • CMO/CDMO
  • Pharmaceutical Companies
    • Human
    • Veterinary
  • Cosmeceutical Companies
  • Nutraceutical Companies
  • Medical Device Manufacturers
  • Others

Region:

  • North America
  • Latin America
  • Europe
  • South Asia
  • East Asia
  • Oceania
  • Middle East and Africa (MEA)

Frequently Asked Questions

How was the Historical Performance of the Market?

From 2018 to 2022, the market registered a CAGR of 7.3%.

How Big Will the Non-sterile Liquids/Suspensions Market by 2033?

The market is estimated to reach US$ 5.2 billion by 2033.

Which Application Holds Lucrative Opportunities?

Human medication hold high revenue potential.

Which Countries Dominate the Global Market?

The United States, Japan, and the United Kingdom dominate the global market.

What is the Growth Forecast for Non-sterile Liquids/Suspensions Market?

The market is forecast to register a CAGR of 6.5% through 2033.

Table of Content
1. Executive Summary | Non-Sterile Liquids/Suspensions Market

    1.1. Global Market Outlook

    1.2. Demand Side Trends

    1.3. Supply-Side Trends

    1.4. Analysis and Recommendations

2. Market Overview

    2.1. Market Coverage / Taxonomy

    2.2. Market Definition / Scope / Limitations

    2.3. Inclusions and Exclusions

3. Key Market Trends

    3.1. Key Trends Impacting the Market

    3.2. Product Innovation / Development Trends

4. Value-Added Insights

    4.1. Product Adoption / Usage Analysis, By Region

    4.2. List of Key Contract Manufacturing Organizations (CMOs) and Contract Development & Manufacturing Organizations (CDMOs)

    4.3. Porter’s analysis 

    4.4. PESTEL analysis

    4.5. Key Regulations

    4.6. Value Chain Analysis

5. Market Background

    5.1. Macro-Economic Factors

        5.1.1. Global GDP Growth Outlook

        5.1.2. Global Healthcare Industry Market Outlook

        5.1.3. Global Pharmaceutical Water Market Outlook

    5.2. Forecast Factors - Relevance & Impact

        5.2.1. Growing Prevalence of Diseases

        5.2.2. Growing Pediatric and Geriatric Population

        5.2.3. Increase in Adoption Rate

        5.2.4. Growth in Production Capacity

        5.2.5. Sales Expansion

        5.2.6. Quality Control Issues

        5.2.7. Increasing Number of CMOs/CDMOs

        5.2.8. Top Companies Historical Growth

    5.3. Market Dynamics

        5.3.1. Drivers

        5.3.2. Restraints

        5.3.3. Opportunity 

6. COVID-19 Crisis  to  Impact Assessment

    6.1. COVID-19 and Impact Analysis

        6.1.1. Revenue By Dosage Form

        6.1.2. Revenue By Application

        6.1.3. Revenue By End User

        6.1.4. Revenue By Country

    6.2. 2022 Scenario

7. Global Market Demand (in Value or Size in US$ Million) Analysis 2012 to 2022 and Forecast, 2023 to 2033

    7.1. Historical Market Value (US$ Million) Analysis, 2012 to 2022 

    7.2. Current and Future Market Value (US$ Million) Projections, 2023 to 2033

        7.2.1. Y-o-Y Growth Trend Analysis

        7.2.2. Absolute $ Opportunity Analysis

8. Global Market Analysis 2012 to 2022 and Forecast 2023 to 2033, By Dosage Form  

    8.1. Introduction / Key Findings

    8.2. Historical Market Size (US$ Million) Analysis By Dosage Form, 2012 to 2022 

    8.3. Current and Future Market Size (US$ Million) Analysis and Forecast By Dosage Form, 2023 to 2033

        8.3.1. Oral

            8.3.1.1. Mixtures

            8.3.1.2. Linctures

            8.3.1.3. Syrups

            8.3.1.4. Elixirs

            8.3.1.5. Mouth Washes/Gargles

            8.3.1.6. Drops

        8.3.2. Ear & Eye

            8.3.2.1. Drops

            8.3.2.2. Lotions

        8.3.3. Nasal

            8.3.3.1. Drops

            8.3.3.2. Sprays

        8.3.4. Topical

            8.3.4.1. Gel

            8.3.4.2. Creams

        8.3.5. Parenteral

    8.4. Market Attractiveness Analysis By Dosage Form 

9. Global Market Analysis 2012 to 2022 and Forecast 2023 to 2033, By Application

    9.1. Introduction / Key Findings

    9.2. Historical Market Size (US$ Million) By Application, 2012 to 2022 

    9.3. Current and Future Market Size (US$ Million) Analysis and Forecast By Application, 2023 to 2033

        9.3.1. Human Medication

        9.3.2. Nutraceuticals

        9.3.3. Cosmetics

        9.3.4. Medical Devices

        9.3.5. Veterinary Health

    9.4. Market Attractiveness Analysis By Application

10. Global Market Analysis 2012 to 2022 and Forecast 2023 to 2033, By End User

    10.1. Introduction / Key Findings

    10.2. Historical Market Size (US$ Million) By End User, 2012 to 2022 

    10.3. Current and Future Market Size (US$ Million) Analysis and Forecast By End User, 2023 to 2033

        10.3.1. CMO/CDMO

        10.3.2. Pharmaceutical Companies

            10.3.2.1. Human

            10.3.2.2. Veterinary

        10.3.3. Cosmeceutical Companies

        10.3.4. Nutraceutical Companies

        10.3.5. Medical Device Manufacturers

        10.3.6. Others

    10.4. Market Attractiveness Analysis By End User

11. Global Market Analysis 2012 to 2022 and Forecast 2023 to 2033, By Region

    11.1. Introduction

    11.2. Historical Market Size (US$ Million) Analysis By Region, 2012 to 2022 

    11.3. Current and Future Market Size (US$ Million) Analysis and Forecast By Region, 2023 to 2033

        11.3.1. North America

        11.3.2. Latin America

        11.3.3. Europe

        11.3.4. East Asia

        11.3.5. South Asia

        11.3.6. Oceania

        11.3.7. Middle East and Africa (MEA)

    11.4. Market Attractiveness Analysis By Region

12. North America Market Analysis 2012 to 2022 and Forecast 2023 to 2033

    12.1. Introduction

    12.2. Historical Market Size (US$ Million) Trend Analysis by Market Taxonomy, 2012 to 2022 

    12.3. Current and Future Market Size (US$ Million) Analysis and Forecast by Market Taxonomy, 2023 to 2033

        12.3.1.  By Country

            12.3.1.1. U.S.

            12.3.1.2. Canada

        12.3.2. By Dosage Form 

        12.3.3. By Application

        12.3.4. By End User

    12.4. Market Attractiveness Analysis

        12.4.1. By Country

        12.4.2. By Dosage Form

        12.4.3. By Application

        12.4.4. By End User

    12.5. Market Trends

    12.6. Key Market Participants - Intensity Mapping

    12.7. Drivers and Restraints - Impact Analysis

    12.8. Country Level Analysis & Forecast

        12.8.1. U.S. Market Analysis

            12.8.1.1.  Introduction

            12.8.1.2. Market Analysis and Forecast by Market Taxonomy

                12.8.1.2.1. By Dosage Form

                12.8.1.2.2. By Application

                12.8.1.2.3. By End User

        12.8.2. Canada Market Analysis

            12.8.2.1. Introduction

            12.8.2.2. Market Analysis and Forecast by Market Taxonomy

                12.8.2.2.1. By Dosage Form

                12.8.2.2.2. By Application

                12.8.2.2.3. By End User

13. Latin America Market Analysis 2012 to 2022 and Forecast 2023 to 2033

    13.1. Introduction

    13.2. Historical Market Size (US$ Million) Trend Analysis by Market Taxonomy, 2012 to 2022 

    13.3. Current and Future Market Size (US$ Million) Analysis and Forecast by Market Taxonomy, 2023 to 2033

        13.3.1.  By Country

            13.3.1.1. Mexico

            13.3.1.2. Brazil

            13.3.1.3. Argentina

            13.3.1.4. Rest of Latin America

        13.3.2. By Dosage Form 

        13.3.3. By Application

        13.3.4. By End User

    13.4. Market Attractiveness Analysis

        13.4.1. By Country

        13.4.2. By Dosage Form

        13.4.3. By Application

        13.4.4. By End User

    13.5. Market Trends

    13.6. Key Market Participants - Intensity Mapping

    13.7. Drivers and Restraints - Impact Analysis

    13.8. Country Level Analysis & Forecast

        13.8.1. Mexico Market Analysis

            13.8.1.1. Introduction

            13.8.1.2. Market Analysis and Forecast by Market Taxonomy

                13.8.1.2.1. By Dosage Form

                13.8.1.2.2. By Application

                13.8.1.2.3. By End User

        13.8.2. Brazil Market Analysis

            13.8.2.1. Introduction

            13.8.2.2. Market Analysis and Forecast by Market Taxonomy

                13.8.2.2.1. By Dosage Form

                13.8.2.2.2. By Application

                13.8.2.2.3. By End User

        13.8.3. Argentina Market Analysis

            13.8.3.1. Introduction

            13.8.3.2. Market Analysis and Forecast by Market Taxonomy

                13.8.3.2.1. By Dosage Form

                13.8.3.2.2. By Application

                13.8.3.2.3. By End User

14. Europe Market Analysis 2012 to 2022 and Forecast 2023 to 2033

    14.1. Introduction

    14.2. Historical Market Size (US$ Million) Trend Analysis by Market Taxonomy, 2012 to 2022 

    14.3. Current and Future Market Size (US$ Million) Analysis and Forecast by Market Taxonomy, 2023 to 2033

        14.3.1.  By Country

            14.3.1.1. United Kingdom

            14.3.1.2. Germany

            14.3.1.3. France 

            14.3.1.4. Italy

            14.3.1.5. Spain

            14.3.1.6. BENELUX

            14.3.1.7. Russia

            14.3.1.8. Rest of Europe

        14.3.2. By Dosage Form

        14.3.3. By Application

        14.3.4. By End User

    14.4. Market Attractiveness Analysis

        14.4.1. By Country

        14.4.2. By Dosage Form

        14.4.3. By Application

        14.4.4. By End User

    14.5. Key Market Participants - Intensity Mapping

    14.6. Drivers and Restraints - Impact Analysis

    14.7. Country Level Analysis & Forecast

        14.7.1. The United Kingdom Market Analysis

            14.7.1.1. Introduction

            14.7.1.2. Market Analysis and Forecast by Market Taxonomy

                14.7.1.2.1. By Dosage Form

                14.7.1.2.2. By Application

                14.7.1.2.3. By End User

        14.7.2. Germany Market Analysis

            14.7.2.1. Introduction

            14.7.2.2. Market Analysis and Forecast by Market Taxonomy

                14.7.2.2.1. By Dosage Form

                14.7.2.2.2. By Application

                14.7.2.2.3. By End User

        14.7.3. France Market Analysis

            14.7.3.1. Introduction

            14.7.3.2. Market Analysis and Forecast by Market Taxonomy

                14.7.3.2.1. By Dosage Form

                14.7.3.2.2. By Application

                14.7.3.2.3. By End User

        14.7.4. Italy Market Analysis

            14.7.4.1. Introduction

            14.7.4.2. Market Analysis and Forecast by Market Taxonomy

                14.7.4.2.1. By Dosage Form

                14.7.4.2.2. By Application

                14.7.4.2.3. By End User

        14.7.5. Spain Market Analysis

            14.7.5.1. Introduction

            14.7.5.2. Market Analysis and Forecast by Market Taxonomy

                14.7.5.2.1. By Dosage Form

                14.7.5.2.2. By Application

                14.7.5.2.3. By End User

        14.7.6. BENELUX Market Analysis

            14.7.6.1. Introduction

            14.7.6.2. Market Analysis and Forecast by Market Taxonomy

                14.7.6.2.1. By Dosage Form

                14.7.6.2.2. By Application

                14.7.6.2.3. By End User

        14.7.7. Russia Market Analysis

            14.7.7.1. Introduction

            14.7.7.2. Market Analysis and Forecast by Market Taxonomy

                14.7.7.2.1. By Dosage Form

                14.7.7.2.2. By Application

                14.7.7.2.3. By End User

15. East Asia Market Analysis 2012 to 2022 and Forecast 2023 to 2033

    15.1. Introduction

    15.2. Historical Market Size (US$ Million) Trend Analysis by Market Taxonomy, 2012 to 2022 

    15.3. Current and Future Market Size (US$ Million) Analysis and Forecast by Market Taxonomy, 2023 to 2033

        15.3.1.  By Country

            15.3.1.1. China

            15.3.1.2. Japan

            15.3.1.3. South Korea

        15.3.2. By Dosage Form

        15.3.3. By Application

        15.3.4. By End User

    15.4. Market Attractiveness Analysis

        15.4.1. By Country

        15.4.2. By Dosage Form

        15.4.3. By Application

        15.4.4. By End User

    15.5. Key Market Participants - Intensity Mapping

    15.6. Drivers and Restraints - Impact Analysis

    15.7. Country Level Analysis & Forecast

        15.7.1. China Market Analysis

            15.7.1.1. Introduction

            15.7.1.2. Market Analysis and Forecast by Market Taxonomy

                15.7.1.2.1. By Dosage Form

                15.7.1.2.2. By Application

                15.7.1.2.3. By End User

        15.7.2. Japan Market Analysis

            15.7.2.1. Introduction

            15.7.2.2. Market Analysis and Forecast by Market Taxonomy

                15.7.2.2.1. By Dosage Form

                15.7.2.2.2. By Application

                15.7.2.2.3. By End User

        15.7.3. South Korea Market Analysis

            15.7.3.1. Introduction

            15.7.3.2. Market Analysis and Forecast by Market Taxonomy

                15.7.3.2.1. By Dosage Form

                15.7.3.2.2. By Application

                15.7.3.2.3. By End User

16. South Asia Market Analysis 2012 to 2022 and Forecast 2023 to 2033

    16.1. Introduction

    16.2. Historical Market Size (US$ Million) Trend Analysis by Market Taxonomy, 2012 to 2022 

    16.3. Current and Future Market Size (US$ Million) Analysis and Forecast by Market Taxonomy, 2023 to 2033

        16.3.1.  By Country

            16.3.1.1. India

            16.3.1.2. Malaysia

            16.3.1.3. Thailand

            16.3.1.4. Indonesia

            16.3.1.5. Rest of South Asia

        16.3.2. By Dosage Form

        16.3.3. By Application

        16.3.4. By End User

    16.4. Market Attractiveness Analysis

        16.4.1. By Country

        16.4.2. By Dosage Form

        16.4.3. By Application

        16.4.4. By End User

    16.5. Key Market Participants - Intensity Mapping

    16.6. Drivers and Restraints - Impact Analysis

    16.7. Country Level Analysis & Forecast

        16.7.1. India Market Analysis

            16.7.1.1. Introduction

            16.7.1.2. Market Analysis and Forecast by Market Taxonomy

                16.7.1.2.1. By Dosage Form

                16.7.1.2.2. By Application 

                16.7.1.2.3. By End User

        16.7.2. Malaysia Market Analysis

            16.7.2.1. Introduction

            16.7.2.2. Market Analysis and Forecast by Market Taxonomy

                16.7.2.2.1. By Dosage Form

                16.7.2.2.2. By Application

                16.7.2.2.3. By End User

        16.7.3. Thailand Market Analysis

            16.7.3.1. Introduction

            16.7.3.2. Market Analysis and Forecast by Market Taxonomy

                16.7.3.2.1. By Dosage Form

                16.7.3.2.2. By Application

                16.7.3.2.3. By End User

        16.7.4. Indonesia Market Analysis

            16.7.4.1. Introduction

            16.7.4.2. Market Analysis and Forecast by Market Taxonomy

                16.7.4.2.1. By Dosage Form

                16.7.4.2.2. By Application

                16.7.4.2.3. By End User

17. Oceania Market 2012 to 2022 and Forecast 2023 to 2033

    17.1. Introduction

    17.2. Historical Market Size (US$ Million) Trend Analysis by Market Taxonomy, 2012 to 2022 

    17.3. Current and Future Market Size (US$ Million) Analysis and Forecast by Market Taxonomy, 2023 to 2033

        17.3.1.  By Country

            17.3.1.1. Australia

            17.3.1.2. New Zealand

        17.3.2. By Dosage Form

        17.3.3. By Application

        17.3.4. By End User

    17.4. Market Attractiveness Analysis

        17.4.1. By Country

        17.4.2. By Dosage Form

        17.4.3. By Application

        17.4.4. By End User

    17.5. Key Market Participants - Intensity Mapping

    17.6. Drivers and Restraints - Impact Analysis

    17.7. Country Level Analysis & Forecast

        17.7.1. Australia Market Analysis

            17.7.1.1. Introduction

            17.7.1.2. Market Analysis and Forecast by Market Taxonomy

                17.7.1.2.1. By Dosage Form

                17.7.1.2.2. By Application

                17.7.1.2.3. By End User

        17.7.2. New Zealand Market Analysis

            17.7.2.1. Introduction

            17.7.2.2. Market Analysis and Forecast by Market Taxonomy

                17.7.2.2.1. By Dosage Form

                17.7.2.2.2. By Application

                17.7.2.2.3. By End User

18. Middle East and Africa (MEA) Market Analysis 2012 to 2022 and Forecast 2023 to 2033

    18.1. Introduction

    18.2. Historical Market Size (US$ Million) Trend Analysis by Market Taxonomy, 2012 to 2022 

    18.3. Current and Future Market Size (US$ Million) Analysis and Forecast by Market Taxonomy, 2023 to 2033

        18.3.1.  By Country

            18.3.1.1. GCC Countries

            18.3.1.2. Türkiye

            18.3.1.3. South Africa 

            18.3.1.4. Rest of Middle East and Africa

        18.3.2. By Dosage Form

        18.3.3. By Application

        18.3.4. By End User

    18.4. Market Attractiveness Analysis

        18.4.1. By Country

        18.4.2. By Dosage Form

        18.4.3. By Application

        18.4.4. By End User

    18.5. Key Market Participants - Intensity Mapping

    18.6. Drivers and Restraints - Impact Analysis

    18.7. Country Level Analysis & Forecast

        18.7.1. GCC Countries Market Analysis

            18.7.1.1. Introduction

            18.7.1.2. Market Analysis and Forecast by Market Taxonomy

                18.7.1.2.1. By Dosage Form

                18.7.1.2.2. By Application

                18.7.1.2.3. By End User

        18.7.2. Türkiye Market Analysis

            18.7.2.1. Introduction

            18.7.2.2. Market Analysis and Forecast by Market Taxonomy

                18.7.2.2.1. By Dosage Form

                18.7.2.2.2. By Application

                18.7.2.2.3. By End User

        18.7.3. South Africa Market Analysis

            18.7.3.1. Introduction

            18.7.3.2. Market Analysis and Forecast by Market Taxonomy

                18.7.3.2.1. By Dosage Form

                18.7.3.2.2. By Application

                18.7.3.2.3. By End User

19. Market Structure Analysis

    19.1. Market Analysis by Tier of Companies 

    19.2. Market Share Analysis of Top Players (%)

    19.3. Market Presence Analysis

        19.3.1. By Regional Footprint of Players

        19.3.2. Product Footprint of Players

        19.3.3. Channel Footprint of Players

20. Competition Analysis

    20.1. Competition Dashboard

    20.2. Competition Benchmarking

    20.3. Competition Deep Dive 

        20.3.1. AbbVie Pharmaceutical Contract Manufacturing 

            20.3.1.1. Overview

            20.3.1.2. Product Portfolio

            20.3.1.3. Key Financials

            20.3.1.4. SWOT Analysis

            20.3.1.5. Key Developments

            20.3.1.6. Sales Footprint

            20.3.1.7. Strategy Overview

                20.3.1.7.1. Marketing Strategies

                20.3.1.7.2. Product Strategies

                20.3.1.7.3. Channel Strategies

        20.3.2. Aenova Group

            20.3.2.1. Overview

            20.3.2.2. Product Portfolio

            20.3.2.3. Key Financials

            20.3.2.4. SWOT Analysis

            20.3.2.5. Key Developments

            20.3.2.6. Sales Footprint

            20.3.2.7. Strategy Overview

                20.3.2.7.1. Marketing Strategies

                20.3.2.7.2. Product Strategies

                20.3.2.7.3. Channel Strategies

        20.3.3. APPCO Pharmaceutical Corporation

            20.3.3.1. Overview

            20.3.3.2. Product Portfolio

            20.3.3.3. Key Financials

            20.3.3.4. SWOT Analysis

            20.3.3.5. Key Developments

            20.3.3.6. Sales Footprint

            20.3.3.7. Strategy Overview

                20.3.3.7.1. Marketing Strategies

                20.3.3.7.2. Product Strategies

                20.3.3.7.3. Channel Strategies

        20.3.4. Atral Pharmaceutical 

            20.3.4.1. Overview

            20.3.4.2. Product Portfolio

            20.3.4.3. Key Financials

            20.3.4.4. SWOT Analysis

            20.3.4.5. Key Developments

            20.3.4.6. Sales Footprint

            20.3.4.7. Strategy Overview

                20.3.4.7.1. Marketing Strategies

                20.3.4.7.2. Product Strategies

                20.3.4.7.3. Channel Strategies

        20.3.5. Aurigene Pharmaceutical Services (Dr. Reddy’s)

            20.3.5.1. Overview

            20.3.5.2. Product Portfolio

            20.3.5.3. Key Financials

            20.3.5.4. SWOT Analysis

            20.3.5.5. Key Developments

            20.3.5.6. Sales Footprint

            20.3.5.7. Strategy Overview

                20.3.5.7.1. Marketing Strategies

                20.3.5.7.2. Product Strategies

                20.3.5.7.3. Channel Strategies

        20.3.6. Biological E. Ltd.

            20.3.6.1. Overview

            20.3.6.2. Product Portfolio

            20.3.6.3. Key Financials

            20.3.6.4. SWOT Analysis

            20.3.6.5. Key Developments

            20.3.6.6. Sales Footprint

            20.3.6.7. Strategy Overview

                20.3.6.7.1. Marketing Strategies

                20.3.6.7.2. Product Strategies

                20.3.6.7.3. Channel Strategies

        20.3.7. BioPlus Life Sciences

            20.3.7.1. Overview

            20.3.7.2. Product Portfolio

            20.3.7.3. Key Financials

            20.3.7.4. SWOT Analysis

            20.3.7.5. Key Developments

            20.3.7.6. Sales Footprint

            20.3.7.7. Strategy Overview

                20.3.7.7.1. Marketing Strategies

                20.3.7.7.2. Product Strategies

                20.3.7.7.3. Channel Strategies

        20.3.8. Bora Pharmaceuticals

            20.3.8.1. Overview

            20.3.8.2. Product Portfolio

            20.3.8.3. Key Financials

            20.3.8.4. SWOT Analysis

            20.3.8.5. Key Developments

            20.3.8.6. Sales Footprint

            20.3.8.7. Strategy Overview

                20.3.8.7.1. Marketing Strategies

                20.3.8.7.2. Product Strategies

                20.3.8.7.3. Channel Strategies

        20.3.9. Cambrex Corporation

            20.3.9.1. Overview

            20.3.9.2. Product Portfolio

            20.3.9.3. Key Financials

            20.3.9.4. SWOT Analysis

            20.3.9.5. Key Developments

            20.3.9.6. Sales Footprint

            20.3.9.7. Strategy Overview

                20.3.9.7.1. Marketing Strategies

                20.3.9.7.2. Product Strategies

                20.3.9.7.3. Channel Strategies

        20.3.10. COC Farmaceutici

            20.3.10.1. Overview

            20.3.10.2. Product Portfolio

            20.3.10.3. Key Financials

            20.3.10.4. SWOT Analysis

            20.3.10.5. Key Developments

            20.3.10.6. Sales Footprint

            20.3.10.7. Strategy Overview

                20.3.10.7.1. Marketing Strategies

                20.3.10.7.2. Product Strategies

                20.3.10.7.3. Channel Strategies

        20.3.11. Contract Pharmaceuticals Limited (CPL)

            20.3.11.1. Overview

            20.3.11.2. Product Portfolio

            20.3.11.3. Key Financials

            20.3.11.4. SWOT Analysis

            20.3.11.5. Key Developments

            20.3.11.6. Sales Footprint

            20.3.11.7. Strategy Overview

                20.3.11.7.1. Marketing Strategies

                20.3.11.7.2. Product Strategies

                20.3.11.7.3. Channel Strategies

        20.3.12. DPT Laboratories, Ltd.

            20.3.12.1. Overview

            20.3.12.2. Product Portfolio

            20.3.12.3. Key Financials

            20.3.12.4. SWOT Analysis

            20.3.12.5. Key Developments

            20.3.12.6. Sales Footprint

            20.3.12.7. Strategy Overview

                20.3.12.7.1. Marketing Strategies

                20.3.12.7.2. Product Strategies

                20.3.12.7.3. Channel Strategies

        20.3.13. Eurofins

            20.3.13.1. Overview

            20.3.13.2. Product Portfolio

            20.3.13.3. Key Financials

            20.3.13.4. SWOT Analysis

            20.3.13.5. Key Developments

            20.3.13.6. Sales Footprint

            20.3.13.7. Strategy Overview

                20.3.13.7.1. Marketing Strategies

                20.3.13.7.2. Product Strategies

                20.3.13.7.3. Channel Strategies

        20.3.14. JGL d.d.

            20.3.14.1. Overview

            20.3.14.2. Product Portfolio

            20.3.14.3. Key Financials

            20.3.14.4. SWOT Analysis

            20.3.14.5. Key Developments

            20.3.14.6. Sales Footprint

            20.3.14.7. Strategy Overview

                20.3.14.7.1. Marketing Strategies

                20.3.14.7.2. Product Strategies

                20.3.14.7.3. Channel Strategies

        20.3.15. Mikart

            20.3.15.1. Overview

            20.3.15.2. Product Portfolio

            20.3.15.3. Key Financials

            20.3.15.4. SWOT Analysis

            20.3.15.5. Key Developments

            20.3.15.6. Sales Footprint

            20.3.15.7. Strategy Overview

                20.3.15.7.1. Marketing Strategies

                20.3.15.7.2. Product Strategies

                20.3.15.7.3. Channel Strategies

        20.3.16. PharmaVision (Vizyon Holding)

            20.3.16.1. Overview

            20.3.16.2. Product Portfolio

            20.3.16.3. Key Financials

            20.3.16.4. SWOT Analysis

            20.3.16.5. Key Developments

            20.3.16.6. Sales Footprint

            20.3.16.7. Strategy Overview

                20.3.16.7.1. Marketing Strategies

                20.3.16.7.2. Product Strategies

                20.3.16.7.3. Channel Strategies

        20.3.17. Pierre Fabre

            20.3.17.1. Overview

            20.3.17.2. Product Portfolio

            20.3.17.3. Key Financials

            20.3.17.4. SWOT Analysis

            20.3.17.5. Key Developments

            20.3.17.6. Sales Footprint

            20.3.17.7. Strategy Overview

                20.3.17.7.1. Marketing Strategies

                20.3.17.7.2. Product Strategies

                20.3.17.7.3. Channel Strategies

        20.3.18. TriRx Pharmaceutical Services

            20.3.18.1. Overview

            20.3.18.2. Product Portfolio

            20.3.18.3. Key Financials

            20.3.18.4. SWOT Analysis

            20.3.18.5. Key Developments

            20.3.18.6. Sales Footprint

            20.3.18.7. Strategy Overview

                20.3.18.7.1. Marketing Strategies

                20.3.18.7.2. Product Strategies

                20.3.18.7.3. Channel Strategies

        20.3.19. UI Pharmaceuticals

            20.3.19.1. Overview

            20.3.19.2. Product Portfolio

            20.3.19.3. Key Financials

            20.3.19.4. SWOT Analysis

            20.3.19.5. Key Developments

            20.3.19.6. Sales Footprint

            20.3.19.7. Strategy Overview

                20.3.19.7.1. Marketing Strategies

                20.3.19.7.2. Product Strategies

                20.3.19.7.3. Channel Strategies

        20.3.20. Wasdell Group

            20.3.20.1. Overview

            20.3.20.2. Product Portfolio

            20.3.20.3. Key Financials

            20.3.20.4. SWOT Analysis

            20.3.20.5. Key Developments

            20.3.20.6. Sales Footprint

            20.3.20.7. Strategy Overview

                20.3.20.7.1. Marketing Strategies

                20.3.20.7.2. Product Strategies

                20.3.20.7.3. Channel Strategies

        20.3.21. Aphena Pharma

            20.3.21.1. Overview

            20.3.21.2. Product Portfolio

            20.3.21.3. Key Financials

            20.3.21.4. SWOT Analysis

            20.3.21.5. Key Developments

            20.3.21.6. Sales Footprint

            20.3.21.7. Strategy Overview

                20.3.21.7.1. Marketing Strategies

                20.3.21.7.2. Product Strategies

                20.3.21.7.3. Channel Strategies

        20.3.22. Syngene International

            20.3.22.1. Overview

            20.3.22.2. Product Portfolio

            20.3.22.3. Key Financials

            20.3.22.4. SWOT Analysis

            20.3.22.5. Key Developments

            20.3.22.6. Sales Footprint

            20.3.22.7. Strategy Overview

                20.3.22.7.1. Marketing Strategies

                20.3.22.7.2. Product Strategies

                20.3.22.7.3. Channel Strategies

21. Assumptions and Acronyms Used

22. Research Methodology
Recommendations

Healthcare

Pharmaceutical Excipient Market

March 2022

REP-GB-932

April 2024

320 pages

Healthcare

Oral Solid Dosage Pharmaceutical Formulation Market

July 2017

REP-GB-2782

March 2024

315 pages

Healthcare

Ophthalmic Eye Drop Market

May 2021

REP-GB-13140

March 2024

495 pages

Explore Healthcare Insights

View Reports
Future Market Insights

Non-Sterile Liquids/Suspensions Market