Reports

- Global Locations -

Headquarters

Future Market Insights, Inc.

Christiana Corporate, 200
Continental Drive, Suite 401,
Newark, Delaware - 19713,
United States

T: +1-845-579-5705

Americas

Future Market Insights, Inc.

616 Corporate Way, Suite 2-9018,
Valley Cottage, NY 10989, United States

T: +1-347-918-3531

MEA

Future Market Insights

1602-6 Jumeirah Bay X2 Tower, Plot No: JLT-PH2-X2A,
Jumeirah Lakes Towers, Dubai,
United Arab Emirates

Europe

Future Market Insights

3rd Floor, 207 Regent Street,
W1B 3HH London
United Kingdom

T: + 44 (0) 20 8123 9659
D: +44 (0) 20 3287 4268

Asia Pacific

Future Market Insights

IndiaLand Global Tech Park, Unit UG-1, Behind Grand HighStreet, Phase 1, Hinjawadi, MH, Pune – 411057, India

Oncolytic Adenovirus Market Snapshot (2023 to 2033)

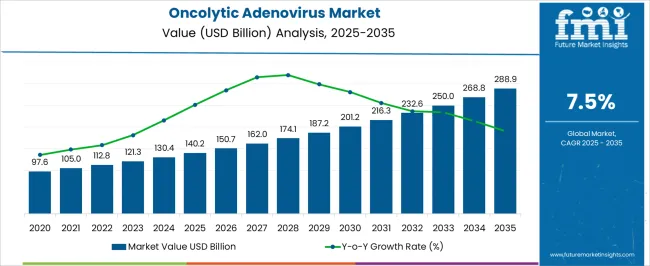
The global oncolytic adenovirus market is expected to garner a market value of US$ 121.30 Billion in 2023 and is expected to accumulate a market value of US$ 250 Billion by registering a CAGR of 7.5% in the forecast period 2023 to 2033. Growth of the oncolytic adenovirus market can be attributed to the Increasing prevalence of oncology globally coupled with a surge in Research and Development efforts to develop novel oncology therapeutics. These are the major driving factors for the market. The market for oncolytic adenovirus registered a CAGR of 4.9% in the historical period 2018 to 2022

Moreover, the presence of various organizations that support immunotherapy research is also expected to fuel market growth. For instance, Parker Institute for Cancer Immunotherapy collaborated with researchers and industry leaders to develop breakthrough immune therapies for cancer.

According to the Global Cancer Observatory, the US reported around 2,281,658 cancer cases in 2020 and 612,390 cancer-related deaths. The most common malignancies affecting the US population are breast, prostate, lung, and colorectal. In addition, according to the Cancer Council, Australia reported 150,000 new cancer cases with 50,000 deaths in 2020. Thus, the surge in the prevalence of malignant tumor cases is anticipated to accelerate market expansion in the coming years.

Report Attribute Details
Expected Market Value (2023) US$ 121.30 Billion
Anticipated Forecast Value (2033) US$ 250 Billion
Projected Growth Rate (2023 to 2033) 7.5% CAGR

Don't pay for what you don't need

Customize your report by selecting specific countries or regions and save 30%!

2017 to 2022 Oncolytic Adenovirus Market Demand Analysis vs. Forecast 2023 to 2033

According to market research and competitive intelligence provider Future Market Insights- the market for oncolytic adenovirus reflected a value of 4.9% during the historical period, 2017 to 2022.

The increasing prevalence of different types of cancers is a significant factor driving the market's growth. In addition, the presence of various immunotherapies to treat cancer at different stages in creating a positive demand for oncolytic adenovirus. Furthermore, the COVID-19 pandemic affected the research and development activities related to oncolytic adenovirus due to the disruption in the supply chain demand globally.

Thus, the market for Oncolytic adenovirus is expected to register a CAGR of 7.5% in the forecast period 2023 to 2033.

Which are Some Prominent Drivers of Oncolytic Adenovirus Market?

Improving patient outcomes by advancing the science and application of oncolytic adenovirus

The presence of various government and non-government organizations that create awareness and promote research is augmenting market expansion. For instance, Cancer Research Institute funded more than 120 clinical trials and invested around USD 474 Billion in research. Moreover, the Society for Immunotherapy of Cancer(SITC) is engaged in improving patient outcomes by advancing the science and application of oncolytic adenovirus. These organizations are working with scientists and researchers to discover novel treatment regimens of immune therapy.

Furthermore, increasing funding for the development of novel treatments is expected to boost Research and Development activities to develop cancer immunotherapy. For instance, in June 2022, Stanford scientists received USD 13 Billion from Cancer Grand Challenges, a funding initiative by Cancer Research UK and the US National Cancer Institute. This funding is awarded for the development of next-generation immunotherapies, the study of extrachromosomal DNA, and the investigation of early-stage malignancies.

Increasing approval of novel immunotherapies is anticipated to propel the market growth over the forecast period. From 2020 to 2022, the U.S. FDA has approved various anti-PD-1/L1 antibodies such as nivolumab, atezolizumab, avelumab, dostarlimab, and others for the treatment of NSCLC, renal cell carcinoma, melanoma, breast, prostate malignancies, and others. The higher approvals of immunotherapeutic agents have propelled the market growth.

Strategic initiatives by leading players propelling the market growth

Various Strategic initiatives undertaken by leading players are also expected to facilitate the market demand. For instance, in August 2022, BioNTech SE and Genmab A/S expanded their strategic collaboration for the development and launch of new immune therapies for the treatment of various cancer forms. Moreover, in March 2022, Merck & Co., Inc announced the approval of KEYTRUDA from the US FDA. KEYTRUDA is an anti-PD-1 therapy for treating advanced endometrial carcinoma.

However, side effects associated with immunotherapy will likely hamper the cancer treatment prescription rate. The available therapies are associated with several adverse effects, such as pain, insomnia, fatigue, nausea, and gastrointestinal conditions. These adverse effects impact the overall quality of life of patients and the management of these adverse effects incurs extra costs. In addition, prolonged consumption of immunotherapeutic drugs may cause severe damage to the organs and increase the incidence of organ failure cases.

Sabyasachi Ghosh
Sabyasachi Ghosh

Principal Consultant

Talk to Analyst

Find your sweet spots for generating winning opportunities in this market.

What are the Challenges Faced by the Oncolytic Adenovirus Market?

Antiviral immune response creating challenges for the oncolytic adenovirus market

Although oncolytic adenovirus has remarkable antitumor potency, it is confronted with tough challenges such as antiviral immune response and obstruction of the tumor microenvironment (TME). This has led to a significant debate on the efficiency and application of oncolytic adenovirus for cancer treatment.

Furthermore, the time taken for approval of therapies and medications for cancer is derailing the progress of the market. In addition, the efficiency of drugs and their long-lasting impact is still being tested. All these factors are hampering the growth of the oncolytic adenovirus market.
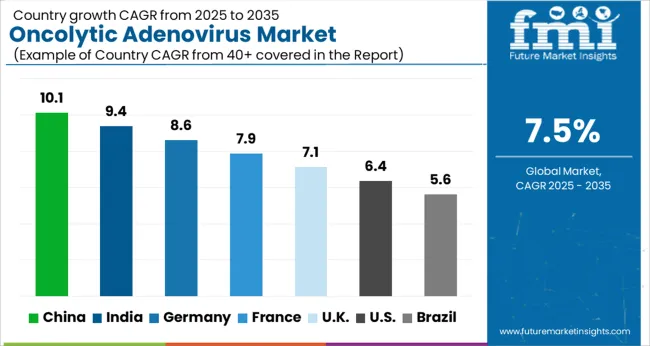
Region-Wise Insights

Strong Presence of Key Players in North America accelerating the Growth of the Oncolytic Adenovirus Market?

Government and non-government organizations supporting research activities for oncolytic adenovirus in North America

In 2022, North America led the overall market in terms of revenue due to the presence of a large number of leading players coupled with various Strategic initiatives undertaken by them. Moreover, the increase in disease prevalence, various government and non-government organizations promoting research activities for cancer immunotherapy, and the increasing approval of novel drugs are fueling the regional market growth. For instance, in April 2022, the US FDA approved Opdivo (nivolumab) for treating NSCLC in adult patients.

Thus, North America is expected to possess a 43% market share for the oncolytic adenovirus market in 2023.

Regulatory Approvals Supporting Growth for Oncolytic Adenovirus Market in the Asia Pacific?

Investments in research and healthcare infrastructure create lucrative opportunities for the oncolytic adenovirus market

Asia Pacific is projected to witness the fastest growth rate over the forecast period. The increase in the geriatric population, a large patient base of targeted diseases, and improving healthcare infrastructure are some of the primary factors driving the growth.

Moreover, the rising regulatory approvals of immune therapies in the region are also contributing region’s expansion. For instance, from 2020 to 2022, the National Medical Products Administration of China approved Pembrolizumab and Durvalumab to treat esophageal cancer and SCLC.

Thus, Asia Pacific is expected to possess a 39% market share for the oncolytic adenovirus market in 2023.

Get the data you need at a Fraction of the cost

Personalize your report by choosing insights you need
and save 40%!

Category-Wise Insights

Prevalence of Lung Malignancies Creating Lucrative Opportunities for Oncolytic Adenovirus?

Product approval for treating lung cancer boosting segment growth

The rising prevalence of lung malignancies, increasing adoption of immunotherapy, rise in awareness programs, and presence of a robust pipeline of investigational candidates are some of the key factors expected to drive the segment's growth. Furthermore, rising product approval and product launches fueling the demand forward. For instance, in October 2021, the US FDA approved Tecentriq (atezolizumab) to treat stage II and stage III NSCLC.

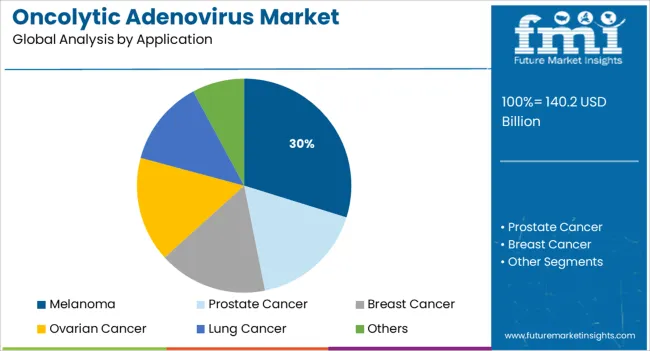
Thus, lung cancer is expected to possess a 35% market share for oncolytic adenovirus in 2023.

Market Competition

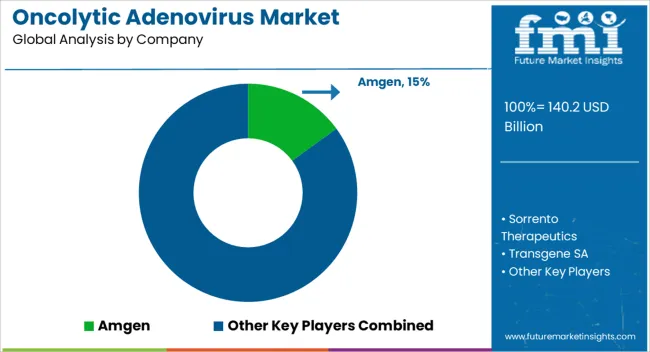
Key players in the oncolytic adenovirus market are Amgen, Sorrento Therapeutics, Transgene SA, Oncolys BioPharma, Targovax, Lokon Pharma, Vyriad, TILT Biotherapeutics, CG Oncology Inc, VCNBiosciences, DNAtrix, Replimune Group Inc

  • In May 2022, Amgen, a key player in the oncolytic adenovirus market stated that Oncolytic immunotherapy aims to build on this potential by using genetically modified viruses to target tumors in two important and complementary ways.
  • Oncolys BioPharma, another key player in the oncolytic adenovirus market, is investing in research and development for innovative medication for oncolytic adenovirus.

Report Scope

Report Attribute Details
Market Value in 2023 US$ 121.30 Billion
Market Value in 2033 US$ 250 Billion
Growth Rate CAGR of 7.5% from 2023 to 2033
Base Year for Estimation 2021
Historical Data 2018 to 2022
Forecast Period 2023 to 2033
Quantitative Units Revenue in USD Billion and CAGR from 2023 to 2033
Report Coverage Revenue Forecast, Volume Forecast, Company Ranking, Competitive Landscape, Growth Factors, Trends, and Pricing Analysis
Segments Covered
  • Type
  • Application
  • Region
Regions Covered
  • North America
  • Latin America
  • Western Europe
  • Eastern Europe
  • Asia Pacific Excluding Japan
  • Japan
  • Middle East and Africa (MEA)
Key Countries Profiled
  • The US
  • Canada
  • Brazil
  • Argentina
  • Germany
  • The UK
  • France
  • Spain
  • Italy
  • Nordics
  • BENELUX
  • Australia & New Zealand
  • China
  • India
  • Association of Southeast Asian Nations
  • GCC Countries
  • South Africa
Key Companies Profiled
  • Amgen
  • Sorrento Therapeutics
  • Transgene SA
  • Oncolys BioPharma
  • Targovax
  • Lokon Pharma
  • Vyriad
  • TILT Biotherapeutics
  • CG Oncology Inc
  • VCNBiosciences
  • DNAtrix
  • Replimune Group Inc
Customization Available Upon Request

Key Segments Profiled in the Oncolytic Adenovirus Industry Survey

Type:

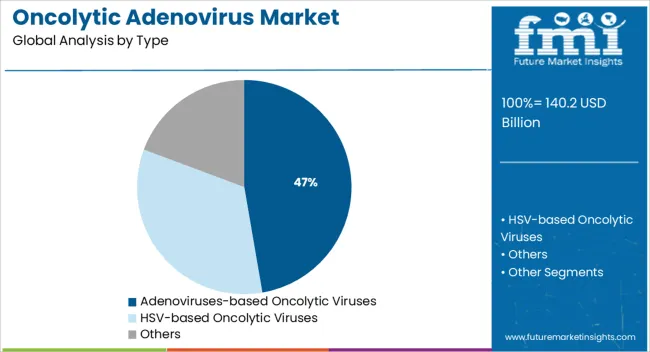
  • HSV-based Oncolytic Viruses
  • Adenoviruses-based Oncolytic Viruses
  • Others

Application:

  • Melanoma
  • Prostate Cancer
  • Breast Cancer
  • Ovarian Cancer
  • Lung Cancer
  • Others

Region:

  • North America
  • Latin America
  • Europe
  • South Asia
  • East Asia
  • Oceania
  • Middle East & Africa (MEA)

Frequently Asked Questions

At what rate did the Oncolytic adenovirus market flourish from 2017 to 2022?

From 2017 to 2022, the oncolytic adenovirus market grew at a CAGR of 4.9%

What will be the growth rate of the global Oncolytic adenovirus market during the forecast period?

The global oncolytic adenovirus market is expected to grow with a 7.5% CAGR from 2023 to 2033.

What will be the projected market size of the Oncolytic adenovirus market by 2033?

As of 2033, the oncolytic adenovirus market is expected to reach US$ 250 Billion

Which type of application is expected to dominate the global Oncolytic adenovirus market during 2033?

Lung cancer is expected to possess a 35% market share for oncolytic adenovirus in 2023.

How is the North America Oncolytic adenovirus market projected to grow in 2033?

North America is expected to possess a 43% market share for the oncolytic adenovirus market in 2023.

How is the Asia Pacific Oncolytic adenovirus market projected to grow in 2033?

Asia Pacific's oncolytic adenovirus market size is expected to possess a 39% market share in 2023.

Table of Content

1. Executive Summary | Oncolytic Adenovirus Market

    1.1. Global Market Outlook

    1.2. Demand-side Trends

    1.3. Supply-side Trends

    1.4. Technology Roadmap Analysis

    1.5. Analysis and Recommendations

2. Market Overview

    2.1. Market Coverage / Taxonomy

    2.2. Market Definition / Scope / Limitations

3. Market Background

    3.1. Market Dynamics

        3.1.1. Drivers

        3.1.2. Restraints

        3.1.3. Opportunity

        3.1.4. Trends

    3.2. Scenario Forecast

        3.2.1. Demand in Optimistic Scenario

        3.2.2. Demand in Likely Scenario

        3.2.3. Demand in Conservative Scenario

    3.3. Opportunity Map Analysis

    3.4. Investment Feasibility Matrix

    3.5. PESTLE and Porter’s Analysis

    3.6. Regulatory Landscape

        3.6.1. By Key Regions

        3.6.2. By Key Countries

    3.7. Regional Parent Market Outlook

4. Global Market Analysis 2018 to 2022 and Forecast, 2023 to 2033

    4.1. Historical Market Size Value (US$ Million) Analysis, 2018 to 2022

    4.2. Current and Future Market Size Value (US$ Million) Projections, 2023 to 2033

        4.2.1. Y-o-Y Growth Trend Analysis

        4.2.2. Absolute $ Opportunity Analysis

5. Global Market Analysis 2018 to 2022 and Forecast 2023 to 2033, By Types

    5.1. Introduction / Key Findings

    5.2. Historical Market Size Value (US$ Million) Analysis By Types, 2018 to 2022

    5.3. Current and Future Market Size Value (US$ Million) Analysis and Forecast By Types, 2023 to 2033

        5.3.1. HSV-based Oncolytic Viruses

        5.3.2. Adenoviruses-based Oncolytic Viruses

        5.3.3. Others

    5.4. Y-o-Y Growth Trend Analysis By Types, 2018 to 2022

    5.5. Absolute $ Opportunity Analysis By Types, 2023 to 2033

6. Global Market Analysis 2018 to 2022 and Forecast 2023 to 2033, By Applications

    6.1. Introduction / Key Findings

    6.2. Historical Market Size Value (US$ Million) Analysis By Applications, 2018 to 2022

    6.3. Current and Future Market Size Value (US$ Million) Analysis and Forecast By Applications, 2023 to 2033

        6.3.1. Melanoma

        6.3.2. Prostate Cancer

        6.3.3. Breast Cancer

        6.3.4. Ovarian Cancer

        6.3.5. Lung Cancer

        6.3.6. Others

    6.4. Y-o-Y Growth Trend Analysis By Applications, 2018 to 2022

    6.5. Absolute $ Opportunity Analysis By Applications, 2023 to 2033

7. Global Market Analysis 2018 to 2022 and Forecast 2023 to 2033, By Region

    7.1. Introduction

    7.2. Historical Market Size Value (US$ Million) Analysis By Region, 2018 to 2022

    7.3. Current Market Size Value (US$ Million) Analysis and Forecast By Region, 2023 to 2033

        7.3.1. North America

        7.3.2. Latin America

        7.3.3. Europe

        7.3.4. South Asia

        7.3.5. East Asia

        7.3.6. Oceania

        7.3.7. Middle East & Africa (MEA)

    7.4. Market Attractiveness Analysis By Region

8. North America Market Analysis 2018 to 2022 and Forecast 2023 to 2033, By Country

    8.1. Historical Market Size Value (US$ Million) Trend Analysis By Market Taxonomy, 2018 to 2022

    8.2. Market Size Value (US$ Million) Forecast By Market Taxonomy, 2023 to 2033

        8.2.1. By Country

            8.2.1.1. The US

            8.2.1.2. Canada

        8.2.2. By Types

        8.2.3. By Applications

    8.3. Market Attractiveness Analysis

        8.3.1. By Country

        8.3.2. By Types

        8.3.3. By Applications

    8.4. Key Takeaways

9. Latin America Market Analysis 2018 to 2022 and Forecast 2023 to 2033, By Country

    9.1. Historical Market Size Value (US$ Million) Trend Analysis By Market Taxonomy, 2018 to 2022

    9.2. Market Size Value (US$ Million) Forecast By Market Taxonomy, 2023 to 2033

        9.2.1. By Country

            9.2.1.1. Brazil

            9.2.1.2. Mexico

            9.2.1.3. Rest of Latin America

        9.2.2. By Types

        9.2.3. By Applications

    9.3. Market Attractiveness Analysis

        9.3.1. By Country

        9.3.2. By Types

        9.3.3. By Applications

    9.4. Key Takeaways

10. Europe Market Analysis 2018 to 2022 and Forecast 2023 to 2033, By Country

    10.1. Historical Market Size Value (US$ Million) Trend Analysis By Market Taxonomy, 2018 to 2022

    10.2. Market Size Value (US$ Million) Forecast By Market Taxonomy, 2023 to 2033

        10.2.1. By Country

            10.2.1.1. Germany

            10.2.1.2. The UK

            10.2.1.3. France

            10.2.1.4. Spain

            10.2.1.5. Italy

            10.2.1.6. Rest of Europe

        10.2.2. By Types

        10.2.3. By Applications

    10.3. Market Attractiveness Analysis

        10.3.1. By Country

        10.3.2. By Types

        10.3.3. By Applications

    10.4. Key Takeaways

11. South Asia Market Analysis 2018 to 2022 and Forecast 2023 to 2033, By Country

    11.1. Historical Market Size Value (US$ Million) Trend Analysis By Market Taxonomy, 2018 to 2022

    11.2. Market Size Value (US$ Million) Forecast By Market Taxonomy, 2023 to 2033

        11.2.1. By Country

            11.2.1.1. India

            11.2.1.2. Malaysia

            11.2.1.3. Singapore

            11.2.1.4. Thailand

            11.2.1.5. Rest of South Asia

        11.2.2. By Types

        11.2.3. By Applications

    11.3. Market Attractiveness Analysis

        11.3.1. By Country

        11.3.2. By Types

        11.3.3. By Applications

    11.4. Key Takeaways

12. East Asia Market Analysis 2018 to 2022 and Forecast 2023 to 2033, By Country

    12.1. Historical Market Size Value (US$ Million) Trend Analysis By Market Taxonomy, 2018 to 2022

    12.2. Market Size Value (US$ Million) Forecast By Market Taxonomy, 2023 to 2033

        12.2.1. By Country

            12.2.1.1. China

            12.2.1.2. Japan

            12.2.1.3. South Korea

        12.2.2. By Types

        12.2.3. By Applications

    12.3. Market Attractiveness Analysis

        12.3.1. By Country

        12.3.2. By Types

        12.3.3. By Applications

    12.4. Key Takeaways

13. Oceania Market Analysis 2018 to 2022 and Forecast 2023 to 2033, By Country

    13.1. Historical Market Size Value (US$ Million) Trend Analysis By Market Taxonomy, 2018 to 2022

    13.2. Market Size Value (US$ Million) Forecast By Market Taxonomy, 2023 to 2033

        13.2.1. By Country

            13.2.1.1. Australia

            13.2.1.2. New Zealand

        13.2.2. By Types

        13.2.3. By Applications

    13.3. Market Attractiveness Analysis

        13.3.1. By Country

        13.3.2. By Types

        13.3.3. By Applications

    13.4. Key Takeaways

14. MEA Market Analysis 2018 to 2022 and Forecast 2023 to 2033, By Country

    14.1. Historical Market Size Value (US$ Million) Trend Analysis By Market Taxonomy, 2018 to 2022

    14.2. Market Size Value (US$ Million) Forecast By Market Taxonomy, 2023 to 2033

        14.2.1. By Country

            14.2.1.1. GCC Countries

            14.2.1.2. South Africa

            14.2.1.3. Israel

            14.2.1.4. Rest of MEA

        14.2.2. By Types

        14.2.3. By Applications

    14.3. Market Attractiveness Analysis

        14.3.1. By Country

        14.3.2. By Types

        14.3.3. By Applications

    14.4. Key Takeaways

15. Key Countries Market Analysis

    15.1. The US

        15.1.1. Pricing Analysis

        15.1.2. Market Share Analysis, 2022

            15.1.2.1. By Types

            15.1.2.2. By Applications

    15.2. Canada

        15.2.1. Pricing Analysis

        15.2.2. Market Share Analysis, 2022

            15.2.2.1. By Types

            15.2.2.2. By Applications

    15.3. Brazil

        15.3.1. Pricing Analysis

        15.3.2. Market Share Analysis, 2022

            15.3.2.1. By Types

            15.3.2.2. By Applications

    15.4. Mexico

        15.4.1. Pricing Analysis

        15.4.2. Market Share Analysis, 2022

            15.4.2.1. By Types

            15.4.2.2. By Applications

    15.5. Germany

        15.5.1. Pricing Analysis

        15.5.2. Market Share Analysis, 2022

            15.5.2.1. By Types

            15.5.2.2. By Applications

    15.6. The UK

        15.6.1. Pricing Analysis

        15.6.2. Market Share Analysis, 2022

            15.6.2.1. By Types

            15.6.2.2. By Applications

    15.7. France

        15.7.1. Pricing Analysis

        15.7.2. Market Share Analysis, 2022

            15.7.2.1. By Types

            15.7.2.2. By Applications

    15.8. Spain

        15.8.1. Pricing Analysis

        15.8.2. Market Share Analysis, 2022

            15.8.2.1. By Types

            15.8.2.2. By Applications

    15.9. Italy

        15.9.1. Pricing Analysis

        15.9.2. Market Share Analysis, 2022

            15.9.2.1. By Types

            15.9.2.2. By Applications

    15.10. India

        15.10.1. Pricing Analysis

        15.10.2. Market Share Analysis, 2022

            15.10.2.1. By Types

            15.10.2.2. By Applications

    15.11. Malaysia

        15.11.1. Pricing Analysis

        15.11.2. Market Share Analysis, 2022

            15.11.2.1. By Types

            15.11.2.2. By Applications

    15.12. Singapore

        15.12.1. Pricing Analysis

        15.12.2. Market Share Analysis, 2022

            15.12.2.1. By Types

            15.12.2.2. By Applications

    15.13. Thailand

        15.13.1. Pricing Analysis

        15.13.2. Market Share Analysis, 2022

            15.13.2.1. By Types

            15.13.2.2. By Applications

    15.14. China

        15.14.1. Pricing Analysis

        15.14.2. Market Share Analysis, 2022

            15.14.2.1. By Types

            15.14.2.2. By Applications

    15.15. Japan

        15.15.1. Pricing Analysis

        15.15.2. Market Share Analysis, 2022

            15.15.2.1. By Types

            15.15.2.2. By Applications

    15.16. South Korea

        15.16.1. Pricing Analysis

        15.16.2. Market Share Analysis, 2022

            15.16.2.1. By Types

            15.16.2.2. By Applications

    15.17. Australia

        15.17.1. Pricing Analysis

        15.17.2. Market Share Analysis, 2022

            15.17.2.1. By Types

            15.17.2.2. By Applications

    15.18. New Zealand

        15.18.1. Pricing Analysis

        15.18.2. Market Share Analysis, 2022

            15.18.2.1. By Types

            15.18.2.2. By Applications

    15.19. GCC Countries

        15.19.1. Pricing Analysis

        15.19.2. Market Share Analysis, 2022

            15.19.2.1. By Types

            15.19.2.2. By Applications

    15.20. South Africa

        15.20.1. Pricing Analysis

        15.20.2. Market Share Analysis, 2022

            15.20.2.1. By Types

            15.20.2.2. By Applications

    15.21. Israel

        15.21.1. Pricing Analysis

        15.21.2. Market Share Analysis, 2022

            15.21.2.1. By Types

            15.21.2.2. By Applications

16. Market Structure Analysis

    16.1. Competition Dashboard

    16.2. Competition Benchmarking

    16.3. Market Share Analysis of Top Players

        16.3.1. By Regional

        16.3.2. By Types

        16.3.3. By Applications

17. Competition Analysis

    17.1. Competition Deep Dive

        17.1.1. Amgen

            17.1.1.1. Overview

            17.1.1.2. Product Portfolio

            17.1.1.3. Profitability by Market Segments

            17.1.1.4. Sales Footprint

            17.1.1.5. Strategy Overview

                17.1.1.5.1. Marketing Strategy

        17.1.2. Sorrento Therapeutics

            17.1.2.1. Overview

            17.1.2.2. Product Portfolio

            17.1.2.3. Profitability by Market Segments

            17.1.2.4. Sales Footprint

            17.1.2.5. Strategy Overview

                17.1.2.5.1. Marketing Strategy

        17.1.3. Transgene SA

            17.1.3.1. Overview

            17.1.3.2. Product Portfolio

            17.1.3.3. Profitability by Market Segments

            17.1.3.4. Sales Footprint

            17.1.3.5. Strategy Overview

                17.1.3.5.1. Marketing Strategy

        17.1.4. Oncolys BioPharma

            17.1.4.1. Overview

            17.1.4.2. Product Portfolio

            17.1.4.3. Profitability by Market Segments

            17.1.4.4. Sales Footprint

            17.1.4.5. Strategy Overview

                17.1.4.5.1. Marketing Strategy

        17.1.5. Targovax

            17.1.5.1. Overview

            17.1.5.2. Product Portfolio

            17.1.5.3. Profitability by Market Segments

            17.1.5.4. Sales Footprint

            17.1.5.5. Strategy Overview

                17.1.5.5.1. Marketing Strategy

        17.1.6. Lokon Pharma

            17.1.6.1. Overview

            17.1.6.2. Product Portfolio

            17.1.6.3. Profitability by Market Segments

            17.1.6.4. Sales Footprint

            17.1.6.5. Strategy Overview

                17.1.6.5.1. Marketing Strategy

        17.1.7. Vyriad

            17.1.7.1. Overview

            17.1.7.2. Product Portfolio

            17.1.7.3. Profitability by Market Segments

            17.1.7.4. Sales Footprint

            17.1.7.5. Strategy Overview

                17.1.7.5.1. Marketing Strategy

        17.1.8. TILT Biotherapeutics

            17.1.8.1. Overview

            17.1.8.2. Product Portfolio

            17.1.8.3. Profitability by Market Segments

            17.1.8.4. Sales Footprint

            17.1.8.5. Strategy Overview

                17.1.8.5.1. Marketing Strategy

        17.1.9. CG Oncology Inc.

            17.1.9.1. Overview

            17.1.9.2. Product Portfolio

            17.1.9.3. Profitability by Market Segments

            17.1.9.4. Sales Footprint

            17.1.9.5. Strategy Overview

                17.1.9.5.1. Marketing Strategy

        17.1.10. VCNBiosciences

            17.1.10.1. Overview

            17.1.10.2. Product Portfolio

            17.1.10.3. Profitability by Market Segments

            17.1.10.4. Sales Footprint

            17.1.10.5. Strategy Overview

                17.1.10.5.1. Marketing Strategy

        17.1.11. DNAtrix

            17.1.11.1. Overview

            17.1.11.2. Product Portfolio

            17.1.11.3. Profitability by Market Segments

            17.1.11.4. Sales Footprint

            17.1.11.5. Strategy Overview

                17.1.11.5.1. Marketing Strategy

        17.1.12. Replimune Group Inc.

            17.1.12.1. Overview

            17.1.12.2. Product Portfolio

            17.1.12.3. Profitability by Market Segments

            17.1.12.4. Sales Footprint

            17.1.12.5. Strategy Overview

                17.1.12.5.1. Marketing Strategy

18. Assumptions & Acronyms Used

19. Research Methodology

Don't pay for what you don't need

Customize your report by selecting specific countries or regions and save 30%!

List of Tables

Table 1: Global Market Value (US$ Million) Forecast by Region, 2018 to 2033

Table 2: Global Market Value (US$ Million) Forecast by Types, 2018 to 2033

Table 3: Global Market Value (US$ Million) Forecast by Applications, 2018 to 2033

Table 4: North America Market Value (US$ Million) Forecast by Country, 2018 to 2033

Table 5: North America Market Value (US$ Million) Forecast by Types, 2018 to 2033

Table 6: North America Market Value (US$ Million) Forecast by Applications, 2018 to 2033

Table 7: Latin America Market Value (US$ Million) Forecast by Country, 2018 to 2033

Table 8: Latin America Market Value (US$ Million) Forecast by Types, 2018 to 2033

Table 9: Latin America Market Value (US$ Million) Forecast by Applications, 2018 to 2033

Table 10: Europe Market Value (US$ Million) Forecast by Country, 2018 to 2033

Table 11: Europe Market Value (US$ Million) Forecast by Types, 2018 to 2033

Table 12: Europe Market Value (US$ Million) Forecast by Applications, 2018 to 2033

Table 13: South Asia Market Value (US$ Million) Forecast by Country, 2018 to 2033

Table 14: South Asia Market Value (US$ Million) Forecast by Types, 2018 to 2033

Table 15: South Asia Market Value (US$ Million) Forecast by Applications, 2018 to 2033

Table 16: East Asia Market Value (US$ Million) Forecast by Country, 2018 to 2033

Table 17: East Asia Market Value (US$ Million) Forecast by Types, 2018 to 2033

Table 18: East Asia Market Value (US$ Million) Forecast by Applications, 2018 to 2033

Table 19: Oceania Market Value (US$ Million) Forecast by Country, 2018 to 2033

Table 20: Oceania Market Value (US$ Million) Forecast by Types, 2018 to 2033

Table 21: Oceania Market Value (US$ Million) Forecast by Applications, 2018 to 2033

Table 22: MEA Market Value (US$ Million) Forecast by Country, 2018 to 2033

Table 23: MEA Market Value (US$ Million) Forecast by Types, 2018 to 2033

Table 24: MEA Market Value (US$ Million) Forecast by Applications, 2018 to 2033
Sabyasachi Ghosh
Sabyasachi Ghosh

Principal Consultant

Talk to Analyst

Find your sweet spots for generating winning opportunities in this market.

List of Charts

Figure 1: Global Market Value (US$ Million) by Types, 2023 to 2033

Figure 2: Global Market Value (US$ Million) by Applications, 2023 to 2033

Figure 3: Global Market Value (US$ Million) by Region, 2023 to 2033

Figure 4: Global Market Value (US$ Million) Analysis by Region, 2018 to 2033

Figure 5: Global Market Value Share (%) and BPS Analysis by Region, 2023 to 2033

Figure 6: Global Market Y-o-Y Growth (%) Projections by Region, 2023 to 2033

Figure 7: Global Market Value (US$ Million) Analysis by Types, 2018 to 2033

Figure 8: Global Market Value Share (%) and BPS Analysis by Types, 2023 to 2033

Figure 9: Global Market Y-o-Y Growth (%) Projections by Types, 2023 to 2033

Figure 10: Global Market Value (US$ Million) Analysis by Applications, 2018 to 2033

Figure 11: Global Market Value Share (%) and BPS Analysis by Applications, 2023 to 2033

Figure 12: Global Market Y-o-Y Growth (%) Projections by Applications, 2023 to 2033

Figure 13: Global Market Attractiveness by Types, 2023 to 2033

Figure 14: Global Market Attractiveness by Applications, 2023 to 2033

Figure 15: Global Market Attractiveness by Region, 2023 to 2033

Figure 16: North America Market Value (US$ Million) by Types, 2023 to 2033

Figure 17: North America Market Value (US$ Million) by Applications, 2023 to 2033

Figure 18: North America Market Value (US$ Million) by Country, 2023 to 2033

Figure 19: North America Market Value (US$ Million) Analysis by Country, 2018 to 2033

Figure 20: North America Market Value Share (%) and BPS Analysis by Country, 2023 to 2033

Figure 21: North America Market Y-o-Y Growth (%) Projections by Country, 2023 to 2033

Figure 22: North America Market Value (US$ Million) Analysis by Types, 2018 to 2033

Figure 23: North America Market Value Share (%) and BPS Analysis by Types, 2023 to 2033

Figure 24: North America Market Y-o-Y Growth (%) Projections by Types, 2023 to 2033

Figure 25: North America Market Value (US$ Million) Analysis by Applications, 2018 to 2033

Figure 26: North America Market Value Share (%) and BPS Analysis by Applications, 2023 to 2033

Figure 27: North America Market Y-o-Y Growth (%) Projections by Applications, 2023 to 2033

Figure 28: North America Market Attractiveness by Types, 2023 to 2033

Figure 29: North America Market Attractiveness by Applications, 2023 to 2033

Figure 30: North America Market Attractiveness by Country, 2023 to 2033

Figure 31: Latin America Market Value (US$ Million) by Types, 2023 to 2033

Figure 32: Latin America Market Value (US$ Million) by Applications, 2023 to 2033

Figure 33: Latin America Market Value (US$ Million) by Country, 2023 to 2033

Figure 34: Latin America Market Value (US$ Million) Analysis by Country, 2018 to 2033

Figure 35: Latin America Market Value Share (%) and BPS Analysis by Country, 2023 to 2033

Figure 36: Latin America Market Y-o-Y Growth (%) Projections by Country, 2023 to 2033

Figure 37: Latin America Market Value (US$ Million) Analysis by Types, 2018 to 2033

Figure 38: Latin America Market Value Share (%) and BPS Analysis by Types, 2023 to 2033

Figure 39: Latin America Market Y-o-Y Growth (%) Projections by Types, 2023 to 2033

Figure 40: Latin America Market Value (US$ Million) Analysis by Applications, 2018 to 2033

Figure 41: Latin America Market Value Share (%) and BPS Analysis by Applications, 2023 to 2033

Figure 42: Latin America Market Y-o-Y Growth (%) Projections by Applications, 2023 to 2033

Figure 43: Latin America Market Attractiveness by Types, 2023 to 2033

Figure 44: Latin America Market Attractiveness by Applications, 2023 to 2033

Figure 45: Latin America Market Attractiveness by Country, 2023 to 2033

Figure 46: Europe Market Value (US$ Million) by Types, 2023 to 2033

Figure 47: Europe Market Value (US$ Million) by Applications, 2023 to 2033

Figure 48: Europe Market Value (US$ Million) by Country, 2023 to 2033

Figure 49: Europe Market Value (US$ Million) Analysis by Country, 2018 to 2033

Figure 50: Europe Market Value Share (%) and BPS Analysis by Country, 2023 to 2033

Figure 51: Europe Market Y-o-Y Growth (%) Projections by Country, 2023 to 2033

Figure 52: Europe Market Value (US$ Million) Analysis by Types, 2018 to 2033

Figure 53: Europe Market Value Share (%) and BPS Analysis by Types, 2023 to 2033

Figure 54: Europe Market Y-o-Y Growth (%) Projections by Types, 2023 to 2033

Figure 55: Europe Market Value (US$ Million) Analysis by Applications, 2018 to 2033

Figure 56: Europe Market Value Share (%) and BPS Analysis by Applications, 2023 to 2033

Figure 57: Europe Market Y-o-Y Growth (%) Projections by Applications, 2023 to 2033

Figure 58: Europe Market Attractiveness by Types, 2023 to 2033

Figure 59: Europe Market Attractiveness by Applications, 2023 to 2033

Figure 60: Europe Market Attractiveness by Country, 2023 to 2033

Figure 61: South Asia Market Value (US$ Million) by Types, 2023 to 2033

Figure 62: South Asia Market Value (US$ Million) by Applications, 2023 to 2033

Figure 63: South Asia Market Value (US$ Million) by Country, 2023 to 2033

Figure 64: South Asia Market Value (US$ Million) Analysis by Country, 2018 to 2033

Figure 65: South Asia Market Value Share (%) and BPS Analysis by Country, 2023 to 2033

Figure 66: South Asia Market Y-o-Y Growth (%) Projections by Country, 2023 to 2033

Figure 67: South Asia Market Value (US$ Million) Analysis by Types, 2018 to 2033

Figure 68: South Asia Market Value Share (%) and BPS Analysis by Types, 2023 to 2033

Figure 69: South Asia Market Y-o-Y Growth (%) Projections by Types, 2023 to 2033

Figure 70: South Asia Market Value (US$ Million) Analysis by Applications, 2018 to 2033

Figure 71: South Asia Market Value Share (%) and BPS Analysis by Applications, 2023 to 2033

Figure 72: South Asia Market Y-o-Y Growth (%) Projections by Applications, 2023 to 2033

Figure 73: South Asia Market Attractiveness by Types, 2023 to 2033

Figure 74: South Asia Market Attractiveness by Applications, 2023 to 2033

Figure 75: South Asia Market Attractiveness by Country, 2023 to 2033

Figure 76: East Asia Market Value (US$ Million) by Types, 2023 to 2033

Figure 77: East Asia Market Value (US$ Million) by Applications, 2023 to 2033

Figure 78: East Asia Market Value (US$ Million) by Country, 2023 to 2033

Figure 79: East Asia Market Value (US$ Million) Analysis by Country, 2018 to 2033

Figure 80: East Asia Market Value Share (%) and BPS Analysis by Country, 2023 to 2033

Figure 81: East Asia Market Y-o-Y Growth (%) Projections by Country, 2023 to 2033

Figure 82: East Asia Market Value (US$ Million) Analysis by Types, 2018 to 2033

Figure 83: East Asia Market Value Share (%) and BPS Analysis by Types, 2023 to 2033

Figure 84: East Asia Market Y-o-Y Growth (%) Projections by Types, 2023 to 2033

Figure 85: East Asia Market Value (US$ Million) Analysis by Applications, 2018 to 2033

Figure 86: East Asia Market Value Share (%) and BPS Analysis by Applications, 2023 to 2033

Figure 87: East Asia Market Y-o-Y Growth (%) Projections by Applications, 2023 to 2033

Figure 88: East Asia Market Attractiveness by Types, 2023 to 2033

Figure 89: East Asia Market Attractiveness by Applications, 2023 to 2033

Figure 90: East Asia Market Attractiveness by Country, 2023 to 2033

Figure 91: Oceania Market Value (US$ Million) by Types, 2023 to 2033

Figure 92: Oceania Market Value (US$ Million) by Applications, 2023 to 2033

Figure 93: Oceania Market Value (US$ Million) by Country, 2023 to 2033

Figure 94: Oceania Market Value (US$ Million) Analysis by Country, 2018 to 2033

Figure 95: Oceania Market Value Share (%) and BPS Analysis by Country, 2023 to 2033

Figure 96: Oceania Market Y-o-Y Growth (%) Projections by Country, 2023 to 2033

Figure 97: Oceania Market Value (US$ Million) Analysis by Types, 2018 to 2033

Figure 98: Oceania Market Value Share (%) and BPS Analysis by Types, 2023 to 2033

Figure 99: Oceania Market Y-o-Y Growth (%) Projections by Types, 2023 to 2033

Figure 100: Oceania Market Value (US$ Million) Analysis by Applications, 2018 to 2033

Figure 101: Oceania Market Value Share (%) and BPS Analysis by Applications, 2023 to 2033

Figure 102: Oceania Market Y-o-Y Growth (%) Projections by Applications, 2023 to 2033

Figure 103: Oceania Market Attractiveness by Types, 2023 to 2033

Figure 104: Oceania Market Attractiveness by Applications, 2023 to 2033

Figure 105: Oceania Market Attractiveness by Country, 2023 to 2033

Figure 106: MEA Market Value (US$ Million) by Types, 2023 to 2033

Figure 107: MEA Market Value (US$ Million) by Applications, 2023 to 2033

Figure 108: MEA Market Value (US$ Million) by Country, 2023 to 2033

Figure 109: MEA Market Value (US$ Million) Analysis by Country, 2018 to 2033

Figure 110: MEA Market Value Share (%) and BPS Analysis by Country, 2023 to 2033

Figure 111: MEA Market Y-o-Y Growth (%) Projections by Country, 2023 to 2033

Figure 112: MEA Market Value (US$ Million) Analysis by Types, 2018 to 2033

Figure 113: MEA Market Value Share (%) and BPS Analysis by Types, 2023 to 2033

Figure 114: MEA Market Y-o-Y Growth (%) Projections by Types, 2023 to 2033

Figure 115: MEA Market Value (US$ Million) Analysis by Applications, 2018 to 2033

Figure 116: MEA Market Value Share (%) and BPS Analysis by Applications, 2023 to 2033

Figure 117: MEA Market Y-o-Y Growth (%) Projections by Applications, 2023 to 2033

Figure 118: MEA Market Attractiveness by Types, 2023 to 2033

Figure 119: MEA Market Attractiveness by Applications, 2023 to 2033

Figure 120: MEA Market Attractiveness by Country, 2023 to 2033

Recommendations

Healthcare

Continuous Peripheral Nerve Block Catheter Market

Published : September 2023

Healthcare

Central Venous Catheter Market

Published : September 2023

Healthcare

Stent Graft Balloon Catheter Market

Published : November 2022

Healthcare

AIDS Related Primary CNS Lymphoma Market

Published : November 2022

Explore Healthcare Insights

View Reports

Oncolytic Adenovirus Market