- Global Locations -
Headquarters
Future Market Insights, Inc.
Christiana Corporate, 200 Continental Drive, Suite 401, Newark, Delaware - 19713, United States
T: +1-845-579-5705
Americas
Future Market Insights, Inc.
616 Corporate Way, Suite 2-9018,
Valley Cottage, NY 10989,
United States
T: +1-347-918-3531
MEA
Future Market Insights

1602-6 Jumeirah Bay X2 Tower, Plot No: JLT-PH2-X2A,

Jumeirah Lakes Towers, Dubai,

United Arab Emirates

Europe
Future Market Insights
3rd Floor, 207 Regent Street,
London W1B 3HH
United Kingdom
T: + 44 (0) 20 8123 9659
D: +44 (0) 20 3287 4268
Asia Pacific
Future Market Insights Global & Consulting Pvt. Ltd.
Office No. 401-A, 4th Floor,
VANTAGE 9, S.No. 36/1/1,
Baner, Pune 411045 India

Orthokeratology Market

Orthokeratology Market by Indication, Distribution Channel & Region - Forecast 2022 - 2028

Market Insights on Orthokeratology covering sales outlook, demand forecast and up-to-date key trends

Request Sample

Orthokeratology Market Outlook (2022-2028)

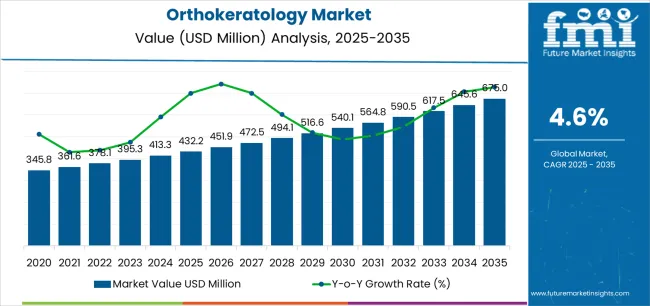
[194 Pages Report] The global orthokeratology market is estimated to reach US$ 58.1 Mn in 2022 and is further projected to be valued at US$ 88.7 Mn by 2028, rising at a CAGR of 7.3% from 2022 to 2028. Market growth of orthokeratology is primarily driven by the following key factors:

  • Progressions in implantable vision correction strategies, regulatory frameworks, reimbursement for corrective procedures, and product widespread adoption, following all macro and industry standards.
  • The rising prevalence of myopia, as well as chronic illnesses such as diabetic retinopathy.
  • Expanding online patient knowledge and awareness about Ortho-K, along with an increment in the success rate of orthokeratology lenses in recent decades.
  • Receiving adequate opportunity to live a healthy lifestyle.

COVID-19 has not been kind to anyone, physically, intellectually, or emotionally. The sight of loved ones dying as a result of the pandemic is a source of emotional anguish that people must bear. Lockdowns have resulted in work-from-home circumstances in the business world, and people's eyesight has been affected by varying early morning, afternoon, and night shifts.

Government organizations are working to improve the quality of drugs and facilities that will help those with low vision. Furthermore, orthokeratology lens providers are developing and launching solutions on a global scale to benefit the target audience and capitalize on future global growth.

Orthokeratology Market Size (2022)

US$ 58.1 Mn

Sales Forecast (2028)

US$ 88.7 Mn

Global Market Growth Rate (2022 to 2028)

7.3% CAGR

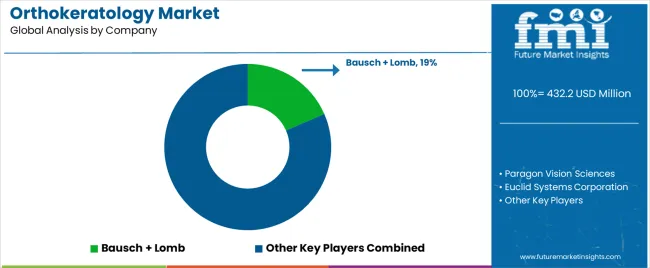
Share of Top 5 Orthokeratology Equipment Suppliers

55%

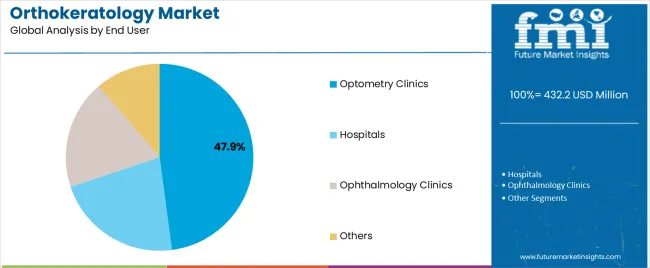
The orthokeratology market accounted for around 0.7% market share of the global contact lens market. Ortho-K in optometry clinics is projected to account for around 50% revenue share of the orthokeratology market across the assessment period of 2022 to 2028.

Don't pay for what you don't need

Customize your report by selecting specific countries or regions and save 30%!

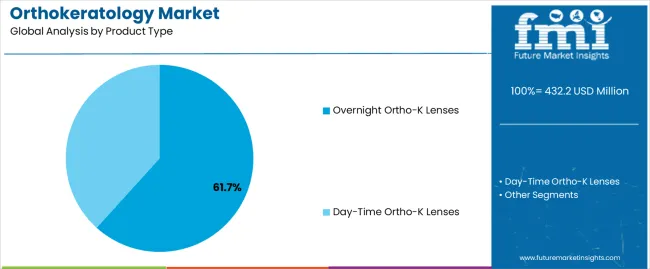
Ortho-k lens designs and technological advancements are garnering a growing customer base

Furthermore, the younger generation prefers a trendy appearance and wears different eyewear that varies based on the occasion. Consumers demand emerging designs and technological advances, requiring businesses to keep a steady focus on R&D to create cutting-edge products. The vast number of eye disease awareness programs in emerging regions is expected to boost demand for orthokeratology during the forthcoming years. Vision correction in children has resulted in improved educational outcomes, which has proved popular for overnight ortho-K-lens.

Orthokeratology Market

North America to be a Key Beneficiary of Market Growth

Because of the growing aging population and the requirement for diagnosis and treatment of Corneal Refractive Therapy (CRT) and Vision Shaping Treatment, the North American regional market is likely to compensate for 35% of the global market in 2022. (VST).

The clamor for orthokeratology in North America has grown in tandem with the rapid growth of the ophthalmology field in the United States and Canada. Furthermore, regional government organizations have brought considerable reimbursements for eye treatments, enhancing market growth. The inclusion of a reputable and highly geared sector in the United States motivates market growth. Furthermore, rising government initiatives to strengthen access to higher-quality treatment are driving orthokeratology value growth in North America. The involvement of major competitors in the United States, such as CooperVision, Johnson & Johnson Vision, and Bausch & Lomb Inc., is expected to boost regional growth.

Sabyasachi Ghosh
Sabyasachi Ghosh
Principal Consultant
LinkedIn
Talk to Analyst

Find your sweet spots for generating winning opportunities in this market.

Cost-effectiveness in Ophthalmic Clinics is increasing reliance on the Ophthalmology Clinics segment

Individuals prefer ophthalmic clinics because of their low patient costs. The rising number of patients experiencing vision loss is expected to increase the demand for ophthalmology clinics. The huge number of ophthalmologists in emerging countries is anticipated to boost demand for ophthalmic clinics, thereby preferring segment growth.

Furthermore, raising access to advanced ophthalmology-related advanced technology in ophthalmic clinics across several unutilized economies is likely to contribute to segment growth. Over the forecast period, vastly increased competition in ophthalmic clinics is predicted to boost demand for orthokeratology. Furthermore, diverse hospitals are establishing combined ophthalmic centers for a variety of refractive disorders, which is expected to stimulate segment growth.

How The Market Progressed Till June 2022?

Particulars

Details

H1, 2021

7.90%

H1, 2022 Projected

7.81%

H1, 2022 Outlook

6.11%

BPS Change - H1, 2022 (O) – H1, 2022 (P)

(-) 170 ↓

BPS Change – H1, 2022 (O) – H1, 2021

(-) 179 ↓

The comparative analysis and market growth rate of global orthokeratology market as studied by Future Market Insights, will show a negative BPS growth in H1-2022 outlook as compared to H1-2022 projected period by 170 BPS, and, a negative BPS growth is expected in H1-2022 over H1- 2021 duration with 179 Basis Point Share (BPS).

The global orthokeratology market is subject to advancements in implantable solutions for vision correction, regulatory guidelines, reimbursement for corrective procedures, and product adoption rate, as per all the macro and industry standards.

The market decline observed through the reduction in the BPS values is addressed by the prevalence of reported cases of corneal infection in paediatric patients, as well as high initial cost of the ortho-k lenses. Moreover, there is less penetration of the orthokeratology products around the globe due to the lack of skilled professionals with appropriate training to perform lens implants.

The key developments in the market include the development of implantable intraocular lenses, and the development of innovative ortho-k products to correct other refractive errors including myopia. The market is highly influenced by the growing prevalence of myopia, as well as the increase in the prevalence of chronic disease such as diabetic retinopathy.

Get the data you need at a Fraction of the cost

Personalize your report by choosing insights you need
and save 40%!

Orthokeratology Market Historical Analysis (2013-2021) Vs. Market Outlook (2022-2028)

The global orthokeratology market value increased at around 6.9% CAGR from 2013 to 2021.

Orthokeratology (Ortho-K), an emerging treatment option for myopia, presbyopia, hyperopia, and astigmatism, is a non-invasive process and works on the principle of corneal replacement. At present, there are two FDA approved Ortho-K therapies: Corneal Refractive Therapy (CRT) and Vision Shaping Treatment (VST).

Patients availing these treatments need to wear the Ortho-K lenses for 6 to 8 hours at night during their sleep, and this reshapes their cornea to facilitate clear vision during the daytime.

Orthokeratology has been considered to facilitate the elimination of contact lens-related vision problems, providing patients with the freedom to experience an active lifestyle. While this factor will continue to play a pivotal role in the growing adoption of Ortho-K lenses.

Increasing online efforts in patient education and awareness about Ortho-K, coupled with an intensifying rate of success of orthokeratology lenses in recent years, is expected to strengthen the prospects for the global orthokeratology market, over the coming years.

While increasing prevalence of myopia stands as a key factor impacting market growth, several advantages of orthokeratology lenses over conventional contact lenses have been recognized to be pushing the adoption of orthokeratology devices among sportspersons.

The orthokeratology market is projected to expand at a CAGR of around 7.3% from 2022 to 2028.

What Makes North America a Prominent Regional Market for Orthokeratology Solutions?

The North American regional market is projected to hold 35% share of the global market in 2022 because of the growing elderly population and the necessity for diagnosis and treatment of Corneal Refractive Therapy (CRT) and Vision Shaping Treatment (VST).

The need for orthokeratology in North America has been increasing as the ophthalmology field has grown rapidly in the United States and Canada. Moreover, government organizations in the region have offered significant reimbursements for eye treatments, boosting market growth.

Country-wise Analysis

Why is the U.S. Witnessing Positive Growth in the Orthokeratology Industry?

The presence of a well-established and highly developed healthcare sector in the United States fuels market expansion. Furthermore, rising government measures to increase access to improved quality treatment is another factor driving orthokeratology demand growth in the country.

The United States is expected to bring in a big revenue share in the worldwide orthokeratology market by 2028, attributed to the high occurrence of short-sightedness among the population.

How is the Orthokeratology Devices Market Faring in China?

The China orthokeratology market is estimated to rise at a high CAGR over the forecast period due to the prolonged usage of laptops, smartphones, and tablets, resulting in digital eye strain and chronic eye damage among children and the young population.

Rise in the number of people with refractive defects such as myopia and hyperopia is likely to boost orthokeratology industry expansion in China.

Access to high treatment centers, growing number of people with eye problems, and rising healthcare expenditure and infrastructure are major factors contributing to orthokeratology solution market growth in China.

Category-wise Insights

Which Indication is Poised to Gain Huge Popularity in Orthokeratology?

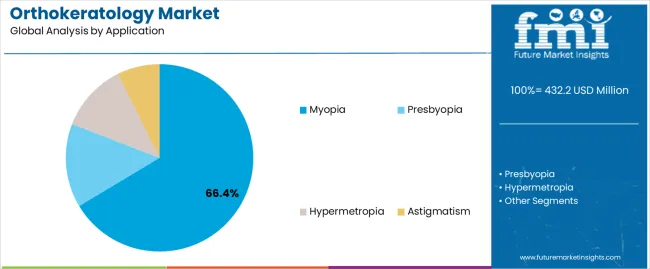
Myopia is expected to remain a key indication driving the demand for orthokeratology, worldwide. With the highest share of the total market value estimated for 2028, myopia will also provide extensive scope for innovation opportunities.

The recent Sydney Myopia Study found that 31% of 17-year-olds are myopic, which is double the prevalence reported earlier by the Blue Mountain Eye Study - more than a decade ago.

Orthokeratology is considered to be an ideal treatment alternative for young aged patients, as they are not eligible for laser surgery such as LASIK. Bolstering prevalence of myopia is thus a predominant factor expected to drive the growth of the orthokeratology market over the forecast period.

Moreover, several advantages of orthokeratology contact lenses over conventionally used contact lenses, especially for sportspersons will also be a key factor fueling the market growth.

A few limitations of LASIK surgery are also identified to be responsible for the robust growth of the orthokeratology market, over the projection period. Additionally, the increasing online campaign is expected to increase awareness among people about the use of orthokeratology lenses for the treatment of myopia, eventually pushing the demand for orthokeratology contact lenses up in the next few years.

Which Distribution Channel is Fueling Sales of Orthokeratology Equipment?

Among all the distribution channels, optometry clinics will reportedly continue to generate maximum demand for Ortho-K, accounting for a share of more than 50% of the total market value through 2028.

Ophthalmic clinics are expected to hold a decent revenue share throughout the assessment period, whereas hospitals are likely to emerge as the most opportunistic distribution channel.

Ocular errors, age-related maculopathy, blindness, diabetic retinopathy, and other eye illnesses can all be diagnosed with optometry. Optometrists are licensed and certified healthcare practitioners who can prescribe medicines and corrective lenses for poor eyesight or eyesight.

Improving understanding and acceptance about eye disease prevention, preventative care, and access to vision care will almost certainly improve the market growth.

The optometry clinics segment is supported by an increase in the number of patients who require complete eye examinations and medical care, as well as an increase in the frequency of eye disorders around the world.

Impact of COVID-19 on Orthokeratology Demand

Physically, intellectually, and emotionally, COVID-19 has not been kind to anyone. The sight of loved ones dying as a result of the pandemic is a source of emotional misery that individuals must live with. In the business world, lockdowns resulted in work-from-home scenarios, and people's eyesight has been affected by varied early morning, afternoon, and night shifts.

Government organizations are working to improve the quality of drugs and facilities that will aid in the treatment of those with poor vision. In addition, orthokeratology lens providers are building solutions and launching them on a global scale to benefit the target audience and take advantage of global expansion potential.

Orthokeratology device manufacturing companies are implementing automation to boost their production capacity, and, as such, the market is expected to grow over the coming years.

Competitive Landscape

As China and Japan have been identified to hold lucrative opportunities through the assessment period, orthokeratology equipment manufacturers leading the global market will reportedly focus on expansion on the Chinese and Japanese markets. Collaborations and acquisitions will remain important for a majority of key orthokeratology solution providers.

For instance,

  • In January 2019, Contamac introduced Optimum infinite high-oxygen gas permeable contact lenses with a strong mix of processability and elastic strength.
  • In March 2019, Alcon, Inc. purchased PowerVision, Inc., a medical equipment development firm based in the United States.  With this agreement, the company will be able to focus on developing a fluid-based corneal lens surgery. This will enhance the overall engagement of the company.

Orthokeratology Industry Report Scope

Attribute

Details

Forecast Period

2022-2028

Historical Data Available for

2013-2021

Market Analysis

Value in US$ Mn

Key Regions Covered

  • North America
  • Latin America
  • Europe
  • East Asia
  • South Asia & Pacific
  • Middle East & Africa (MEA)

Key Countries Covered

  • U.S.
  • Canada
  • Mexico
  • Brazil
  • Mexico
  • Argentina
  • Germany
  • Italy
  • France
  • U.K
  • Nordic
  • Spain
  • Japan
  • China
  • India
  • Malaysia
  • Thailand
  • Australia
  • GCC Countries
  • South Africa
  • Turkey

Key Market Segments Covered

  • Indication
  • Distribution Channel
  • Region

Key Companies Profiled

  • The Cooper Companies Inc.
  • Euclid Systems Corporation
  • Menicon Co., Ltd.
  • GP Specialists, Inc.
  • TruForm Optics, Inc.
  • Art Optical Contact Lens, Inc.
  • MiracLens L.L.C.
  • Contex, Inc.

Pricing

Available upon Request

Key Segments Covered in Orthokeratology Industry Survey

Orthokeratology Market by Indication:

  • Myopia
  • Presbyopia
  • Hyperopia
  • Astigmatism

Orthokeratology Market by Distribution Channel:

  • Hospitals
  • Optometry Clinics
  • Ophthalmology Clinics

Orthokeratology Market by Region:

  • North America Orthokeratology Market
  • Latin America Orthokeratology Market
  • Europe Orthokeratology Market
  • East Asia Orthokeratology Market
  • South Asia & Pacific Orthokeratology Market
  • Middle East & Africa (MEA) Orthokeratology Market

Frequently Asked Questions

The total worth of the market is expected to be US$ 88.7 million by 2028.

The projected growth rate of orthokeratology is 7.3% through 2028.

Myopia is a chief indication segment in the orthokeratology market.

North America accounts for a prominent market share.

China with a robust CAGR is likely to pull the market up.

Expansion, acquisition, and collaboration are the top differentiation strategies.

Considerable reimbursements for orthokeratology treatment may benefit the key players.

Table of Content

1. Executive Summary

    1.1. Market Overview

    1.2. Market Analysis

    1.3. FMI Analysis and Recommendations

    1.4. Wheel of Fortune

2. Market Introduction

    2.1. Market Taxonomy

    2.2. Market Definition

3. Global Economic Outlook

    3.1. Global Gross Domestic Product by Region & Country, 2016-2021

    3.2. Global Healthcare Market Outlook

4. Market Background

    4.1. Macro-economic Factors

    4.2. Opportunity Analysis

    4.3. Drivers

    4.4. Restraints

    4.5. Trends

5. Macroeconomic Assumptions

6. Forecast Factors – Relevance and Impact

7. North America Market Analysis 2013–2021 and Forecast 2022–2028

    7.1. Introduction/Key Findings

    7.2. Historical Market Size (US$ Mn) Analysis By Country, 2013-2021

       7.2.1. U.S.

       7.2.2. Canada

    7.3. Market Size (US$ Mn) Forecast By Country, 2022-2028

       7.3.1. U.S.

       7.3.2. Canada

    7.4. Historical Market Size (US$ Mn) Analysis By Indication, 2013-2021

       7.4.1. Myopia

       7.4.2. Presbyopia

       7.4.3. Hyperopia

       7.4.4. Astigmatism

    7.5. Market Size (US$ Mn) Forecast By Indication, 2022-2028

       7.5.1. Myopia

       7.5.2. Presbyopia

       7.5.3. Hyperopia

       7.5.4. Astigmatism

    7.6. Historical Market Size (US$ Mn) Analysis By Distribution Channel, 2013-2021

       7.6.1. Hospitals

       7.6.2. Optometry Clinics

       7.6.3. Ophthalmology Clinics

    7.7. Market Size (US$ Mn) Forecast By Distribution Channel, 2022-2028

       7.7.1. Hospitals

       7.7.2. Optometry Clinics

       7.7.3. Ophthalmology Clinics

    7.8. Market Attractiveness Analysis

       7.8.1. By Country

       7.8.2. By Indication

       7.8.3. By Distribution Channel

8. Western Europe Market Analysis 2013–2021 and Forecast 2022–2028

    8.1. Introduction/Key Findings

    8.2. Historical Market Size (US$ Mn) Analysis By Country, 2013-2021

       8.2.1. Germany

       8.2.2. Italy

       8.2.3. France

       8.2.4. United Kingdom

       8.2.5. Spain

       8.2.6. Rest of Western Europe

    8.3. Market Size (US$ Mn) Forecast By Country, 2022-2028

       8.3.1. Germany

       8.3.2. Italy

       8.3.3. France

       8.3.4. United Kingdom

       8.3.5. Spain

       8.3.6. Rest of Western Europe

    8.4. Historical Market Size (US$ Mn) Analysis By Indication, 2013-2021

       8.4.1. Myopia

       8.4.2. Presbyopia

       8.4.3. Hyperopia

       8.4.4. Astigmatism

    8.5. Market Size (US$ Mn) Forecast By Indication, 2022-2028

       8.5.1. Myopia

       8.5.2. Presbyopia

       8.5.3. Hyperopia

       8.5.4. Astigmatism

    8.6. Historical Market Size (US$ Mn) Analysis By Distribution Channel, 2013-2021

       8.6.1. Hospitals

       8.6.2. Optometry Clinics

       8.6.3. Ophthalmology Clinics

    8.7. Market Size (US$ Mn) Forecast By Distribution Channel, 2022-2028

       8.7.1. Hospitals

       8.7.2. Optometry Clinics

       8.7.3. Ophthalmology Clinics

    8.8. Market Attractiveness Analysis

       8.8.1. By Country

       8.8.2. By Indication

       8.8.3. By Distribution Channel

9. Eastern Europe Market Analysis 2013–2021 and Forecast 2022–2028

    9.1. Introduction/ Key Findings

    9.2. Historical Market Size (US$ Mn) Analysis By Country, 2013-2021

       9.2.1. Russia

       9.2.2. Poland

       9.2.3. Rest of Eastern Europe

    9.3. Market Size (US$ Mn) Forecast By Country, 2022-2028

       9.3.1. Russia

       9.3.2. Poland

       9.3.3. Rest of Eastern Europe

    9.4. Historical Market Size (US$ Mn) Analysis By Indication, 2013-2021

       9.4.1. Myopia

       9.4.2. Presbyopia

       9.4.3. Hyperopia

       9.4.4. Astigmatism

    9.5. Market Size (US$ Mn) Forecast By Indication, 2022-2028

       9.5.1. Myopia

       9.5.2. Presbyopia

       9.5.3. Hyperopia

       9.5.4. Astigmatism

    9.6. Historical Market Size (US$ Mn) Analysis By Distribution Channel, 2013-2021

       9.6.1. Hospitals

       9.6.2. Optometry Clinics

       9.6.3. Ophthalmology Clinics

    9.7. Market Size (US$ Mn) Forecast By Distribution Channel, 2022-2028

       9.7.1. Hospitals

       9.7.2. Optometry Clinics

       9.7.3. Ophthalmology Clinics

    9.8. Market Attractiveness Analysis

       9.8.1. By Country

       9.8.2. By Indication

       9.8.3. By Distribution Channel

10. Latin America Market Analysis 2013–2021 and Forecast 2022–2028

    10.1. Introduction/ Key Findings

    10.2. Historical Market Size (US$ Mn) Analysis By Country, 2013-2021

       10.2.1. Brazil

       10.2.2. Mexico

       10.2.3. Rest of Latin America

    10.3. Market Size (US$ Mn) Forecast By Country, 2022-2028

       10.3.1. Brazil

       10.3.2. Mexico

       10.3.3. Rest of Latin America

    10.4. Historical Market Size (US$ Mn) Analysis By Indication, 2013-2021

       10.4.1. Myopia

       10.4.2. Presbyopia

       10.4.3. Hyperopia

       10.4.4. Astigmatism

    10.5. Market Size (US$ Mn) Forecast By Indication, 2022-2028

       10.5.1. Myopia

       10.5.2. Presbyopia

       10.5.3. Hyperopia

       10.5.4. Astigmatism

    10.6. Historical Market Size (US$ Mn) Analysis By Distribution Channel, 2013-2021

       10.6.1. Hospitals

       10.6.2. Optometry Clinics

       10.6.3. Ophthalmology Clinics

    10.7. Market Size (US$ Mn) Forecast By Distribution Channel, 2022-2028

       10.7.1. Hospitals

       10.7.2. Optometry Clinics

       10.7.3. Ophthalmology Clinics

    10.8. Market Attractiveness Analysis

       10.8.1. By Country

       10.8.2. By Indication

       10.8.3. By Distribution Channel

11. APECJ Market Analysis 2013–2021 and Forecast 2022–2028

    11.1. Introduction/ Key Findings

    11.2. Historical Market Size (US$ Mn) Analysis By Country, 2013-2021

       11.2.1. India

       11.2.2. Australia and New Zealand

       11.2.3. ASEAN

       11.2.4. Rest of APECJ

    11.3. Market Size (US$ Mn) Forecast By Country, 2022-2028

       11.3.1. India

       11.3.2. Australia and New Zealand

       11.3.3. ASEAN

       11.3.4. Rest of APECJ

    11.4. Historical Market Size (US$ Mn) Analysis By Indication, 2013-2021

       11.4.1. Myopia

       11.4.2. Presbyopia

       11.4.3. Hyperopia

       11.4.4. Astigmatism

    11.5. Market Size (US$ Mn) Forecast By Indication, 2022-2028

       11.5.1. Myopia

       11.5.2. Presbyopia

       11.5.3. Hyperopia

       11.5.4. Astigmatism

    11.6. Historical Market Size (US$ Mn) Analysis By Distribution Channel, 2013-2021

       11.6.1. Hospitals

       11.6.2. Optometry Clinics

       11.6.3. Ophthalmology Clinics

    11.7. Market Size (US$ Mn) Forecast By Distribution Channel, 2022-2028

       11.7.1. Hospitals

       11.7.2. Optometry Clinics

       11.7.3. Ophthalmology Clinics

    11.8. Market Attractiveness Analysis

       11.8.1. By Country

       11.8.2. By Indication

       11.8.3. By Distribution Channel

12. China Market Analysis 2013–2021 and Forecast 2022–2028

    12.1. Introduction/ Key Findings

    12.2. Historical Market Size (US$ Mn) Analysis By Indication, 2013-2021

       12.2.1. Myopia

       12.2.2. Presbyopia

       12.2.3. Hyperopia

       12.2.4. Astigmatism

    12.3. Market Size (US$ Mn) Forecast By Indication, 2022-2028

       12.3.1. Myopia

       12.3.2. Presbyopia

       12.3.3. Hyperopia

       12.3.4. Astigmatism

    12.4. Historical Market Size (US$ Mn) Analysis By Distribution Channel, 2013-2021

       12.4.1. Hospitals

       12.4.2. Optometry Clinics

       12.4.3. Ophthalmology Clinics

    12.5. Market Size (US$ Mn) Forecast By Distribution Channel, 2022-2028

       12.5.1. Hospitals

       12.5.2. Optometry Clinics

       12.5.3. Ophthalmology Clinics

    12.6. Market Attractiveness Analysis

       12.6.1. By Country

       12.6.2. By Indication

       12.6.3. By Distribution Channel

13. Japan Market Analysis 2013–2021 and Forecast 2022–2028

    13.1. Introduction/ Key Findings

    13.2. Historical Market Size (US$ Mn) Analysis By Indication, 2013-2021

       13.2.1. Myopia

       13.2.2. Presbyopia

       13.2.3. Hyperopia

       13.2.4. Astigmatism

    13.3. Market Size (US$ Mn) Forecast By Indication, 2022-2028

       13.3.1. Myopia

       13.3.2. Presbyopia

       13.3.3. Hyperopia

       13.3.4. Astigmatism

    13.4. Historical Market Size (US$ Mn) Analysis By Distribution Channel, 2013-2021

       13.4.1. Hospitals

       13.4.2. Optometry Clinics

       13.4.3. Ophthalmology Clinics

    13.5. Market Size (US$ Mn) Forecast By Distribution Channel, 2022-2028

       13.5.1. Hospitals

       13.5.2. Optometry Clinics

       13.5.3. Ophthalmology Clinics

    13.6. Market Attractiveness Analysis

       13.6.1. By Country

       13.6.2. By Indication

       13.6.3. By Distribution Channel

14. Middle East and Africa Market Analysis 2013–2021 and Forecast 2022–2028

    14.1. Introduction/ Key Findings

    14.2. Historical Market Size (US$ Mn) Analysis By Country, 2013-2021

       14.2.1. GCC Countries

       14.2.2. South Africa

       14.2.3. Rest of Middle East and Africa

    14.3. Market Size (US$ Mn) Forecast By Country, 2022-2028

       14.3.1. GCC Countries

       14.3.2. South Africa

       14.3.3. Rest of Middle East and Africa

    14.4. Historical Market Size (US$ Mn) Analysis By Indication, 2013-2021

       14.4.1. Myopia

       14.4.2. Presbyopia

       14.4.3. Hyperopia

       14.4.4. Astigmatism

    14.5. Market Size (US$ Mn) Forecast By Indication, 2022-2028

       14.5.1. Myopia

       14.5.2. Presbyopia

       14.5.3. Hyperopia

       14.5.4. Astigmatism

    14.6. Historical Market Size (US$ Mn) Analysis By Distribution Channel, 2013-2021

       14.6.1. Hospitals

       14.6.2. Optometry Clinics

       14.6.3. Ophthalmology Clinics

    14.7. Market Size (US$ Mn) Forecast By Distribution Channel, 2022-2028

       14.7.1. Hospitals

       14.7.2. Optometry Clinics

       14.7.3. Ophthalmology Clinics

    14.8. Market Attractiveness Analysis

       14.8.1. By Country

       14.8.2. By Indication

       14.8.3. By Distribution Channel

15. Market Structure Analysis

    15.1. Market Structure by Tier

    15.2. Market Share Analysis (2021)

16. Competition Landscape

    16.1. Competition Dashboard

    16.2. Company Profiles (Details – Overview, Financials, Strategy, Recent Developments)

       16.2.1. The Cooper Companies Inc.

       16.2.2. Euclid Systems Corporation

       16.2.3. Menicon Co., Ltd.

       16.2.4. GP Specialists, Inc.

       16.2.5. TruForm Optics, Inc.

       16.2.6. Art Optical Contact Lens, Inc.

       16.2.7. MiracLens L.L.C.

       16.2.8. Contex, Inc.

17. Global Market Analysis 2013–2021 and Forecast 2022–2028 By Region

    17.1. Historical Market Size (US$ Mn) Analysis By Region

       17.1.1. North America

       17.1.2. Western Europe

       17.1.3. Eastern Europe

       17.1.4. Latin America

       17.1.5. APECJ

       17.1.6. China

       17.1.7. Japan

       17.1.8. Middle East and Africa

    17.2. Market Size (US$ Mn) Forecast By Region

       17.2.1. North America

       17.2.2. Western Europe

       17.2.3. Eastern Europe

       17.2.4. Latin America

       17.2.5. APECJ

       17.2.6. China

       17.2.7. Japan

       17.2.8. Middle East and Africa

    17.3. Market Attractiveness Analysis By Region

18. Global Market Analysis 2013–2021 and Forecast 2022–2028, By Indication

    18.1. Historical Market Size (US$ Mn) Analysis By Indication, 2013-2021

       18.1.1. Myopia

       18.1.2. Presbyopia

       18.1.3. Hyperopia

       18.1.4. Astigmatism

    18.2. Market Size (US$ Mn) Forecast By Indication, 2022-2028

       18.2.1. Myopia

       18.2.2. Presbyopia

       18.2.3. Hyperopia

       18.2.4. Astigmatism

    18.3. Market Attractiveness Analysis By Indication

19. Global Market Analysis 2013–2021 and Forecast 2022–2028, By Distribution Channel

    19.1. Historical Market Size (US$ Mn) Analysis By Distribution Channel, 2013-2021

       19.1.1. Hospitals

       19.1.2. Optometry Clinics

       19.1.3. Ophthalmology Clinics

    19.2. Market Size (US$ Mn) Forecast By Distribution Channel, 2022-2028

       19.2.1. Hospitals

       19.2.2. Optometry Clinics

       19.2.3. Ophthalmology Clinics

    19.3. Market Attractiveness Analysis By Distribution Channel

20. Global Market Analysis 2013–2021 and Forecast 2022–2028

    20.1. Market Size and Y-o-Y Growth

    20.2. Absolute $ Opportunity

21. Assumptions and Acronyms Used

22. Research Methodology

Don't pay for what you don't need

Customize your report by selecting specific countries or regions and save 30%!

List of Tables

Table 01: Expenditure on Health, (% of GDP), by Country, 2016 - 2021

Table 02: Expenditure on Health, (% of GDP), by Country, 2016 - 2021

Table 03: North America Market Value (US$ Mn) Analysis 2013-2021 and Forecast 2022–2028, By Country

Table 04: North America Market Value (US$ Mn) Analysis 2013-2021 and Forecast 2022–2028, By Indication

Table 05: North America Market Value (US$ Mn) Analysis 2013-2021 and Forecast 2022–2028, By Distribution Channel

Table 06: Latin America Market Value (US$ Mn) Analysis 2013-2021 and Forecast 2022–2028, By Country

Table 07: Latin America Market Value (US$ Mn) Analysis 2013-2021 and Forecast 2022–2028, By Indication

Table 08: Latin America Market Value (US$ Mn) Analysis 2013-2021 and Forecast 2022–2028, By Distribution Channel

Table 09: Western Europe Market Value (US$ Mn) Analysis 2013-2021 and Forecast 2022–2028, By Country

Table 10: Western Europe Market Value (US$ Mn) Analysis 2013-2021 and Forecast 2022–2028, By Indication

Table 11: Western Europe Market Value (US$ Mn) Analysis 2013-2021 and Forecast 2022–2028, By Distribution Channel

Table 12: Eastern Europe Market Value (US$ Mn) Analysis 2013-2021 and Forecast 2022–2028, By Country

Table 13: Eastern Europe Market Value (US$ Mn) Analysis 2013-2021 and Forecast 2022–2028, By Indication

Table 14: Eastern Europe Market Value (US$ Mn) Analysis 2013-2021 and Forecast 2022–2028, By Distribution Channel

Table 15: APECJ Market Value (US$ Mn) Analysis 2013-2021 and Forecast 2022–2028, By Country

Table 16: APECJ Market Value (US$ Mn) Analysis 2013-2021 and Forecast 2022–2028, By Indication

Table 17: APECJ Market Value (US$ Mn) Analysis 2013-2021 and Forecast 2022–2028, By Distribution Channel

Table 18: China Market Value (US$ Mn) Analysis 2013-2021 and Forecast 2022–2028, By Indication

Table 19: China Market Value (US$ Mn) Analysis 2013-2021 and Forecast 2022–2028, By Distribution Channel

Table 20: Japan Market Value (US$ Mn) Analysis 2013-2021 and Forecast 2022–2028, By Indication

Table 21: Japan Market Value (US$ Mn) Analysis 2013-2021 and Forecast 2022–2028, By Distribution Channel

Table 22: MEA Market Value (US$ Mn) Analysis 2013-2021 and Forecast 2022–2028, By Country

Table 23: MEA Market Value (US$ Mn) Analysis 2013-2021 and Forecast 2022–2028, By Indication

Table 24: MEA Market Value (US$ Mn) Analysis 2013-2021 and Forecast 2022–2028, By Distribution Channel

Table 25: Global Market Value (US$ Mn) Analysis- and Opportunity Assessment 2015–2027, By Region 

Table 26: Global Market Value (US$ Mn) Analysis 2013-2021 and Forecast 2022–2028, By Indication

Table 27: Global Market Value (US$ Mn) Analysis 2013-2021 and Forecast 2022–2028, By Distribution Channel
Sabyasachi Ghosh
Sabyasachi Ghosh
Principal Consultant
LinkedIn
Talk to Analyst

Find your sweet spots for generating winning opportunities in this market.

List of Charts

Figure 01: Global Healthcare Expenditure in US$ Tn (2013–2020)

Figure 02: Global Prevalence of Myopia (2010-2050)

Figure 03: North America Market Share Analysis (%), By Indication, 2022 & 2028

Figure 04: North America Market Share Analysis (%), By Distribution Channel, 2022 & 2028

Figure 05: North America Market Share Analysis (%), By Country, 2022 & 2028

Figure 06: North America Market Value Analysis (US$ Mn), 2013-2021

Figure 07: North America Market Value Forecast (US$ Mn), 2022-2028

Figure 08: U.S. Market Value Analysis (US$ Mn), 2013-2021

Figure 09: U.S. Market Value Forecast (US$ Mn), 2022-2028

Figure 10: Canada Market Value Analysis (US$ Mn), 2013-2021

Figure 11: Canada Market Value Forecast (US$ Mn), 2022-2028

Figure 12: North America Market Attractiveness Analysis by Indication, 2022-2028

Figure 13: North America Market Attractiveness Analysis by Distribution Channel, 2022-2028

Figure 14: North America Market Attractiveness Analysis by Country, 2022-2028

Figure 15: Latin America Market Share Analysis (%), By Indication, 2022 & 2028

Figure 16: Latin America Market Share Analysis (%), By Distribution Channel, 2022 & 2028

Figure 17: Latin America Market Share Analysis (%), By Country, 2022 & 2028

Figure 18: Latin America Market Value Analysis (US$ Mn), 2013-2021

Figure 19: Latin America Market Value Forecast (US$ Mn), 2022-2028

Figure 20: Brazil Market Value Analysis (US$ Mn), 2013-2021

Figure 21: Brazil Market Value Forecast (US$ Mn), 2022-2028

Figure 22: Mexico Market Value Analysis (US$ Mn), 2013-2021

Figure 23: Mexico Market Value Forecast (US$ Mn), 2022-2028

Figure 24: Rest of Latin America Market Value Analysis (US$ Mn), 2013-2021

Figure 25: Rest of Latin America Market Value Forecast (US$ Mn), 2022-2028

Figure 26: Latin America Market Attractiveness Analysis by Indication, 2022-2028

Figure 27: Latin America Market Attractiveness Analysis by Distribution Channel, 2022-2028

Figure 28: Latin America Market Attractiveness Analysis by Country, 2022-2028

Figure 29: Western Europe Market Share Analysis (%), By Indication, 2022 & 2028

Figure 30: Western Europe Market Share Analysis (%), By Distribution Channel, 2022 & 2028

Figure 31: Western Europe Market Share Analysis (%), By Country, 2022 & 2028

Figure 32: Western Europe Market Value Analysis (US$ Mn), 2013-2021

Figure 33: Western Europe Market Value Forecast (US$ Mn), 2022-2028

Figure 34: U.K.  Market Value Analysis (US$ Mn), 2013-2021

Figure 35: U.K. Market Value Forecast (US$ Mn), 2022-2028

Figure 36: Germany Market Value Analysis (US$ Mn), 2013-2021

Figure 37: Germany Market Value Forecast (US$ Mn), 2022-2028

Figure 38: France  Market Value Analysis (US$ Mn), 2013-2021

Figure 39: France Market Value Forecast (US$ Mn), 2022-2028

Figure 40: Italy Market Value Analysis (US$ Mn), 2013-2021

Figure 41: Italy Market Value Forecast (US$ Mn), 2022-2028

Figure 42: Spain Market Value Analysis (US$ Mn), 2013-2021

Figure 43: Spain Market Value Forecast (US$ Mn), 2022-2028

Figure 44: Rest of Western Europe Market Value Analysis (US$ Mn), 2013-2021

Figure 45: Rest of Western Europe Market Value Forecast (US$ Mn), 2022-2028

Figure 46: Western Europe Market Attractiveness Analysis by Indication, 2022-2028

Figure 47: Western Europe Market Attractiveness Analysis by Distribution Channel, 2022-2028

Figure 48: Western Europe Market Attractiveness Analysis by Country, 2022-2028

Figure 49: Eastern Europe Market Share Analysis (%), By Indication, 2022 & 2028

Figure 50: Eastern Europe Market Share Analysis (%), By Distribution Channel, 2022 & 2028

Figure 51: Eastern Europe Market Share Analysis (%), By Country, 2022 & 2028

Figure 52: Eastern Europe Market Value Analysis (US$ Mn), 2013-2021

Figure 53: Eastern Europe Market Value Forecast (US$ Mn), 2022-2028

Figure 54: Russia Market Value Analysis (US$ Mn), 2013-2021

Figure 55: Russia Market Value Forecast (US$ Mn), 2022-2028

Figure 56: Poland Market Value Analysis (US$ Mn), 2013-2021

Figure 57: Poland Market Value Forecast (US$ Mn), 2022-2028

Figure 58: Rest of Eastern Europe Market Value Analysis (US$ Mn), 2013-2021

Figure 59: Rest of Eastern Europe Market Forecast Analysis (US$ Mn), 2022-2028

Figure 60: Eastern Europe Market Attractiveness Analysis by Indication, 2022-2028

Figure 61: Eastern Europe Market Attractiveness Analysis by Distribution Channel, 2022-2028

Figure 62: Eastern Europe Market Attractiveness Analysis by Country, 2022-2028

Figure 63: APECJ Market Share Analysis (%), By Indication, 2022 & 2028

Figure 64: APECJ Market Share Analysis (%), By Distribution Channel, 2022 & 2028

Figure 65: APECJ Market Share Analysis (%), By Country, 2022 & 2028

Figure 66: APECJ Market Value Analysis (US$ Mn), 2013-2021

Figure 67: APECJ Market Value Forecast (US$ Mn), 2022-2028

Figure 68: India Market Value Analysis (US$ Mn), 2013-2021

Figure 69: India Market Value Forecast (US$ Mn), 2022-2028

Figure 70: Australia & NZ Market Value Analysis (US$ Mn), 2013-2021

Figure 71: Australia & NZ Market Value Forecast (US$ Mn), 2022-2028

Figure 72: ASEAN Market Value Analysis (US$ Mn), 2013-2021

Figure 73: ASEAN Market Value Forecast (US$ Mn), 2022-2028

Figure 74: Rest of APECJ Market Value Analysis (US$ Mn), 2013-2021

Figure 75: Rest of APECJ Market Value Forecast (US$ Mn), 2022-2028

Figure 76: APECJ Market Attractiveness Analysis by Indication, 2022-2028

Figure 77: APECJ Market Attractiveness Analysis by Distribution Channel, 2022-2028

Figure 78: APECJ Market Attractiveness Analysis by Country, 2022-2028

Figure 79: China Market Share Analysis (%), By Indication, 2022 & 2028

Figure 80: China Market Share Analysis (%), By Distribution Channel, 2022 & 2028

Figure 81: China Market Value Analysis (US$ Mn), 2013-2021

Figure 82: China Market Value Forecast (US$ Mn), 2022-2028

Figure 83: China Market Attractiveness Analysis by Indication, 2022-2028

Figure 84: China Market Attractiveness Analysis by Distribution Channel, 2022-2028

Figure 85: Japan Market Share Analysis (%), By Indication, 2022 & 2028

Figure 86: Japan Market Share Analysis (%), By Distribution Channel, 2022 & 2028

Figure 87: Japan Market Value Analysis (US$ Mn), 2013-2021

Figure 88: Japan Market Value Forecast (US$ Mn), 2022-2028

Figure 89: Japan Market Attractiveness Analysis by Indication, 2022-2028

Figure 90: Japan Market Attractiveness Analysis by Distribution Channel, 2022-2028

Figure 91: MEA Market Share Analysis (%), By Indication, 2022 & 2028

Figure 92: MEA Market Share Analysis (%), By Distribution Channel, 2022 & 2028

Figure 93: MEA Market Share Analysis (%), By Country, 2022 & 2028

Figure 94: MEA Market Value Analysis (US$ Mn), 2013-2021

Figure 95: MEA Market Value Forecast (US$ Mn), 2022-2028

Figure 96: South Africa Market Value Analysis (US$ Mn), 2013-2021

Figure 97: South Africa Market Value Forecast (US$ Mn), 2022-2028

Figure 98: GCC Countries Market Value Analysis (US$ Mn), 2013-2021

Figure 99: GCC Countries Market Value Forecast (US$ Mn), 2022-2028

Figure 100: Rest of MEA Market Value Analysis (US$ Mn), 2013-2021

Figure 101: Rest of MEA Market Value Forecast (US$ Mn), 2022-2028

Figure 102: MEA Market Attractiveness Analysis by Indication, 2022-2028

Figure 103: MEA Market Attractiveness Analysis by Distribution Channel, 2022-2028

Figure 104: MEA Market Attractiveness Analysis by Country, 2022-2028

Figure 105: Global Market: Company Share Analysis (2021)

Figure 106: Global Market Share Analysis (%), By Region, 2022 & 2028

Figure 107: Global Market Y-o-Y Analysis (%), By Region, 2022-2028

Figure 108: Global Market Attractiveness Analysis by Region, 2022-2028

Figure 109: Global Market Share Analysis (%), By Indication, 2022 & 2028

Figure 110: Global Market Y-o-Y Analysis (%), By Indication, 2022-2028

Figure 111: Global Market Value Analysis (US$ Mn), by Myopia, 2013-2021

Figure 112: Global Market Value Analysis (US$ Mn), by Myopia, 2022-2028

Figure 113: Global  Market Value Analysis (US$ Mn), by Presbyopia, 2013-2021

Figure 114: Global Market Value Analysis (US$ Mn), by Presbyopia, 2022-2028

Figure 115: Global Market Value Analysis (US$ Mn), by Hyperopia, 2013-2021

Figure 116: Global Market Value Analysis (US$ Mn),by Hyperopia 2022-2028

Figure 117: Global Market Value Analysis (US$ Mn), by Astigmatism, 2013-2021

Figure 118: Global Market Value Analysis (US$ Mn), by Astigmatism, 2022-2028

Figure 119: Global Market Attractiveness Analysis by Indication , 2022-2028

Figure 120: Global Market Share Analysis (%), By Distribution Channel, 2022 & 2028

Figure 121: Global Market Y-o-Y Analysis (%), By Distribution Channel, 2022-2028

Figure 122: Global Market Value Analysis (US$ Mn, by Hospitals, 2013-2021

Figure 123: Global Market Value Analysis (US$ Mn), by Hospitals, 2022-2028

Figure 124: Global Market Value Analysis (US$ Mn), by Optometry Clinics, 2013-2021

Figure 125: Global Market Value Analysis (US$ Mn), by Optometry Clinics, 2022-2028

Figure 126: Global Market Value Analysis (US$ Mn), by Ophthalmic Clinics, 2013-2021

Figure 127: Global Market Value Analysis (US$ Mn), by  Ophthalmic Clinics, 2022-2028

Figure 128: Global Market Attractiveness Analysis by Distribution Channel , 2022-2028

Figure 129: Global Market Value Analysis (US$ Mn), 2013-2021

Figure 130: Global Market Value Forecast (US$ Mn), 2022-2028

Figure 131: Global Market Absolute $ Opportunity, 2022 - 2028

Recommendations

Healthcare

Eye Infections Treatment Market

Published : July 2022

Technology

Eye Tracking System Market

Published : July 2022

Healthcare

Ophthalmic Diagnostic Equipment Market

Published : June 2022

Healthcare

Ophthalmic Lasers Market

Published : June 2022

Explore Healthcare Insights

View Reports

Orthokeratology Market

We value your privacy

We use cookies to enhance your browsing experience, serve personalized ads or content, and analyze our traffic.

By clicking "Accept All", you consent to our use of cookies. Cookie Policy