Ozempic Market Size, Share, and Forecast Outlook 2025 to 2035

The ozempic market reached a valuation of USD 22.3 billion in 2025 and is expected to grow to USD 58.4 billion by 2035, with a projected CAGR of 10.1%. Growth has been steered by broader acceptance of semaglutide for type 2 diabetes and weight-related indications, including widespread off-label prescribing patterns.
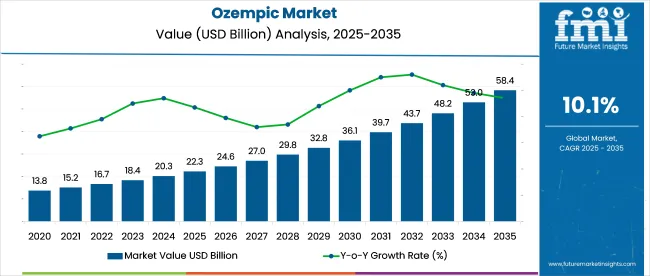
Quick Stats for Ozempic Market

  • Market Size (2025): USD 22.3 billion
  • Projected Size (2035): USD 58.4 billion
  • Forecast CAGR(2025 to 2035): 10.1%
  • Leading Segment: Type 2 Diabetes Mellitus (57%)
  • Key Growth Regions: South Asia (India with 14.8% CAGR)
  • Top Key Players: Novo Nordisk, Eli Lilly, Sanofi, AstraZeneca, Jiangsu Hansoh, Biocon, Dr. Reddy’s, Cipla

Ozempic Market

Demand has been reinforced by payer shifts, expanding telehealth-based prescriptions, and elevated interest in GLP1 receptor agonists as a non-invasive alternative to bariatric procedures. Competitive activity within the ozempic market has been shaped by aggressive pricing, patient adherence programs, and strategic partnerships aimed at scaling production and ensuring uninterrupted supply across priority channels.

"Obesity is a serious, chronic disease, and access to obesity medications should be treated with the same urgency as other chronic conditions,"said Rhonda Pacheco, Group Vice President of USACardiometabolic Health at Eli Lilly. "Lilly was the first company to offer a self-pay solution for an FDA-approved obesity medication, and we continue to work to expand coverage for Zepbound. In the meantime, the availability of the two highest-dose Zepbound vials gives providers and patients another important treatment option."(Source: Eli Lilly & Co., June 2025)

Ozempic captures close to 60% of the GLP-1 receptor agonist category, underscoring its lead among semaglutide-based therapies. Within the type 2 diabetes drug sector, valued at around USD 88 billion, its contribution is estimated at 20-25% based on treatment volumes and sales. In the weight management therapeutics domain, including obesity drugs, Ozempic and its related formulations represent about 65% of the segment’s total value.

When both anti-obesity and anti-diabetic therapies are considered together, the total is roughly USD 200 billion. Ozempic commands a 10-15% slice. Compared to the broader prescription drug industry, projected at over USD 1.5 trillion, Ozempic’s anticipated 2025 sales of USD 22 billion translate to just over 1.5%, reflecting its high revenue yield in targeted treatment classes.

Analyzing Ozempic Market by Top Investment Segments

The market has been segmented by indication, dosage strength, distribution channel, patient type, and region. The indication segment comprises type 2 diabetes mellitus. Dosage strength is divided into 0.25 mg, 0.5 mg, 1 mg, and 2 mg/3 mL (0.68 mg/mL).

Distribution channels include hospital pharmacies, retail pharmacies, and online platforms. The patient type segmentation covers insured patients and uninsured patients. The regional breakdown includes North America, Europe, Asia Pacific, Latin America, and the Middle East & Africa.
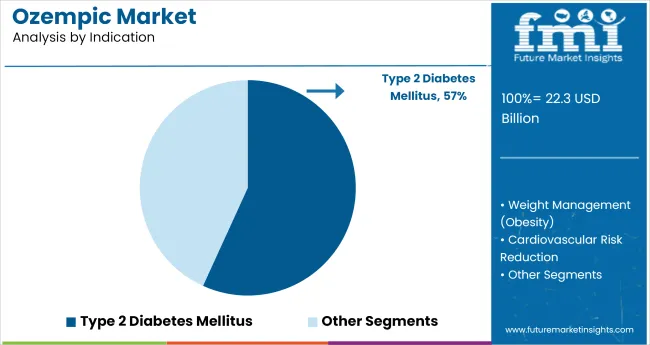
Type 2 Diabetes Remains the Leading Indication

Ozempic Market Analysis By Indication

In 2025, 57% of ozempic prescriptions were written for type 2 diabetes mellitus, reflecting widespread alignment with updated global guidelines. The American Diabetes Association included GLP-1 receptor agonists as preferred therapy for patients with cardiovascular risk, increasing ozempic’s usage in USA clinics such as Cleveland Clinic and Mayo.

The NHS in the UK incorporated semaglutide for overweight diabetic adults, driving national procurement. In India, hospital chains like Max and Fortis adopted ozempic within cardiometabolic protocols. Clinical preference stemmed from consistent weight reduction, blood glucose control, and cardiovascular safety data, with endocrinologists and internists both contributing to steady prescription volume.

  • NHS endorsed semaglutide for diabetic patients with obesity
  • Fortis India integrated semaglutide in its diabetes treatment bundles
  • ADA recommendations boosted usage across USA outpatient networks

Retail Pharmacies Maintain Dominance in Dispensing

Retail pharmacies accounted for 50.1% of ozempic dispensation in 2025, driven by insured prescription processing and direct patient access. USA chains like Walgreens and Rite Aid handled high weekly volumes, aided by pharmacy benefit manager integrations. In Japan, Welcia and Matsumoto Kiyoshi pharmacies maintained semaglutide availability under national health insurance systems.

Brazilian chains such as Drogasil expanded stock across São Paulo and Rio to serve urban diabetic populations. These pharmacies played a key role in refill adherence, with pharmacists offering injection guidance. High-frequency demand created strong inventory turnover across global retail channels equipped with cold storage facilities.
  • Welcia Japan supported semaglutide distribution under public insurance
  • Walgreens USA reported semaglutide among top-selling diabetes injectables
  • Drogasil Brazil stocked semaglutide across metro-area retail outlets

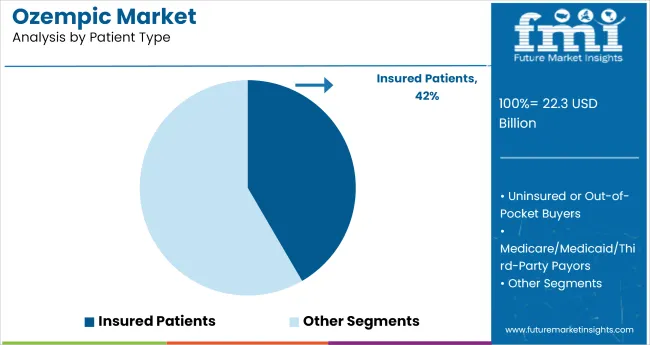
Insured Patients Accounted for 42% of Prescriptions

Ozempic Market Analysis By Patient Type

Insured patients represented 42% of ozempic volume in 2025, driven by broad access under national and private reimbursement schemes. USA coverage through Medicare and insurers like Aetna and Blue Cross supported higher uptake, especially for patients with comorbid cardiovascular risks. Germany’s public insurance bodies fully reimbursed semaglutide in cases meeting metabolic syndrome criteria.

In Japan, prescriptions were facilitated by favorable co-payment structures under the universal health plan. Hospitals such as Charité in Berlin and St. Luke’s in Tokyo reported increased ozempic initiations for eligible insured patients. Refill compliance remained higher among this segment due to minimal out-of-pocket expenses.

  • Covered in the USA by Medicare and major private insurers
  • Fully reimbursed in Germany for patients with CV risk profiles
  • Japan’s universal insurance supported semaglutide access for seniors

Top Ozempic Market Dynamics

The market is being shaped by increasing off-label use in obesity and cardiometabolic care, alongside persistent supply challenges. While once-weekly GLP-1 therapies gain clinical favor, manufacturing and regulatory bottlenecks continue to restrict rollout, especially in cost-sensitive and emerging regions.

Broadening Use in Obesity and Cardio-Metabolic Treatment

Ozempic is no longer confined to type 2 diabetes care, as physicians increasingly prescribe it for obesity and cardiovascular risk reduction. Clinical guidelines now support early GLP-1 initiation in at-risk patients, expanding access through insurance plans and digital prescribing channels.

The drug’s once-weekly dosing schedule has improved adherence in both chronic and preventive care settings. As telehealth usage rises and weight-loss protocols integrate GLP-1s, off-label adoption has grown rapidly, reshaping demand across the USA, UK, and select European regions.

  • Guidelines support first-line GLP-1 therapy for at-risk patients
  • Obesity-related off-label use has surged post to 2022
  • USA telehealth prescriptions rose 3.4× between 2021 to 2024

Production Strains and Global Access Challenges

Persistent manufacturing constraints have challenged ozempic’s global scale-up. Semaglutide API shortages, coupled with limited injector fill-finish capacity, have led to delayed approvals and fragmented regional supply. Dependency on a few contract manufacturing sites has heightened risk exposure, particularly in emerging markets.

Retail shortages in Europe have been worsened by parallel export channels, while regulatory hurdles continue to delay rollout in Latin America and Southeast Asia. These issues have limited inventory flexibility and weakened market responsiveness during demand surges.
  • Semaglutide API constraints impacted multiple markets in 2023
  • CMO fill-finish utilization exceeded 90% in 2024
  • Rollout in Asia-Pacific and Latin America delayed by approval backlogs and pricing limits

Top Countries Prescribing, Accessing, and Scaling Ozempic Usage

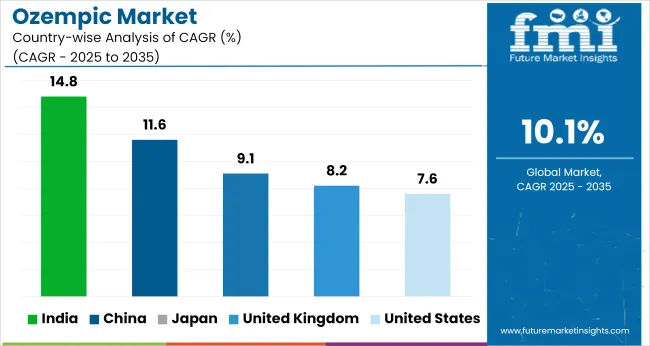
Ozempic Market Cagr Analysis By Country

Countries CAGR (2025 to 2035)
United States 7.6%
United Kingdom 8.2%
India 14.8%
China 11.6%
Japan 9.1%

The ozempic market is projected to grow at a 10.1% CAGR from 2025 to 2035. Growth varies across BRICS, OECD, and ASEAN economies, with BRICS countries showing the strongest momentum. India leads at 14.8%, outpacing the global average by 47%, followed by China at 11.6%.

Both nations benefit from fast-expanding diabetic and obesity-related pharmaceutical demand, paired with improved insurance inclusion and local production incentives. Japan (9.1%) and the United Kingdom (8.2%) reflect moderate growth among OECD peers. The United States, also in the OECD group, lags at 7.6% due to coverage limits and supply challenges.

The report covers detailed analysis of 40+ countries and the top five countries have been shared as a reference.

Demand Outlook for Ozempic in the United States

The ozempic market in the United States is forecast to grow at a CAGR of 7.6% between 2025 and 2035. Adoption has broadened beyond diabetes care following ADA endorsements for GLP-1 use in cardiometabolic management.

Telehealth-driven access has surged, particularly across mid-sized cities, while payer resistance has emerged through step therapy and audit protocols. Mail-order services have expanded prescription volumes due to refill incentives. Payer heterogeneity continues to shape co-pay variability and coverage exclusions, limiting nationwide uniformity in therapy access.

  • Telehealth-based ozempic prescriptions increased 3.4× between 2021 and 2024
  • Step therapy requirements adopted by over 60 insurers as of 2025
  • Mail-order platforms captured 18% of total prescriptions by end to 2024

Sales Analysis of Ozempic in the United Kingdom

A projected CAGR of 8.2% is estimated for ozempic sales in the United Kingdom from 2025 to 2035. Demand has grown under NICE’s 2023 obesity guidance, with regional disparities emerging due to NHS capacity limits. Scotland and Northern Ireland have outpaced England in per capita dispensing.

Reliance on private clinics and online D2C services has intensified, especially where public-sector availability is capped. Nurse prescribers in virtual clinics have increased initiation of GLP-1 therapy, signaling a shift in prescribing responsibility within weight management frameworks.

  • Scottish NHS dispensed ozempic at 1.6× the rate of England in 2024
  • Private e-health providers increased ozempic sales by 240% over 2022 to 2024
  • GLP-1s made up 37% of new anti-obesity prescriptions in 2024

In-depth Analysis of Ozempic Market in India

Demand ozempic market in India is expanding at a CAGR of 14.8% from 2025 to 2035. Cardiometabolic clinic growth and CME-backed GLP-1 promotion have accelerated prescriber interest. Beyond metros, tier-2 cities have seen uptake through diagnostic networks tied to multispecialty hospitals.

High out-of-pocket costs have led to modified usage, including alternate-week dosing in semi-urban belts. Draft proposals under NPPA may soon impose pricing ceilings. Pre-diabetes screening programs in corporate health camps have also increased new-user conversion rates across private health networks.

  • 38% of screened pre-diabetics were converted to GLP-1 regimens in 2024
  • Alternate-week dosing reported in 22% of semi-urban users
  • NPPA published draft price control policy for GLP-1s in mid to 2025

Opportunity Analysis of Ozempic in China

Ozempic usage in China is expected to grow at 11.6% CAGR from 2025 to 2035. National metabolic programs have integrated semaglutide into dual-management pathways for obesity and hypertension. City-level e-prescription platforms now support refill and post-discharge continuation through pharmacy chains.

Regional pilot schemes have used semaglutide for CV-metabolic overlap, covering tens of thousands of patients. Conditional hospital access has been granted to several domestic biosimilars, with formulary reviews underway in key provinces for broader inclusion.

  • JD Health enabled ozempic e-dispensing in 14 tier-1 cities by 2024
  • Hypertension-obesity pilot programs enrolled over 28000 patients
  • Guangdong and Jiangsu granted conditional access to local biosimilars in 2025

Demand Analysis for Ozempic in Japan

Sale of ozempic in Japan is growing at a 9.1% CAGR through 2035. Prescriptions remain concentrated in institutional settings following 2023 MHLW inclusion of GLP-1s for cardiovascular secondary prevention. Adoption by outpatient clinics has lagged, hindered by limited staffing for injectable patient training.

Consumer education has shifted toward digital platforms, with health forums and influencers driving awareness in the absence of commercial promoting. Uptake has been strongest among working males aged 40-60 in metropolitan regions.

  • Institutional prescriptions accounted for 84% of ozempic use in 2024
  • Clinic-based prescribing trailed by over a year post-MHLW approval
  • Online engagement with GLP-1 topics rose 5.7× from 2022 to 2024

Competitive Landscape in the Ozempic Market

Leading Company - Novo Nordisk Industry Share - 58%
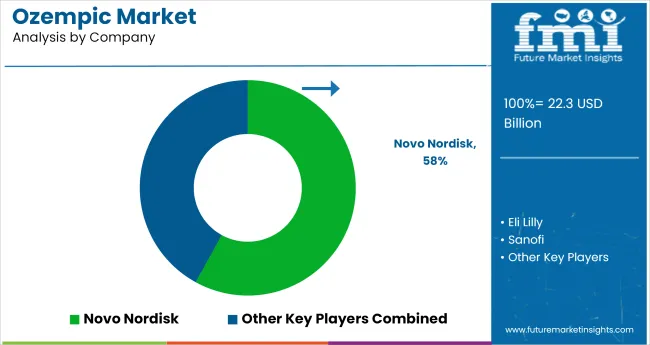
Ozempic Market Analysis By Company

The ozempic market is anchored by Novo Nordisk, which developed and commercialized Ozempic and Wegovy. The company has scaled both formulation and delivery innovations, enabling global access while reinforcing physician loyalty through clinical trial data and patient adherence programs.

Eli Lilly, though a late entrant, has aggressively gained share via tirzepatide (Mounjaro, Zepbound), which demonstrated superior weight-loss outcomes in head-to-head trials. Its weekly injectables are reshaping prescribing behavior, especially in the USA

Sanofi, previously dormant in GLP1s, is investing in new analogues and platform licensing, seeking reentry through differentiated delivery formats. AstraZeneca is building an early-stage pipeline, banking on GLP1 combination therapies. In China, Jiangsu Hansoh is enabling localized semaglutide supply, securing regulatory clearance faster than foreign entrants.

Biocon, Dr. Reddy’s, and Cipla are progressing toward biosimilar filings, focusing on price-sensitive markets where reimbursement limits access to branded semaglutide. This evolving landscape combines originator dominance with strategic biosimilar disruption.

Recent Industry News

  • In July 2025, Novo Nordisk partnered with WeightWatchers to offer Wegovy prescriptions through WW’s clinic model using NovoCare Pharmacy. As part of a direct-to-consumer launch, the company introduced a USD 299 cash-pay program valid through July 31, 2025. This move aims to reclaim patients lost to compounded alternatives and streamline access via integrated care platforms (Pharmacy Times, 2025).
  • In June 2025, Eli Lilly announced that its highest approved doses of Zepbound (12.5 mg and 15 mg) would be made available in single-dose vials for USD 499/month through LillyDirect’s Self Pay Journey Program. Providers can begin prescribing these doses from July 7, with patient deliveries beginning in early August, marking a pricing and access milestone (Eli Lilly, 2025).

Research Coverage and Scope Summary

Report Attributes Details
Market Size (2025) USD 22.3 billion
Projected Market Size (2035) USD  58.4 billion
CAGR (2025 to 2035) 10.1%
Base Year for Estimation 2024
Historical Period 2020 to 2024
Projections Period 2025 to 2035
Quantitative Units USD billion for value and million doses for volume
Indications Analyzed (Segment 1) Type 2 Diabetes Mellitus, Weight Management (Obesity), Cardiovascular Risk Reduction, Others (Prediabetes, Insulin Resistance Syndromes)
Dosage Strengths Analyzed (Segment 2) 0.25 mg Solution for Injection, 0.5 mg Solution for Injection, 1 mg Solution for Injection, 2 mg/3 mL (0.68 mg/mL), Other Custom Dosages
Distribution Channels Analyzed (Segment 3) Hospital Pharmacies, Retail Pharmacies, Online Pharmacies
Patient Types Analyzed (Segment 4) Insured Patients, Uninsured or Out-of-Pocket Buyers, Medicare/Medicaid/Third-Party Payors
Regions Covered North America, Europe, Asia Pacific, Latin America, Middle East & Africa
Countries Covered United States, Canada, Germany, United Kingdom, France, Italy, Spain, China, India, Japan, South Korea, Australia, Brazil, Mexico, Argentina, Saudi Arabia, UAE, South Africa
Key Players Novo Nordisk, Eli Lilly, Sanofi, AstraZeneca, Jiangsu Hansoh, Biocon, Dr. Reddy’s, Cipla
Additional Attributes Dollar sales by indication and dosage strength, demand trends in GLP-1 therapies, rising obesity-linked prescriptions, payer segmentation and coverage shifts, growth in online and out-of-pocket access points

Leading Companies in Ozempic Market

  • Novo Nordisk
  • Eli Lilly
  • Sanofi
  • AstraZeneca
  • Jiangsu Hansoh
  • Biocon
  • Dr. Reddy’s
  • Cipla

Key Segments

By Indication:

The segment includes Type 2 Diabetes Mellitus, Weight Management (Obesity), Cardiovascular Risk Reduction, and Others such as Prediabetes and Insulin Resistance Syndromes.

By Dosage Strength:

This includes 0.25 mg Solution for Injection, 0.5 mg Solution for Injection, 1 mg Solution for Injection, 2 mg/3 mL (0.68 mg/mL), and Other Custom Dosages.

By Distribution Channel:

The industry is segmented into Hospital Pharmacies, Retail Pharmacies, and Online Pharmacies.

By Patient Type:

This segment is divided into Insured Patients, Uninsured or Out-of-Pocket Buyers, and Medicare/Medicaid/Third-Party Payors.

By Region:

Regional analysis includes North America, Europe, Asia Pacific, Latin America, and Middle East & Africa.

Table of Content

  1. Executive Summary
    • Global Market Outlook
    • Demand-side Trends
    • Supply-side Trends
    • Technology Roadmap Analysis
    • Analysis and Recommendations
  2. Market Overview
    • Market Coverage / Taxonomy
    • Market Definition / Scope / Limitations
  3. Market Background
    • Market Dynamics
      • Drivers
      • Restraints
      • Opportunity
      • Trends
    • Scenario Forecast
      • Demand in Optimistic Scenario
      • Demand in Likely Scenario
      • Demand in Conservative Scenario
    • Opportunity Map Analysis
    • Product Life Cycle Analysis
    • Supply Chain Analysis
      • Supply Side Participants and their Roles
        • Producers
        • Mid-Level Participants (Traders/ Agents/ Brokers)
        • Wholesalers and Distributors
      • Value Added and Value Created at Node in the Supply Chain
      • List of Raw Material Suppliers
      • List of Existing and Potential Buyer’s
    • Investment Feasibility Matrix
    • Value Chain Analysis
      • Profit Margin Analysis
      • Wholesalers and Distributors
      • Retailers
    • PESTLE and Porter’s Analysis
    • Regulatory Landscape
      • By Key Regions
      • By Key Countries
    • Regional Parent Market Outlook
    • Production and Consumption Statistics
    • Import and Export Statistics
  4. Global Market Analysis 2020 to 2024 and Forecast, 2025 to 2035
    • Historical Market Size Value (USD Billion) & Volume (Million Doses) Analysis, 2020 to 2024
    • Current and Future Market Size Value (USD Billion) & Volume (Million Doses) Projections, 2025 to 2035
      • Y-o-Y Growth Trend Analysis
      • Absolute $ Opportunity Analysis
  5. Global Market Pricing Analysis 2020 to 2024 and Forecast 2025 to 2035
  6. Global Market Analysis 2020 to 2024 and Forecast 2025 to 2035, By Indication
    • Introduction / Key Findings
    • Historical Market Size Value (USD Billion) & Volume (Million Doses) Analysis By Indication, 2020 to 2024
    • Current and Future Market Size Value (USD Billion) & Volume (Million Doses) Analysis and Forecast By Indication, 2025 to 2035
      • Type 2 Diabetes Mellitus
      • Weight Management (Obesity)
      • Cardiovascular Risk Reduction
      • Others
    • Y-o-Y Growth Trend Analysis By Indication, 2020 to 2024
    • Absolute $ Opportunity Analysis By Indication, 2025 to 2035
  7. Global Market Analysis 2020 to 2024 and Forecast 2025 to 2035, By Dosage Strength
    • Introduction / Key Findings
    • Historical Market Size Value (USD Billion) & Volume (Million Doses) Analysis By Dosage Strength, 2020 to 2024
    • Current and Future Market Size Value (USD Billion) & Volume (Million Doses) Analysis and Forecast By Dosage Strength, 2025 to 2035
      • 0.25 mg solution for injection
      • 0.5 mg solution for injection
      • 1 mg solution for injection
      • 2 mg/3 mL (0.68 mg/mL)
      • Other Custom Dosages
    • Y-o-Y Growth Trend Analysis By Dosage Strength, 2020 to 2024
    • Absolute $ Opportunity Analysis By Dosage Strength, 2025 to 2035
  8. Global Market Analysis 2020 to 2024 and Forecast 2025 to 2035, By Distribution Channel
    • Introduction / Key Findings
    • Historical Market Size Value (USD Billion) & Volume (Million Doses) Analysis By Distribution Channel, 2020 to 2024
    • Current and Future Market Size Value (USD Billion) & Volume (Million Doses) Analysis and Forecast By Distribution Channel, 2025 to 2035
      • Hospital Pharmacies
      • Retail Pharmacies
      • Online Pharmacies
    • Y-o-Y Growth Trend Analysis By Distribution Channel, 2020 to 2024
    • Absolute $ Opportunity Analysis By Distribution Channel, 2025 to 2035
  9. Global Market Analysis 2020 to 2024 and Forecast 2025 to 2035, By Patient Type
    • Introduction / Key Findings
    • Historical Market Size Value (USD Billion) & Volume (Million Doses) Analysis By Patient Type, 2020 to 2024
    • Current and Future Market Size Value (USD Billion) & Volume (Million Doses) Analysis and Forecast By Patient Type, 2025 to 2035
      • Insured Patients
      • Uninsured or Out-of-Pocket Buyers
      • Medicare/Medicaid/Third-Party Payors
    • Y-o-Y Growth Trend Analysis By Patient Type, 2020 to 2024
    • Absolute $ Opportunity Analysis By Patient Type, 2025 to 2035
  10. Global Market Analysis 2020 to 2024 and Forecast 2025 to 2035, By Region
    • Introduction
    • Historical Market Size Value (USD Billion) & Volume (Million Doses) Analysis By Region, 2020 to 2024
    • Current Market Size Value (USD Billion) & Volume (Million Doses) Analysis and Forecast By Region, 2025 to 2035
      • North America
      • Latin America
      • Western Europe
      • Eastern Europe
      • East Asia
      • South Asia & Pacific
      • Middle East and Africa
    • Market Attractiveness Analysis By Region
  11. North America Market Analysis 2020 to 2024 and Forecast 2025 to 2035, By Country
    • Historical Market Size Value (USD Billion) & Volume (Million Doses) Trend Analysis By Market Taxonomy, 2020 to 2024
    • Market Size Value (USD Billion) & Volume (Million Doses) Forecast By Market Taxonomy, 2025 to 2035
      • By Country
        • USA
        • Canada
        • Mexico
      • By Indication
      • By Dosage Strength
      • By Distribution Channel
      • By Patient Type
    • Market Attractiveness Analysis
      • By Country
      • By Indication
      • By Dosage Strength
      • By Distribution Channel
      • By Patient Type
    • Key Takeaways
  12. Latin America Market Analysis 2020 to 2024 and Forecast 2025 to 2035, By Country
    • Historical Market Size Value (USD Billion) & Volume (Million Doses) Trend Analysis By Market Taxonomy, 2020 to 2024
    • Market Size Value (USD Billion) & Volume (Million Doses) Forecast By Market Taxonomy, 2025 to 2035
      • By Country
        • Brazil
        • Argentina
        • Rest of LATAM
      • By Indication
      • By Dosage Strength
      • By Distribution Channel
      • By Patient Type
    • Market Attractiveness Analysis
      • By Country
      • By Indication
      • By Dosage Strength
      • By Distribution Channel
      • By Patient Type
    • Key Takeaways
  13. Western Europe Market Analysis 2020 to 2024 and Forecast 2025 to 2035, By Country
    • Historical Market Size Value (USD Billion) & Volume (Million Doses) Trend Analysis By Market Taxonomy, 2020 to 2024
    • Market Size Value (USD Billion) & Volume (Million Doses) Forecast By Market Taxonomy, 2025 to 2035
      • By Country
        • Germany
        • Italy
        • France
        • UK
        • Spain
        • BENELUX
        • Nordic
        • Rest of W.Europe
      • By Indication
      • By Dosage Strength
      • By Distribution Channel
      • By Patient Type
    • Market Attractiveness Analysis
      • By Country
      • By Indication
      • By Dosage Strength
      • By Distribution Channel
      • By Patient Type
    • Key Takeaways
  14. Eastern Europe Market Analysis 2020 to 2024 and Forecast 2025 to 2035, By Country
    • Historical Market Size Value (USD Billion) & Volume (Million Doses) Trend Analysis By Market Taxonomy, 2020 to 2024
    • Market Size Value (USD Billion) & Volume (Million Doses) Forecast By Market Taxonomy, 2025 to 2035
      • By Country
        • Russia
        • Hungary
        • Poland
        • Balkan & Baltics
        • Rest of E. Europe
      • By Indication
      • By Dosage Strength
      • By Distribution Channel
      • By Patient Type
    • Market Attractiveness Analysis
      • By Country
      • By Indication
      • By Dosage Strength
      • By Distribution Channel
      • By Patient Type
    • Key Takeaways
  15. East Asia Market Analysis 2020 to 2024 and Forecast 2025 to 2035, By Country
    • Historical Market Size Value (USD Billion) & Volume (Million Doses) Trend Analysis By Market Taxonomy, 2020 to 2024
    • Market Size Value (USD Billion) & Volume (Million Doses) Forecast By Market Taxonomy, 2025 to 2035
      • By Country
        • China
        • Japan
        • South Korea
      • By Indication
      • By Dosage Strength
      • By Distribution Channel
      • By Patient Type
    • Market Attractiveness Analysis
      • By Country
      • By Indication
      • By Dosage Strength
      • By Distribution Channel
      • By Patient Type
    • Key Takeaways
  16. South Asia & Pacific Market Analysis 2020 to 2024 and Forecast 2025 to 2035, By Country
    • Historical Market Size Value (USD Billion) & Volume (Million Doses) Trend Analysis By Market Taxonomy, 2020 to 2024
    • Market Size Value (USD Billion) & Volume (Million Doses) Forecast By Market Taxonomy, 2025 to 2035
      • By Country
        • India
        • Australia & New Zealand
        • ASEAN
        • Rest of SAP
      • By Indication
      • By Dosage Strength
      • By Distribution Channel
      • By Patient Type
    • Market Attractiveness Analysis
      • By Country
      • By Indication
      • By Dosage Strength
      • By Distribution Channel
      • By Patient Type
    • Key Takeaways
  17. Middle East and Africa Market Analysis 2020 to 2024 and Forecast 2025 to 2035, By Country
    • Historical Market Size Value (USD Billion) & Volume (Million Doses) Trend Analysis By Market Taxonomy, 2020 to 2024
    • Market Size Value (USD Billion) & Volume (Million Doses) Forecast By Market Taxonomy, 2025 to 2035
      • By Country
        • GCC Countries
        • Northern Africa
        • South Africa
        • Turkiye
        • Rest of MEA
      • By Indication
      • By Dosage Strength
      • By Distribution Channel
      • By Patient Type
    • Market Attractiveness Analysis
      • By Country
      • By Indication
      • By Dosage Strength
      • By Distribution Channel
      • By Patient Type
    • Key Takeaways
  18. Key Countries Market Analysis
    • USA
      • Pricing Analysis
      • Market Share Analysis, 2024
        • By Indication
        • By Dosage Strength
        • By Distribution Channel
        • By Patient Type
    • Canada
      • Pricing Analysis
      • Market Share Analysis, 2024
        • By Indication
        • By Dosage Strength
        • By Distribution Channel
        • By Patient Type
    • Brazil
      • Pricing Analysis
      • Market Share Analysis, 2024
        • By Indication
        • By Dosage Strength
        • By Distribution Channel
        • By Patient Type
    • Mexico
      • Pricing Analysis
      • Market Share Analysis, 2024
        • By Indication
        • By Dosage Strength
        • By Distribution Channel
        • By Patient Type
    • Argentina
      • Pricing Analysis
      • Market Share Analysis, 2024
        • By Indication
        • By Dosage Strength
        • By Distribution Channel
        • By Patient Type
  19. Market Structure Analysis
    • Competition Dashboard
    • Competition Benchmarking
    • Market Share Analysis of Top Players
      • By Regional
      • By Indication
      • By Dosage Strength
      • By Distribution Channel
      • By Patient Type
  20. Competition Analysis
    • Competition Deep Dive
      • Novo Nordisk
        • Overview
        • Product Portfolio
        • Profitability by Market Segments (Product/Age /Sales Channel/Region)
        • Sales Footprint
        • Strategy Overview
          • Marketing Strategy
          • Product Strategy
          • Channel Strategy
      • Eli Lilly
        • Overview
        • Product Portfolio
        • Profitability by Market Segments (Product/Age /Sales Channel/Region)
        • Sales Footprint
        • Strategy Overview
          • Marketing Strategy
          • Product Strategy
          • Channel Strategy
      • Sanofi
        • Overview
        • Product Portfolio
        • Profitability by Market Segments (Product/Age /Sales Channel/Region)
        • Sales Footprint
        • Strategy Overview
          • Marketing Strategy
          • Product Strategy
          • Channel Strategy
      • AstraZeneca
        • Overview
        • Product Portfolio
        • Profitability by Market Segments (Product/Age /Sales Channel/Region)
        • Sales Footprint
        • Strategy Overview
          • Marketing Strategy
          • Product Strategy
          • Channel Strategy
      • Jiangsu Hansoh
        • Overview
        • Product Portfolio
        • Profitability by Market Segments (Product/Age /Sales Channel/Region)
        • Sales Footprint
        • Strategy Overview
          • Marketing Strategy
          • Product Strategy
          • Channel Strategy
      • Biocon
        • Overview
        • Product Portfolio
        • Profitability by Market Segments (Product/Age /Sales Channel/Region)
        • Sales Footprint
        • Strategy Overview
          • Marketing Strategy
          • Product Strategy
          • Channel Strategy
      • Dr. Reddy’s
        • Overview
        • Product Portfolio
        • Profitability by Market Segments (Product/Age /Sales Channel/Region)
        • Sales Footprint
        • Strategy Overview
          • Marketing Strategy
          • Product Strategy
          • Channel Strategy
      • Cipla
        • Overview
        • Product Portfolio
        • Profitability by Market Segments (Product/Age /Sales Channel/Region)
        • Sales Footprint
        • Strategy Overview
          • Marketing Strategy
          • Product Strategy
          • Channel Strategy
  21. Assumptions & Acronyms Used
  22. Research Methodology

List of Tables

  • Table 1: Global Market Value (USD Billion) Forecast by Region, 2020 to 2035
  • Table 2: Global Market Volume (Million Doses) Forecast by Region, 2020 to 2035
  • Table 3: Global Market Value (USD Billion) Forecast by Indication, 2020 to 2035
  • Table 4: Global Market Volume (Million Doses) Forecast by Indication, 2020 to 2035
  • Table 5: Global Market Value (USD Billion) Forecast by Dosage Strength, 2020 to 2035
  • Table 6: Global Market Volume (Million Doses) Forecast by Dosage Strength, 2020 to 2035
  • Table 7: Global Market Value (USD Billion) Forecast by Distribution Channel, 2020 to 2035
  • Table 8: Global Market Volume (Million Doses) Forecast by Distribution Channel, 2020 to 2035
  • Table 9: Global Market Value (USD Billion) Forecast by Patient Type, 2020 to 2035
  • Table 10: Global Market Volume (Million Doses) Forecast by Patient Type, 2020 to 2035
  • Table 11: North America Market Value (USD Billion) Forecast by Country, 2020 to 2035
  • Table 12: North America Market Volume (Million Doses) Forecast by Country, 2020 to 2035
  • Table 13: North America Market Value (USD Billion) Forecast by Indication, 2020 to 2035
  • Table 14: North America Market Volume (Million Doses) Forecast by Indication, 2020 to 2035
  • Table 15: North America Market Value (USD Billion) Forecast by Dosage Strength, 2020 to 2035
  • Table 16: North America Market Volume (Million Doses) Forecast by Dosage Strength, 2020 to 2035
  • Table 17: North America Market Value (USD Billion) Forecast by Distribution Channel, 2020 to 2035
  • Table 18: North America Market Volume (Million Doses) Forecast by Distribution Channel, 2020 to 2035
  • Table 19: North America Market Value (USD Billion) Forecast by Patient Type, 2020 to 2035
  • Table 20: North America Market Volume (Million Doses) Forecast by Patient Type, 2020 to 2035
  • Table 21: Latin America Market Value (USD Billion) Forecast by Country, 2020 to 2035
  • Table 22: Latin America Market Volume (Million Doses) Forecast by Country, 2020 to 2035
  • Table 23: Latin America Market Value (USD Billion) Forecast by Indication, 2020 to 2035
  • Table 24: Latin America Market Volume (Million Doses) Forecast by Indication, 2020 to 2035
  • Table 25: Latin America Market Value (USD Billion) Forecast by Dosage Strength, 2020 to 2035
  • Table 26: Latin America Market Volume (Million Doses) Forecast by Dosage Strength, 2020 to 2035
  • Table 27: Latin America Market Value (USD Billion) Forecast by Distribution Channel, 2020 to 2035
  • Table 28: Latin America Market Volume (Million Doses) Forecast by Distribution Channel, 2020 to 2035
  • Table 29: Latin America Market Value (USD Billion) Forecast by Patient Type, 2020 to 2035
  • Table 30: Latin America Market Volume (Million Doses) Forecast by Patient Type, 2020 to 2035
  • Table 31: Western Europe Market Value (USD Billion) Forecast by Country, 2020 to 2035
  • Table 32: Western Europe Market Volume (Million Doses) Forecast by Country, 2020 to 2035
  • Table 33: Western Europe Market Value (USD Billion) Forecast by Indication, 2020 to 2035
  • Table 34: Western Europe Market Volume (Million Doses) Forecast by Indication, 2020 to 2035
  • Table 35: Western Europe Market Value (USD Billion) Forecast by Dosage Strength, 2020 to 2035
  • Table 36: Western Europe Market Volume (Million Doses) Forecast by Dosage Strength, 2020 to 2035
  • Table 37: Western Europe Market Value (USD Billion) Forecast by Distribution Channel, 2020 to 2035
  • Table 38: Western Europe Market Volume (Million Doses) Forecast by Distribution Channel, 2020 to 2035
  • Table 39: Western Europe Market Value (USD Billion) Forecast by Patient Type, 2020 to 2035
  • Table 40: Western Europe Market Volume (Million Doses) Forecast by Patient Type, 2020 to 2035
  • Table 41: Eastern Europe Market Value (USD Billion) Forecast by Country, 2020 to 2035
  • Table 42: Eastern Europe Market Volume (Million Doses) Forecast by Country, 2020 to 2035
  • Table 43: Eastern Europe Market Value (USD Billion) Forecast by Indication, 2020 to 2035
  • Table 44: Eastern Europe Market Volume (Million Doses) Forecast by Indication, 2020 to 2035
  • Table 45: Eastern Europe Market Value (USD Billion) Forecast by Dosage Strength, 2020 to 2035
  • Table 46: Eastern Europe Market Volume (Million Doses) Forecast by Dosage Strength, 2020 to 2035
  • Table 47: Eastern Europe Market Value (USD Billion) Forecast by Distribution Channel, 2020 to 2035
  • Table 48: Eastern Europe Market Volume (Million Doses) Forecast by Distribution Channel, 2020 to 2035
  • Table 49: Eastern Europe Market Value (USD Billion) Forecast by Patient Type, 2020 to 2035
  • Table 50: Eastern Europe Market Volume (Million Doses) Forecast by Patient Type, 2020 to 2035
  • Table 51: East Asia Market Value (USD Billion) Forecast by Country, 2020 to 2035
  • Table 52: East Asia Market Volume (Million Doses) Forecast by Country, 2020 to 2035
  • Table 53: East Asia Market Value (USD Billion) Forecast by Indication, 2020 to 2035
  • Table 54: East Asia Market Volume (Million Doses) Forecast by Indication, 2020 to 2035
  • Table 55: East Asia Market Value (USD Billion) Forecast by Dosage Strength, 2020 to 2035
  • Table 56: East Asia Market Volume (Million Doses) Forecast by Dosage Strength, 2020 to 2035
  • Table 57: East Asia Market Value (USD Billion) Forecast by Distribution Channel, 2020 to 2035
  • Table 58: East Asia Market Volume (Million Doses) Forecast by Distribution Channel, 2020 to 2035
  • Table 59: East Asia Market Value (USD Billion) Forecast by Patient Type, 2020 to 2035
  • Table 60: East Asia Market Volume (Million Doses) Forecast by Patient Type, 2020 to 2035
  • Table 61: South Asia & Pacific Market Value (USD Billion) Forecast by Country, 2020 to 2035
  • Table 62: South Asia & Pacific Market Volume (Million Doses) Forecast by Country, 2020 to 2035
  • Table 63: South Asia & Pacific Market Value (USD Billion) Forecast by Indication, 2020 to 2035
  • Table 64: South Asia & Pacific Market Volume (Million Doses) Forecast by Indication, 2020 to 2035
  • Table 65: South Asia & Pacific Market Value (USD Billion) Forecast by Dosage Strength, 2020 to 2035
  • Table 66: South Asia & Pacific Market Volume (Million Doses) Forecast by Dosage Strength, 2020 to 2035
  • Table 67: South Asia & Pacific Market Value (USD Billion) Forecast by Distribution Channel, 2020 to 2035
  • Table 68: South Asia & Pacific Market Volume (Million Doses) Forecast by Distribution Channel, 2020 to 2035
  • Table 69: South Asia & Pacific Market Value (USD Billion) Forecast by Patient Type, 2020 to 2035
  • Table 70: South Asia & Pacific Market Volume (Million Doses) Forecast by Patient Type, 2020 to 2035
  • Table 71: Middle East and Africa Market Value (USD Billion) Forecast by Country, 2020 to 2035
  • Table 72: Middle East and Africa Market Volume (Million Doses) Forecast by Country, 2020 to 2035
  • Table 73: Middle East and Africa Market Value (USD Billion) Forecast by Indication, 2020 to 2035
  • Table 74: Middle East and Africa Market Volume (Million Doses) Forecast by Indication, 2020 to 2035
  • Table 75: Middle East and Africa Market Value (USD Billion) Forecast by Dosage Strength, 2020 to 2035
  • Table 76: Middle East and Africa Market Volume (Million Doses) Forecast by Dosage Strength, 2020 to 2035
  • Table 77: Middle East and Africa Market Value (USD Billion) Forecast by Distribution Channel, 2020 to 2035
  • Table 78: Middle East and Africa Market Volume (Million Doses) Forecast by Distribution Channel, 2020 to 2035
  • Table 79: Middle East and Africa Market Value (USD Billion) Forecast by Patient Type, 2020 to 2035
  • Table 80: Middle East and Africa Market Volume (Million Doses) Forecast by Patient Type, 2020 to 2035

List of Figures

  • Figure 1: Global Market Volume (Million Doses) Forecast 2020 to 2035
  • Figure 2: Global Market Pricing Analysis
  • Figure 3: Global Market Value (USD Billion) Forecast 2020 to 2035
  • Figure 4: Global Market Value Share and BPS Analysis by Indication, 2025 and 2035
  • Figure 5: Global Market Y-o-Y Growth Comparison by Indication, 2025 to 2035
  • Figure 6: Global Market Attractiveness Analysis by Indication
  • Figure 7: Global Market Value Share and BPS Analysis by Dosage Strength, 2025 and 2035
  • Figure 8: Global Market Y-o-Y Growth Comparison by Dosage Strength, 2025 to 2035
  • Figure 9: Global Market Attractiveness Analysis by Dosage Strength
  • Figure 10: Global Market Value Share and BPS Analysis by Distribution Channel, 2025 and 2035
  • Figure 11: Global Market Y-o-Y Growth Comparison by Distribution Channel, 2025 to 2035
  • Figure 12: Global Market Attractiveness Analysis by Distribution Channel
  • Figure 13: Global Market Value Share and BPS Analysis by Patient Type, 2025 and 2035
  • Figure 14: Global Market Y-o-Y Growth Comparison by Patient Type, 2025 to 2035
  • Figure 15: Global Market Attractiveness Analysis by Patient Type
  • Figure 16: Global Market Value (USD Billion) Share and BPS Analysis by Region, 2025 and 2035
  • Figure 17: Global Market Y-o-Y Growth Comparison by Region, 2025 to 2035
  • Figure 18: Global Market Attractiveness Analysis by Region
  • Figure 19: North America Market Incremental $ Opportunity, 2025 to 2035
  • Figure 20: Latin America Market Incremental $ Opportunity, 2025 to 2035
  • Figure 21: Western Europe Market Incremental $ Opportunity, 2025 to 2035
  • Figure 22: Eastern Europe Market Incremental $ Opportunity, 2025 to 2035
  • Figure 23: East Asia Market Incremental $ Opportunity, 2025 to 2035
  • Figure 24: South Asia & Pacific Market Incremental $ Opportunity, 2025 to 2035
  • Figure 25: Middle East and Africa Market Incremental $ Opportunity, 2025 to 2035
  • Figure 26: North America Market Value Share and BPS Analysis by Country, 2025 and 2035
  • Figure 27: North America Market Value Share and BPS Analysis by Indication, 2025 and 2035
  • Figure 28: North America Market Y-o-Y Growth Comparison by Indication, 2025 to 2035
  • Figure 29: North America Market Attractiveness Analysis by Indication
  • Figure 30: North America Market Value Share and BPS Analysis by Dosage Strength, 2025 and 2035
  • Figure 31: North America Market Y-o-Y Growth Comparison by Dosage Strength, 2025 to 2035
  • Figure 32: North America Market Attractiveness Analysis by Dosage Strength
  • Figure 33: North America Market Value Share and BPS Analysis by Distribution Channel, 2025 and 2035
  • Figure 34: North America Market Y-o-Y Growth Comparison by Distribution Channel, 2025 to 2035
  • Figure 35: North America Market Attractiveness Analysis by Distribution Channel
  • Figure 36: North America Market Value Share and BPS Analysis by Patient Type, 2025 and 2035
  • Figure 37: North America Market Y-o-Y Growth Comparison by Patient Type, 2025 to 2035
  • Figure 38: North America Market Attractiveness Analysis by Patient Type
  • Figure 39: Latin America Market Value Share and BPS Analysis by Country, 2025 and 2035
  • Figure 40: Latin America Market Value Share and BPS Analysis by Indication, 2025 and 2035
  • Figure 41: Latin America Market Y-o-Y Growth Comparison by Indication, 2025 to 2035
  • Figure 42: Latin America Market Attractiveness Analysis by Indication
  • Figure 43: Latin America Market Value Share and BPS Analysis by Dosage Strength, 2025 and 2035
  • Figure 44: Latin America Market Y-o-Y Growth Comparison by Dosage Strength, 2025 to 2035
  • Figure 45: Latin America Market Attractiveness Analysis by Dosage Strength
  • Figure 46: Latin America Market Value Share and BPS Analysis by Distribution Channel, 2025 and 2035
  • Figure 47: Latin America Market Y-o-Y Growth Comparison by Distribution Channel, 2025 to 2035
  • Figure 48: Latin America Market Attractiveness Analysis by Distribution Channel
  • Figure 49: Latin America Market Value Share and BPS Analysis by Patient Type, 2025 and 2035
  • Figure 50: Latin America Market Y-o-Y Growth Comparison by Patient Type, 2025 to 2035
  • Figure 51: Latin America Market Attractiveness Analysis by Patient Type
  • Figure 52: Western Europe Market Value Share and BPS Analysis by Country, 2025 and 2035
  • Figure 53: Western Europe Market Value Share and BPS Analysis by Indication, 2025 and 2035
  • Figure 54: Western Europe Market Y-o-Y Growth Comparison by Indication, 2025 to 2035
  • Figure 55: Western Europe Market Attractiveness Analysis by Indication
  • Figure 56: Western Europe Market Value Share and BPS Analysis by Dosage Strength, 2025 and 2035
  • Figure 57: Western Europe Market Y-o-Y Growth Comparison by Dosage Strength, 2025 to 2035
  • Figure 58: Western Europe Market Attractiveness Analysis by Dosage Strength
  • Figure 59: Western Europe Market Value Share and BPS Analysis by Distribution Channel, 2025 and 2035
  • Figure 60: Western Europe Market Y-o-Y Growth Comparison by Distribution Channel, 2025 to 2035
  • Figure 61: Western Europe Market Attractiveness Analysis by Distribution Channel
  • Figure 62: Western Europe Market Value Share and BPS Analysis by Patient Type, 2025 and 2035
  • Figure 63: Western Europe Market Y-o-Y Growth Comparison by Patient Type, 2025 to 2035
  • Figure 64: Western Europe Market Attractiveness Analysis by Patient Type
  • Figure 65: Eastern Europe Market Value Share and BPS Analysis by Country, 2025 and 2035
  • Figure 66: Eastern Europe Market Value Share and BPS Analysis by Indication, 2025 and 2035
  • Figure 67: Eastern Europe Market Y-o-Y Growth Comparison by Indication, 2025 to 2035
  • Figure 68: Eastern Europe Market Attractiveness Analysis by Indication
  • Figure 69: Eastern Europe Market Value Share and BPS Analysis by Dosage Strength, 2025 and 2035
  • Figure 70: Eastern Europe Market Y-o-Y Growth Comparison by Dosage Strength, 2025 to 2035
  • Figure 71: Eastern Europe Market Attractiveness Analysis by Dosage Strength
  • Figure 72: Eastern Europe Market Value Share and BPS Analysis by Distribution Channel, 2025 and 2035
  • Figure 73: Eastern Europe Market Y-o-Y Growth Comparison by Distribution Channel, 2025 to 2035
  • Figure 74: Eastern Europe Market Attractiveness Analysis by Distribution Channel
  • Figure 75: Eastern Europe Market Value Share and BPS Analysis by Patient Type, 2025 and 2035
  • Figure 76: Eastern Europe Market Y-o-Y Growth Comparison by Patient Type, 2025 to 2035
  • Figure 77: Eastern Europe Market Attractiveness Analysis by Patient Type
  • Figure 78: East Asia Market Value Share and BPS Analysis by Country, 2025 and 2035
  • Figure 79: East Asia Market Value Share and BPS Analysis by Indication, 2025 and 2035
  • Figure 80: East Asia Market Y-o-Y Growth Comparison by Indication, 2025 to 2035
  • Figure 81: East Asia Market Attractiveness Analysis by Indication
  • Figure 82: East Asia Market Value Share and BPS Analysis by Dosage Strength, 2025 and 2035
  • Figure 83: East Asia Market Y-o-Y Growth Comparison by Dosage Strength, 2025 to 2035
  • Figure 84: East Asia Market Attractiveness Analysis by Dosage Strength
  • Figure 85: East Asia Market Value Share and BPS Analysis by Distribution Channel, 2025 and 2035
  • Figure 86: East Asia Market Y-o-Y Growth Comparison by Distribution Channel, 2025 to 2035
  • Figure 87: East Asia Market Attractiveness Analysis by Distribution Channel
  • Figure 88: East Asia Market Value Share and BPS Analysis by Patient Type, 2025 and 2035
  • Figure 89: East Asia Market Y-o-Y Growth Comparison by Patient Type, 2025 to 2035
  • Figure 90: East Asia Market Attractiveness Analysis by Patient Type
  • Figure 91: South Asia & Pacific Market Value Share and BPS Analysis by Country, 2025 and 2035
  • Figure 92: South Asia & Pacific Market Value Share and BPS Analysis by Indication, 2025 and 2035
  • Figure 93: South Asia & Pacific Market Y-o-Y Growth Comparison by Indication, 2025 to 2035
  • Figure 94: South Asia & Pacific Market Attractiveness Analysis by Indication
  • Figure 95: South Asia & Pacific Market Value Share and BPS Analysis by Dosage Strength, 2025 and 2035
  • Figure 96: South Asia & Pacific Market Y-o-Y Growth Comparison by Dosage Strength, 2025 to 2035
  • Figure 97: South Asia & Pacific Market Attractiveness Analysis by Dosage Strength
  • Figure 98: South Asia & Pacific Market Value Share and BPS Analysis by Distribution Channel, 2025 and 2035
  • Figure 99: South Asia & Pacific Market Y-o-Y Growth Comparison by Distribution Channel, 2025 to 2035
  • Figure 100: South Asia & Pacific Market Attractiveness Analysis by Distribution Channel
  • Figure 101: South Asia & Pacific Market Value Share and BPS Analysis by Patient Type, 2025 and 2035
  • Figure 102: South Asia & Pacific Market Y-o-Y Growth Comparison by Patient Type, 2025 to 2035
  • Figure 103: South Asia & Pacific Market Attractiveness Analysis by Patient Type
  • Figure 104: Middle East and Africa Market Value Share and BPS Analysis by Country, 2025 and 2035
  • Figure 105: Middle East and Africa Market Value Share and BPS Analysis by Indication, 2025 and 2035
  • Figure 106: Middle East and Africa Market Y-o-Y Growth Comparison by Indication, 2025 to 2035
  • Figure 107: Middle East and Africa Market Attractiveness Analysis by Indication
  • Figure 108: Middle East and Africa Market Value Share and BPS Analysis by Dosage Strength, 2025 and 2035
  • Figure 109: Middle East and Africa Market Y-o-Y Growth Comparison by Dosage Strength, 2025 to 2035
  • Figure 110: Middle East and Africa Market Attractiveness Analysis by Dosage Strength
  • Figure 111: Middle East and Africa Market Value Share and BPS Analysis by Distribution Channel, 2025 and 2035
  • Figure 112: Middle East and Africa Market Y-o-Y Growth Comparison by Distribution Channel, 2025 to 2035
  • Figure 113: Middle East and Africa Market Attractiveness Analysis by Distribution Channel
  • Figure 114: Middle East and Africa Market Value Share and BPS Analysis by Patient Type, 2025 and 2035
  • Figure 115: Middle East and Africa Market Y-o-Y Growth Comparison by Patient Type, 2025 to 2035
  • Figure 116: Middle East and Africa Market Attractiveness Analysis by Patient Type
  • Figure 117: Global Market - Tier Structure Analysis
  • Figure 118: Global Market - Company Share Analysis

Frequently Asked Questions

What is the projected industry value of the ozempic market in 2025?

The industry is projected to reach USD 22.3 billion in 2025.

What is the expected global CAGR for the ozempic market from 2025 to 2035?

The industry is expected to grow at a CAGR of 10.1% from 2025 to 2035.

Which segment is expected to dominate the ozempic market in 2025?

Type 2 Diabetes Mellitus is expected to capture 57% in 2025.

Which region is forecasted to show significant growth in the ozempic market by 2035?

The Asia Pacific region, particularly India, is projected to register a CAGR of 14.8% from 2025 to 2035.

What is the forecasted industry value of the ozempic market by 2035?

The industry is projected to reach USD 58.4 billion by 2035.

Future Market Insights

Ozempic Market