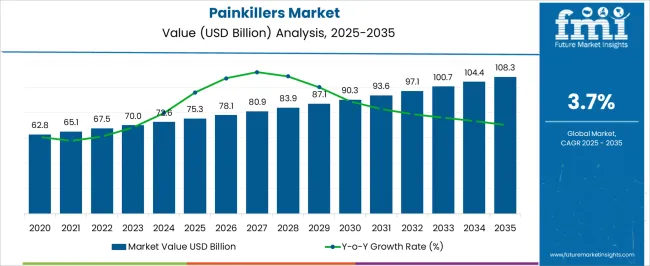
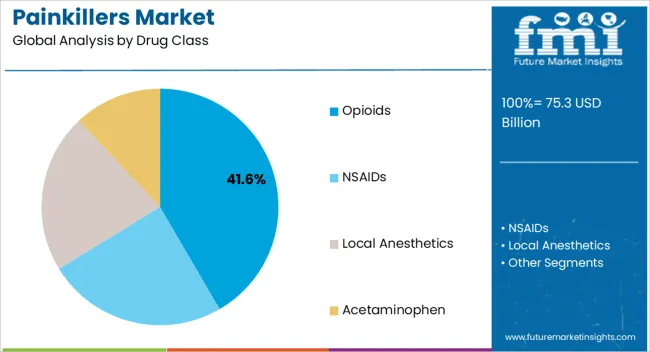
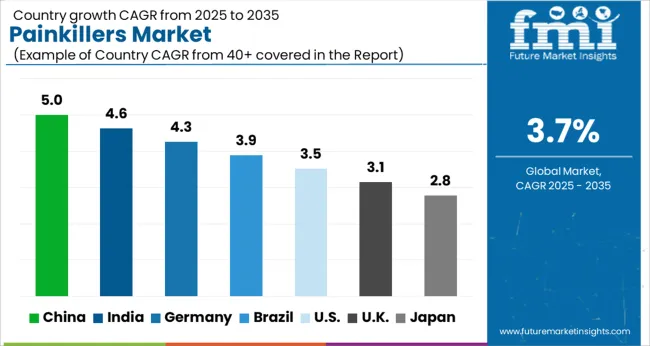
The global painkillers market is expected to enjoy a valuation of USD 70.0 Billion by the end of the year 2023, and further expand at a CAGR of 3.7% to reach a valuation of ~USD 100.9 Billion by the year 2033. According to a recent study by Future Market Insights, opioids are leading the market with a share of about 53.4% in the year 2022, within the global market.
Market Outlook:
Data Points | Market Insights |
---|---|
Market Value 2022 | USD 67.7 Billion |
Market Value 2023 | USD 70.0 Billion |
Market Value 2033 | USD 100.9 Billion |
CAGR 2023 to 2033 | 3.7% |
Market Share of Top 5 Countries (2022) | 59.1% |
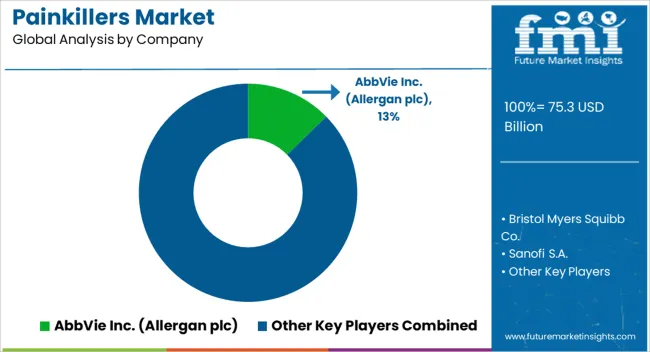
Key Market Players | AbbVie Inc. (Allergan plc), Bristol Myers Squibb Co., Sanofi S.A., Boehringer Ingelheim International GmbH, Pfizer Inc., Zydus Lifesciences Ltd. (Cadila Pharmaceuticals), GSK plc., Abbott Laboratories, Inc., Novartis AG, Johnson & Johnson (Janssen Pharmaceuticals, Inc.), Sun Pharmaceutical Industries Ltd., Teva Pharmaceuticals Ltd., Mallinckrodt Pharmaceuticals, Endo Pharmaceuticals Inc., Bayer AG, F. Hoffmann-La Roche Ltd., Procter & Gamble, AstraZeneca, Cardinal Health, Perrigo Company Plc., Bausch Health Companies Inc., Viatris, Amneal Pharmaceuticals, and Purdue Pharmaceuticals L.P. |
Manufacturers are focused on developing non-opioid drugs with a novel extended-release delivery approach that can relieve postoperative pain over a longer period of time. Opioid drugs are highly effective pain relievers, but they are also highly addictive and can lead to abuse and dependence. The opioid epidemic has led to a growing need for non-opioid pain management options.
Overall, the development of non-opioid extended-release pain medications is an important step in addressing the opioid epidemic and providing patients with a safer option, thereby will drive the overall growth of the painkillers market during the forecast period (2023 to 2033).
The market value for painkillers was around 4.8% of the overall ~USD 1,400.5 Billion of the global pharmaceuticals market in 2022.
An increasing number of patients suffering from chronic diseases such as cancer and chronic obstructive pulmonary disease (COPD), various prescription drugs for postoperative pain management, and various traumas leading to pain are expected to fuel the growth of global market for painkillers.
Certain health conditions such as diabetes, cancer, and autoimmune diseases are known to increase the risk of developing chronic pain and neuropathic pain. Therefore, it is important that healthcare providers are aware of the increasing prevalence of these conditions and provide appropriate treatment strategies to improve patients’ quality of life.
Overall, the global market is projected to expand at a CAGR of 3.7% during the forecast period (2023 to 2033).
The regulatory scenario for painkillers can have a significant impact on the growth of the market. In recent years, opioid pain medications have come under increased scrutiny, resulting in stricter regulations and restrictions on their use. This has created opportunities for non-opioid pain medications such as NSAIDs and other non-narcotic medications to gain market share. In addition, regulatory initiatives to improve pain management and reduce opioid abuse, such as prescription drug monitoring programs and physician education programs, may create opportunities for companies offering alternative pain management solutions.
Overall, the regulatory scenario for painkillers is complex and evolving. However, regulatory initiatives that promote safe and effective pain management can create growth opportunities for the painkillers manufacturers, especially for companies that offer innovative solutions.
The companies that navigate the regulatory landscape and invest in innovative solutions to meet the evolving needs of patients and healthcare providers offer lucrative growth opportunities for the market and will raise the market to new heights during the forecast period from 2023 to 2033.
Per capita use of opioids is low in Asian countries. According to the Global Opioids Policy Initiative (GOPI), some of the main factors responsible for low opioid use in Asia and Africa include: full patient cost coverage is required, patient registration required before prescribing opioids, and physicians must obtain special permission to prescribe opioids.
The availability of painkillers in Asian and African countries may have a significant impact on the growth of the painkiller market in these regions. In many of these countries, access to painkillers is limited due to various factors such as lack of infrastructure, regulatory issues, and economic constraints. This can lead to a significant unmet need for painkillers, which can ultimately impact the growth of the market.
These factors are negatively impacting the growth of the painkillers market in Asia and Africa and projections have been made which are restraining the growth of the market during the forecast period from 2023 to 2033 in the world.
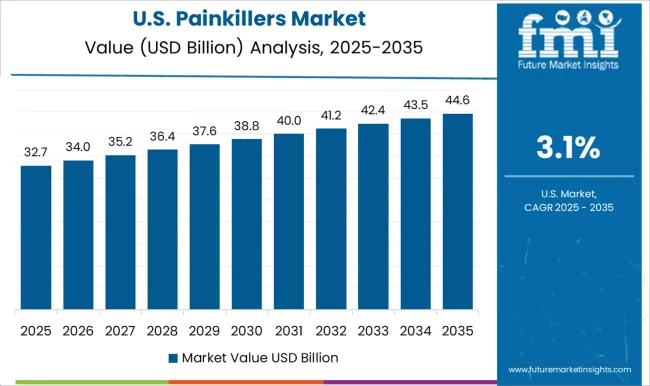
With a market share of 91.5% in 2022, the USA will continue to dominate the North American region. This large market share is expected to continue throughout the forecast period.
In the USA, palliative care facilities are provided in accordance with government and commercial reimbursement guidelines. Palliative care programs in hospitals in the USA include dedicated inpatient palliative care units and palliative care consultation teams.
Also, the American Chronic Pain Association has designated September as Pain Awareness Month, and more than 80 organizations and healthcare professionals, and consumer groups have supported the initiative. This will result in the propulsion of demand for painkillers in the country during the forecast period of 2023 to 2033.
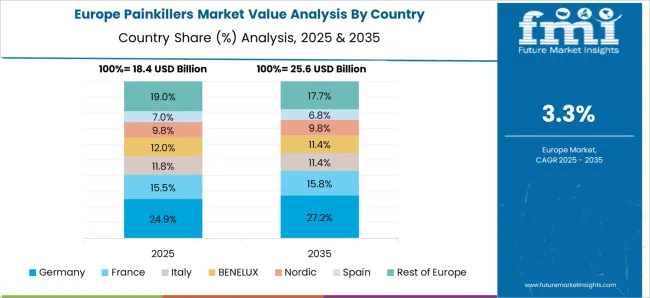
Germany dominates the Western European region with a total market share of about 25.6% in 2022 and is expected to continue to experience the same growth throughout the forecast period.
In Germany, there is a growing interest in personalized medicine, which is also reflected in the painkillers market. Pharmaceutical companies are developing painkillers tailored to specific patient groups, such as the elderly or people with kidney problems, in order to achieve more targeted and effective pain relief. This will foster profitable market growth over the course of the forecast period.
Japan dominates the East Asia region with market share of 45.1% in 2022 and will expand with growing numbers in the future.
Japan has taken various initiatives to improve pain management, including the establishment of pain clinics, the development of clinical guidelines for pain management, and the training of healthcare professionals in pain management.
The Japan market for painkillers is expected to continue to grow in the coming years, driven by changing demographics, shifting consumer preferences, and increasing investment in pain management R&D all suggest that Japan will continue to be an important market for painkillers.
Opioids are expected to present growth at a CAGR of 2.1% throughout the forecast period, with a market share of 53.4% in the global market in 2022.
Opioids are relatively inexpensive compared to some of the newer non-opioid pain medications. Opioids have been used for pain relief for centuries, and many healthcare providers are familiar with their use and feel comfortable prescribing them.
As the demand for non-opioids continues to grow, the market for painkillers is expected to expand significantly in the coming years.
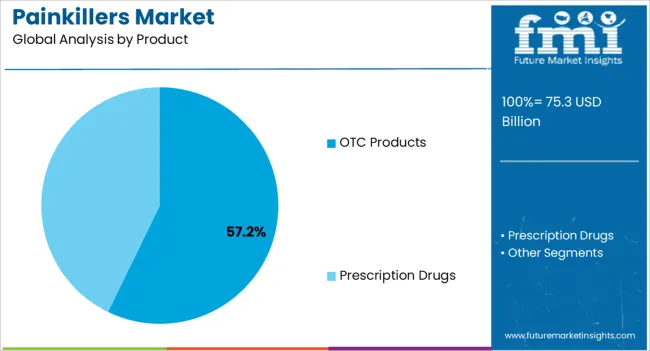
Prescription Drugs dominated the global market with a value share of 58.8% in 2022.
Prescription drugs are leading in the global market for painkillers over over-the-counter (OTC) drugs because they are often more effective at providing pain relief for moderate to severe pain. Prescription painkillers are also often covered by health insurance, which can make them more affordable for patients who need them.
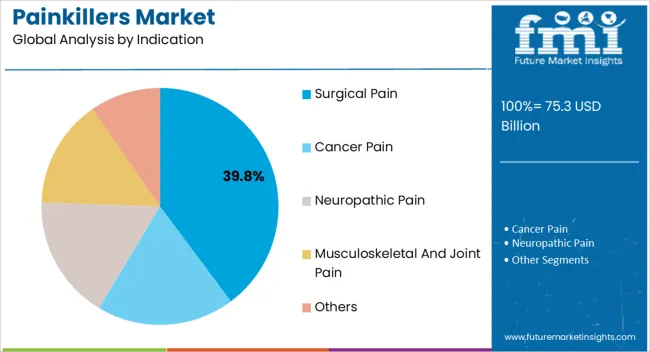
Surgical pain is leading the market with a market share of 43.3% in the global market in 2022.
Surgical pain is leading in the market over other indications because surgery is a common cause of acute pain, and pain relief is an important part of the post-surgical recovery process. Many surgical procedures can be painful, and without adequate pain control, patients may experience significant discomfort, which can delay healing and recovery.
The oral route of administration is leading the market with a revenue share of 38.7% in 2022 as oral painkillers are easy to take and can be self-administered, which can make them more convenient for patients and also it is generally less invasive than other routes, such as injections or transdermal patches, which can make it more appealing for patients.
Retail pharmacies hold a market share value of 27.5% during the year 2022. Retail pharmacies typically stock a wide range of painkillers, including both prescription and over-the-counter options and they are easily accessible to consumers, which makes it convenient for them to purchase painkillers.
Key market players in the painkillers market launch their products. This promotional strategy is expected to be highly impactful to enter into the market.
A few of the recent instances include
Similarly, recent developments have been tracked by the team at Future Market Insights related to companies in the Painkillers market, which are available in the full report.
Attribute | Details |
---|---|
Forecast Period | 2023 to 2033 |
Historical Data Available for | 2018 to 2022 |
Market Analysis | USD Million for Value |
Key Regions Covered | North America; Latin America; Western Europe; Eastern Europe; Russia & Belarus; Balkan & Baltic Countries; South Asia & Pacific; East Asia; Central Asia; and Middle East & Africa |
Key Countries Covered | USA, Canada, Brazil, Mexico, Argentina, United Kingdom, Germany, Italy, Spain, France, BENELUX, Nordic Countries, Poland, Hungary, Czech Republic, Romania, Russia and Belarus, Balkan & Baltic Countries, India, Thailand, Indonesia, Malaysia, Vietnam, Philippines, Japan, China, South Korea, Central Asia, Australia and New Zealand, Türkiye, GCC Countries, Kingdom of Saudi Arabia, Israel, North Africa, and South Africa |
Key Market Segments Covered | Drug Class, Product, Indication, Route of Administration, Distribution Channel, and Region |
Key Companies Profiled | AbbVie Inc. (Allergan plc); Bristol Myers Squibb Co.; Sanofi S.A.; Boehringer Ingelheim International GmbH; Pfizer Inc.; Zydus Lifesciences Ltd. (Cadila Pharmaceuticals); GSK plc.; Abbott Laboratories, Inc.; Novartis AG; Johnson & Johnson (Janssen Pharmaceuticals, Inc.); Sun Pharmaceutical Industries Ltd.; Teva Pharmaceuticals Ltd.; Mallinckrodt Pharmaceuticals; Endo Pharmaceuticals Inc.; Bayer AG; F. Hoffmann-La Roche Ltd.; Procter & Gamble; AstraZeneca; Cardinal Health; Perrigo Company Plc.; Bausch Health Companies Inc.; Viatris; Amneal Pharmaceuticals; Purdue Pharmaceuticals L.P. |
Report Coverage | Market Forecast, Competition Intelligence, DROT Analysis, Market Dynamics and Challenges, Strategic Growth Initiatives |
Pricing | Available upon Request |
Table 01: Number of Prescription in 2020 (Million) in USA, By Drug Class, Indication and Route of Administration
Table 02: Top NSAIDs Used Commonly
Table 03 : Global Market Size (US$ Million) Analysis 2018 to 2022 and Forecast 2023 to 2033, By Drug Class
Table 04: Global Market Size (US$ Million) Analysis 2018 to 2022 and Forecast 2023 to 2033, By Drug Class
Table 05: Global Market Size (US$ Million) Analysis 2018 to 2022 and Forecast 2023 to 2033, By Product
Table 06: Global Market Size (US$ Million) Analysis 2018 to 2022 and Forecast 2023 to 2033, By Product
Table 07: Global Market Size (US$ Million) Analysis 2018 to 2022 and Forecast 2023 to 2033, By Indication
Table 08: Global Market Size (US$ Million) Analysis 2018 to 2022 and Forecast 2023 to 2033, By Indication
Table 09: Global Market Size (US$ Million) Analysis 2018 to 2022 and Forecast 2023 to 2033, By Route of Administration
Table 10: Global Market Size (US$ Million) Analysis 2018 to 2022 and Forecast 2023 to 2033, By Route of Administration
Table 11: Global Market Size (US$ Million) Analysis 2018 to 2022 and Forecast 2023 to 2033, By Distribution Channel
Table 12: Global Market Size (US$ Million) Analysis 2018 to 2022 and Forecast 2023 to 2033, By Distribution Channel
Table 13: Global Market Size (US$ Million) Analysis 2018 to 2022 and Forecast 2023 to 2033, By Region
Table 14: Global Market Size (US$ Million) Analysis 2018 to 2022 and Forecast 2023 to 2033, By Region
Table 15: North America Market Size (US$ Million) Analysis 2018 to 2022 and Forecast 2023 to 2033, By Country
Table 16: North America Market Size (US$ Million) Analysis 2018 to 2022 and Forecast 2023 to 2033, By Country
Table 17: North America Market Size (US$ Million) Analysis 2018 to 2022 and Forecast 2023 to 2033, By Drug Class
Table 18: North America Market Size (US$ Million) Analysis 2018 to 2022 and Forecast 2023 to 2033, By Drug Class
Table 19: North America Market Size (US$ Million) Analysis 2018 to 2022 and Forecast 2023 to 2033, By Product
Table 20: North America Market Size (US$ Million) Analysis 2018 to 2022 and Forecast 2023 to 2033, By Product
Table 21: North America Market Size (US$ Million) Analysis 2018 to 2022 and Forecast 2023 to 2033, By Indication
Table 22: North America Market Size (US$ Million) Analysis 2018 to 2022 and Forecast 2023 to 2033, By Indication
Table 23: North America Market Size (US$ Million) Analysis 2018 to 2022 and Forecast 2023 to 2033, By Route of Administration
Table 24: North America Market Size (US$ Million) Analysis 2018 to 2022 and Forecast 2023 to 2033, By Route of Administration
Table 25: North America Market Size (US$ Million) Analysis 2018 to 2022 and Forecast 2023 to 2033, By Distribution Channel
Table 26: North America Market Size (US$ Million) Analysis 2018 to 2022 and Forecast 2023 to 2033, By Distribution Channel
Table 27: Latin America Market Size (US$ Million) Analysis 2018 to 2022 and Forecast 2023 to 2033, By Country
Table 28: Latin America Market Size (US$ Million) Analysis 2018 to 2022 and Forecast 2023 to 2033, By Country
Table 29: Latin America Market Size (US$ Million) Analysis 2018 to 2022 and Forecast 2023 to 2033, By Drug Class
Table 30: Latin America Market Size (US$ Million) Analysis 2018 to 2022 and Forecast 2023 to 2033, By Drug Class
Table 31: Latin America Market Size (US$ Million) Analysis 2018 to 2022 and Forecast 2023 to 2033, By Product
Table 32: Latin America Market Size (US$ Million) Analysis 2018 to 2022 and Forecast 2023 to 2033, By Product
Table 33: Latin America Market Size (US$ Million) Analysis 2018 to 2022 and Forecast 2023 to 2033, By Indication
Table 34: Latin America Market Size (US$ Million) Analysis 2018 to 2022 and Forecast 2023 to 2033, By Indication
Table 35: Latin America Market Size (US$ Million) Analysis 2018 to 2022 and Forecast 2023 to 2033, By Route of Administration
Table 36: Latin America Market Size (US$ Million) Analysis 2018 to 2022 and Forecast 2023 to 2033, By Route of Administration
Table 37: Latin America Market Size (US$ Million) Analysis 2018 to 2022 and Forecast 2023 to 2033, By Distribution Channel
Table 38: Latin America Market Size (US$ Million) Analysis 2018 to 2022 and Forecast 2023 to 2033, By Distribution Channel
Table 39: Western Europe Market Size (US$ Million) Analysis 2018 to 2022 and Forecast 2023 to 2033, By Country
Table 40: Western Europe Market Size (US$ Million) Analysis 2018 to 2022 and Forecast 2023 to 2033, By Country
Table 41: Western Europe Market Size (US$ Million) Analysis 2018 to 2022 and Forecast 2023 to 2033, By Drug Class
Table 42: Western Europe Market Size (US$ Million) Analysis 2018 to 2022 and Forecast 2023 to 2033, By Drug Class
Table 43: Western Europe Market Size (US$ Million) Analysis 2018 to 2022 and Forecast 2023 to 2033, By Product
Table 44: Western Europe Market Size (US$ Million) Analysis 2018 to 2022 and Forecast 2023 to 2033, By Product
Table 45: Western Europe Market Size (US$ Million) Analysis 2018 to 2022 and Forecast 2023 to 2033, By Indication
Table 46: Western Europe Market Size (US$ Million) Analysis 2018 to 2022 and Forecast 2023 to 2033, By Indication
Table 47: Western Europe Market Size (US$ Million) Analysis 2018 to 2022 and Forecast 2023 to 2033, By Route of Administration
Table 48: Western Europe Market Size (US$ Million) Analysis 2018 to 2022 and Forecast 2023 to 2033, By Route of Administration
Table 49: Western Europe Market Size (US$ Million) Analysis 2018 to 2022 and Forecast 2023 to 2033, By Distribution Channel
Table 50: Western Europe Market Size (US$ Million) Analysis 2018 to 2022 and Forecast 2023 to 2033, By Distribution Channel
Table 51: Eastern Europe Market Size (US$ Million) Analysis 2018 to 2022 and Forecast 2023 to 2033, By Country
Table 52: Eastern Europe Market Size (US$ Million) Analysis 2018 to 2022 and Forecast 2023 to 2033, By Country
Table 53: Eastern Europe Market Size (US$ Million) Analysis 2018 to 2022 and Forecast 2023 to 2033, By Drug Class
Table 54: Eastern Europe Market Size (US$ Million) Analysis 2018 to 2022 and Forecast 2023 to 2033, By Drug Class
Table 55: Eastern Europe Market Size (US$ Million) Analysis 2018 to 2022 and Forecast 2023 to 2033, By Product
Table 56: Eastern Europe Market Size (US$ Million) Analysis 2018 to 2022 and Forecast 2023 to 2033, By Product
Table 57: Eastern Europe Market Size (US$ Million) Analysis 2018 to 2022 and Forecast 2023 to 2033, By Indication
Table 58: Eastern Europe Market Size (US$ Million) Analysis 2018 to 2022 and Forecast 2023 to 2033, By Indication
Table 59: Eastern Europe Market Size (US$ Million) Analysis 2018 to 2022 and Forecast 2023 to 2033, By Route of Administration
Table 60: Eastern Europe Market Size (US$ Million) Analysis 2018 to 2022 and Forecast 2023 to 2033, By Route of Administration
Table 61: Eastern Europe Market Size (US$ Million) Analysis 2018 to 2022 and Forecast 2023 to 2033, By Distribution Channel
Table 62: Eastern Europe Market Size (US$ Million) Analysis 2018 to 2022 and Forecast 2023 to 2033, By Distribution Channel
Table 63: South Asia & Pacific Market Size (US$ Million) Analysis 2018 to 2022 and Forecast 2023 to 2033, By Country
Table 64: South Asia & Pacific Market Size (US$ Million) Analysis 2018 to 2022 and Forecast 2023 to 2033, By Country
Table 65: South Asia & Pacific Market Size (US$ Million) Analysis 2018 to 2022 and Forecast 2023 to 2033, By Drug Class
Table 66: South Asia & Pacific Market Size (US$ Million) Analysis 2018 to 2022 and Forecast 2023 to 2033, By Drug Class
Table 67: South Asia & Pacific Market Size (US$ Million) Analysis 2018 to 2022 and Forecast 2023 to 2033, By Product
Table 68: South Asia & Pacific Market Size (US$ Million) Analysis 2018 to 2022 and Forecast 2023 to 2033, By Product
Table 69: South Asia & Pacific Market Size (US$ Million) Analysis 2018 to 2022 and Forecast 2023 to 2033, By Indication
Table 70: South Asia & Pacific Market Size (US$ Million) Analysis 2018 to 2022 and Forecast 2023 to 2033, By Indication
Table 71: South Asia & Pacific Market Size (US$ Million) Analysis 2018 to 2022 and Forecast 2023 to 2033, By Route of Administration
Table 72: South Asia & Pacific Market Size (US$ Million) Analysis 2018 to 2022 and Forecast 2023 to 2033, By Route of Administration
Table 73: South Asia & Pacific Market Size (US$ Million) Analysis 2018 to 2022 and Forecast 2023 to 2033, By Distribution Channel
Table 74: South Asia & Pacific Market Size (US$ Million) Analysis 2018 to 2022 and Forecast 2023 to 2033, By Distribution Channel
Table 75: East Asia Market Size (US$ Million) Analysis 2018 to 2022 and Forecast 2023 to 2033, By Country
Table 76: East Asia Market Size (US$ Million) Analysis 2018 to 2022 and Forecast 2023 to 2033, By Country
Table 77: East Asia Market Size (US$ Million) Analysis 2018 to 2022 and Forecast 2023 to 2033, By Drug Class
Table 78: East Asia Market Size (US$ Million) Analysis 2018 to 2022 and Forecast 2023 to 2033, By Drug Class
Table 79: East Asia Market Size (US$ Million) Analysis 2018 to 2022 and Forecast 2023 to 2033, By Product
Table 80: East Asia Market Size (US$ Million) Analysis 2018 to 2022 and Forecast 2023 to 2033, By Product
Table 81: East Asia Market Size (US$ Million) Analysis 2018 to 2022 and Forecast 2023 to 2033, By Indication
Table 82: East Asia Market Size (US$ Million) Analysis 2018 to 2022 and Forecast 2023 to 2033, By Indication
Table 83: East Asia Market Size (US$ Million) Analysis 2018 to 2022 and Forecast 2023 to 2033, By Route of Administration
Table 84: East Asia Market Size (US$ Million) Analysis 2018 to 2022 and Forecast 2023 to 2033, By Route of Administration
Table 85: East Asia Market Size (US$ Million) Analysis 2018 to 2022 and Forecast 2023 to 2033, By Distribution Channel
Table 86: East Asia Market Size (US$ Million) Analysis 2018 to 2022 and Forecast 2023 to 2033, By Distribution Channel
Table 87: Central Asia Market Size (US$ Million) Analysis 2018 to 2022 and Forecast 2023 to 2033, By Drug Class
Table 88: Central Asia Market Size (US$ Million) Analysis 2018 to 2022 and Forecast 2023 to 2033, By Drug Class
Table 89: Central Asia Market Size (US$ Million) Analysis 2018 to 2022 and Forecast 2023 to 2033, By Product
Table 90: Central Asia Market Size (US$ Million) Analysis 2018 to 2022 and Forecast 2023 to 2033, By Product
Table 91: Central Asia Market Size (US$ Million) Analysis 2018 to 2022 and Forecast 2023 to 2033, By Indication
Table 92: Central Asia Market Size (US$ Million) Analysis 2018 to 2022 and Forecast 2023 to 2033, By Indication
Table 93: Central Asia Market Size (US$ Million) Analysis 2018 to 2022 and Forecast 2023 to 2033, By Route of Administration
Table 94: Central Asia Market Size (US$ Million) Analysis 2018 to 2022 and Forecast 2023 to 2033, By Route of Administration
Table 95: Central Asia Market Size (US$ Million) Analysis 2018 to 2022 and Forecast 2023 to 2033, By Distribution Channel
Table 96: Central Asia Market Size (US$ Million) Analysis 2018 to 2022 and Forecast 2023 to 2033, By Distribution Channel
Table 97: Russia & Belarus Market Size (US$ Million) Analysis 2018 to 2022 and Forecast 2023 to 2033, By Drug Class
Table 98: Russia & Belarus Market Size (US$ Million) Analysis 2018 to 2022 and Forecast 2023 to 2033, By Drug Class
Table 99: Russia & Belarus Market Size (US$ Million) Analysis 2018 to 2022 and Forecast 2023 to 2033, By Product
Table 100: Russia & Belarus Market Size (US$ Million) Analysis 2018 to 2022 and Forecast 2023 to 2033, By Product
Table 101: Russia & Belarus Market Size (US$ Million) Analysis 2018 to 2022 and Forecast 2023 to 2033, By Indication
Table 102: Russia & Belarus Market Size (US$ Million) Analysis 2018 to 2022 and Forecast 2023 to 2033, By Indication
Table 103: Russia & Belarus Market Size (US$ Million) Analysis 2018 to 2022 and Forecast 2023 to 2033, By Route of Administration
Table 104: Russia & Belarus Market Size (US$ Million) Analysis 2018 to 2022 and Forecast 2023 to 2033, By Route of Administration
Table 105: Russia & Belarus Market Size (US$ Million) Analysis 2018 to 2022 and Forecast 2023 to 2033, By Distribution Channel
Table 106: Russia & Belarus Market Size (US$ Million) Analysis 2018 to 2022 and Forecast 2023 to 2033, By Distribution Channel
Table 107: Balkan & Baltic Countries Market Size (US$ Million) Analysis 2018 to 2022 and Forecast 2023 to 2033, By Drug Class
Table 108: Balkan & Baltic Countries Market Size (US$ Million) Analysis 2018 to 2022 and Forecast 2023 to 2033, By Drug Class
Table 109: Balkan & Baltic Countries Market Size (US$ Million) Analysis 2018 to 2022 and Forecast 2023 to 2033, By Product
Table 110: Balkan & Baltic Countries Market Size (US$ Million) Analysis 2018 to 2022 and Forecast 2023 to 2033, By Product
Table 111: Balkan & Baltic Countries Market Size (US$ Million) Analysis 2018 to 2022 and Forecast 2023 to 2033, By Indication
Table 112: Balkan & Baltic Countries Market Size (US$ Million) Analysis 2018 to 2022 and Forecast 2023 to 2033, By Indication
Table 113: Balkan & Baltic Countries Market Size (US$ Million) Analysis 2018 to 2022 and Forecast 2023 to 2033, By Route of Administration
Table 114: Balkan & Baltic Countries Market Size (US$ Million) Analysis 2018 to 2022 and Forecast 2023 to 2033, By Route of Administration
Table 115: Balkan & Baltic Countries Market Size (US$ Million) Analysis 2018 to 2022 and Forecast 2023 to 2033, By Distribution Channel
Table 116: Balkan & Baltic Countries Market Size (US$ Million) Analysis 2018 to 2022 and Forecast 2023 to 2033, By Distribution Channel
Table 117: Middle East and Africa Market Size (US$ Million) Analysis 2018 to 2022 and Forecast 2023 to 2033, By Country
Table 118: Middle East and Africa Market Size (US$ Million) Analysis 2018 to 2022 and Forecast 2023 to 2033, By Country
Table 119: Middle East and Africa Market Size (US$ Million) Analysis 2018 to 2022 and Forecast 2023 to 2033, By Drug Class
Table 120: Middle East and Africa Market Size (US$ Million) Analysis 2018 to 2022 and Forecast 2023 to 2033, By Drug Class
Table 121: Middle East and Africa Market Size (US$ Million) Analysis 2018 to 2022 and Forecast 2023 to 2033, By Product
Table 122: Middle East and Africa Market Size (US$ Million) Analysis 2018 to 2022 and Forecast 2023 to 2033, By Product
Table 123: Middle East and Africa Market Size (US$ Million) Analysis 2018 to 2022 and Forecast 2023 to 2033, By Indication
Table 124: Middle East and Africa Market Size (US$ Million) Analysis 2018 to 2022 and Forecast 2023 to 2033, By Indication
Table 125: Middle East and Africa Market Size (US$ Million) Analysis 2018 to 2022 and Forecast 2023 to 2033, By Route of Administration
Table 126: Middle East and Africa Market Size (US$ Million) Analysis 2018 to 2022 and Forecast 2023 to 2033, By Route of Administration
Table 127: Middle East and Africa Market Size (US$ Million) Analysis 2018 to 2022 and Forecast 2023 to 2033, By Distribution Channel
Table 128: Middle East and Africa Market Size (US$ Million) Analysis 2018 to 2022 and Forecast 2023 to 2033, By Distribution Channel
Figure 01: Global Market Share, By Drug Class, 2023 (E)
Figure 02: Global Market Share, By Product, 2023 (E)
Figure 03: Global Market Share, By Indication, 2023 (E)
Figure 04: Global Market Share, By Route of Administration, 2023 (E)
Figure 05: Global Market Share, By Distribution Channel, 2023 (E)
Figure 06: Global Market Share, By Country, 2023 (E)
Figure 07: No. of Surgeries Performed in 2022, By Key Countries
Figure 08: Total Opioid Prescriptions Dispensed and Opioid Dispensing Rate per 100 People
Figure 09: Pipeline Development of Opioids-Abuse Deterrent Formulation by Company
Figure 10: Percentage of Individual NSAID Usage
Figure 11: NSAIDs Prescribed, By Different Indications
Figure 12: Global Market - COVID-19 Impact, 2019 to 2033
Figure 13: Global Market Value Analysis (US$ Million), 2018 to 2022
Figure 14: Global Market Value Forecast (US$ Million), 2023 to 2033
Figure 15: Global Market Absolute Market Absolute $ Opportunity, 2023 to 2033
Figure 16: Global Market Share Analysis (%), By Drug Class, 2023(E) & 2033(F)
Figure 17: Global Market Y-o-Y Analysis (%), By Drug Class, 2023 to 2033
Figure 18: Global Market Attractiveness Analysis By Drug Class, 2023 to 2033
Figure 19: Global Market Share Analysis (%), By Product, 2023(E) & 2033(F)
Figure 20: Global Market Y-o-Y Analysis (%), By Product, 2023 to 2033
Figure 21: Global Market Attractiveness Analysis By Product, 2023 to 2033
Figure 22: Global Market Share Analysis (%), By Indication, 2023(E) & 2033(F)
Figure 23: Global Market Y-o-Y Analysis (%), By Indication, 2023 to 2033
Figure 24: Global Market Attractiveness Analysis By Indication, 2023 to 2033
Figure 25: Global Market Share Analysis (%), By Route of Administration, 2023(E) & 2033(F)
Figure 26: Global Market Y-o-Y Analysis (%), By Route of Administration, 2023 to 2033
Figure 27: Global Market Attractiveness Analysis By Route of Administration, 2023 to 2033
Figure 28: Global Market Share Analysis (%), By Distribution Channel, 2023(E) & 2033(F)
Figure 29: Global Market Y-o-Y Analysis (%), By Distribution Channel, 2023 to 2033
Figure 30: Global Market Attractiveness Analysis By Distribution Channel, 2023 to 2033
Figure 31: Global Market Share Analysis (%), By Region, 2023(E) & 2033(F)
Figure 32: Global Market Y-o-Y Analysis (%), By Region, 2023 to 2033
Figure 33: Global Market Attractiveness Analysis By Region, 2023 to 2033
Figure 34: North America Market Share, By Drug Class, 2023 (E)
Figure 35: North America Market Share, By Product, 2023 (E)
Figure 36: North America Market Share, By Indication, 2023 (E)
Figure 37: North America Market Share, By Route of Administration, 2023 (E)
Figure 38: North America Market Share, By Distribution Channel, 2023 (E)
Figure 39: North America Market Share, By Country, 2023 (E)
Figure 40: North America Market Value (US$ Million) Analysis 2018 to 2022
Figure 41: North America Market Value (US$ Million) Analysis 2023 to 2033
Figure 42: North America Market Attractiveness Analysis by Drug Class, 2023 to 2033
Figure 43: North America Market Attractiveness Analysis by Product, 2023 to 2033
Figure 44: North America Market Attractiveness Analysis by Indication, 2023 to 2033
Figure 45: North America Market Attractiveness Analysis by Route of Administration, 2023 to 2033
Figure 46: North America Market Attractiveness Analysis by Distribution Channel, 2023 to 2033
Figure 47: North America Market Attractiveness Analysis by Country, 2023 to 2033
Figure 48: USA Market Share Analysis (%) by Drug Class, 2022 (A) & 2033 (F)
Figure 49: USA Market Share Analysis (%) by Product, 2022 (A) & 2033 (F)
Figure 50: USA Market Share Analysis (%) by Indication, 2022 (A) & 2033 (F)
Figure 51: USA Market Share Analysis (%) by Route of Administration, 2022 (A) & 2033 (F)
Figure 52: USA Market Share Analysis (%) by Distribution Chnanel,2022 (A) & 2033 (F)
Figure 53: Canada Market Share Analysis (%) by Drug Class, 2022 (A) & 2033 (F)
Figure 54: Canada Market Share Analysis (%) by Product, 2022 (A) & 2033 (F)
Figure 55: Canada Market Share Analysis (%) by Indication, 2022 (A) & 2033 (F)
Figure 56: Canada Market Share Analysis (%) by Route of Administration, 2022 (A) & 2033 (F)
Figure 57: Canada Market Share Analysis (%) by Distribution Chnanel,2022 (A) & 2033 (F)
Figure 58: Latin America Market Share, By Drug Class, 2023 (E)
Figure 59: Latin America Market Share, By Product, 2023 (E)
Figure 60: Latin America Market Share, By Indication, 2023 (E)
Figure 61: Latin America Market Share, By Route of Administration, 2023 (E)
Figure 62: Latin America Market Share, By Distribution Channel, 2023 (E)
Figure 63: Latin America Market Share, By Country, 2023 (E)
Figure 64: Latin America Market Value (US$ Million) Analysis 2018 to 2022
Figure 65: Latin America Market Value (US$ Million) Analysis 2023 to 2033
Figure 66: Latin America Market Attractiveness Analysis by Drug Class, 2023 to 2033
Figure 67: Latin America Market Attractiveness Analysis by Product, 2023 to 2033
Figure 68: Latin America Market Attractiveness Analysis by Indication, 2023 to 2033
Figure 69: Latin America Market Attractiveness Analysis by Route of Administration, 2023 to 2033
Figure 70: Latin America Market Attractiveness Analysis by Distribution Channel, 2023 to 2033
Figure 71: Latin America Market Attractiveness Analysis by Country, 2023 to 2033
Figure 72: Brazil Market Share Analysis (%) by Drug Class, 2022 (A) & 2033 (F)
Figure 73: Brazil Market Share Analysis (%) by Product, 2022 (A) & 2033 (F)
Figure 74: Brazil Market Share Analysis (%) by Indication, 2022 (A) & 2033 (F)
Figure 75: Brazil Market Share Analysis (%) by Route of Administration, 2022 (A) & 2033 (F)
Figure 76: Brazil Market Share Analysis (%) by Distribution Chnanel,2022 (A) & 2033 (F)
Figure 77: Mexico Market Share Analysis (%) by Drug Class, 2022 (A) & 2033 (F)
Figure 78: Mexico Market Share Analysis (%) by Product, 2022 (A) & 2033 (F)
Figure 79: Mexico Market Share Analysis (%) by Indication, 2022 (A) & 2033 (F)
Figure 80: Mexico Market Share Analysis (%) by Route of Administration, 2022 (A) & 2033 (F)
Figure 81: Mexico Market Share Analysis (%) by Distribution Chnanel,2022 (A) & 2033 (F)
Figure 82: Argentina Market Share Analysis (%) by Drug Class, 2022 (A) & 2033 (F)
Figure 83: Argentina Market Share Analysis (%) by Product, 2022 (A) & 2033 (F)
Figure 84: Argentina Market Share Analysis (%) by Indication, 2022 (A) & 2033 (F)
Figure 85: Argentina Market Share Analysis (%) by Route of Administration, 2022 (A) & 2033 (F)
Figure 86: Argentina Market Share Analysis (%) by Distribution Chnanel,2022 (A) & 2033 (F)
Figure 87: Western Europe Market Share, By Drug Class, 2023 (E)
Figure 88: Western Europe Market Share, By Product, 2023 (E)
Figure 89: Western Europe Market Share, By Indication, 2023 (E)
Figure 90: Western Europe Market Share, By Route of Administration, 2023 (E)
Figure 91: Western Europe Market Share, By Distribution Channel, 2023 (E)
Figure 92: Western Europe Market Share, By Country, 2023 (E)
Figure 93: Western Europe Market Value (US$ Million) Analysis 2018 to 2022
Figure 94: Western Europe Market Value (US$ Million) Analysis 2023 to 2033
Figure 95: Western Europe Market Attractiveness Analysis by Drug Class, 2023 to 2033
Figure 96: Western Europe Market Attractiveness Analysis by Product, 2023 to 2033
Figure 97: Western Europe Market Attractiveness Analysis by Indication, 2023 to 2033
Figure 98: Western Europe Market Attractiveness Analysis by Route of Administration, 2023 to 2033
Figure 99: Western Europe Market Attractiveness Analysis by Distribution Channel, 2023 to 2033
Figure 100: Western Europe Market Attractiveness Analysis by Country, 2023 to 2033
Figure 101: Germany Market Share Analysis (%) by Drug Class, 2022 (A) & 2033 (F)
Figure 102: Germany Market Share Analysis (%) by Product, 2022 (A) & 2033 (F)
Figure 103: Germany Market Share Analysis (%) by Indication, 2022 (A) & 2033 (F)
Figure 104: Germany Market Share Analysis (%) by Route of Administration, 2022 (A) & 2033 (F)
Figure 105: Germany Market Share Analysis (%) by Distribution Chnanel,2022 (A) & 2033 (F)
Figure 106: France Market Share Analysis (%) by Drug Class, 2022 (A) & 2033 (F)
Figure 107: France Market Share Analysis (%) by Product, 2022 (A) & 2033 (F)
Figure 108: France Market Share Analysis (%) by Indication, 2022 (A) & 2033 (F)
Figure 109: France Market Share Analysis (%) by Route of Administration, 2022 (A) & 2033 (F)
Figure 110: France Market Share Analysis (%) by Distribution Chnanel,2022 (A) & 2033 (F)
Figure 111: Spain Market Share Analysis (%) by Drug Class, 2022 (A) & 2033 (F)
Figure 112: Spain Market Share Analysis (%) by Product, 2022 (A) & 2033 (F)
Figure 113: Spain Market Share Analysis (%) by Indication, 2022 (A) & 2033 (F)
Figure 114: Spain Market Share Analysis (%) by Route of Administration, 2022 (A) & 2033 (F)
Figure 115: Spain Market Share Analysis (%) by Distribution Chnanel,2022 (A) & 2033 (F)
Figure 116: Italy Market Share Analysis (%) by Drug Class, 2022 (A) & 2033 (F)
Figure 117: Italy Market Share Analysis (%) by Product, 2022 (A) & 2033 (F)
Figure 118: Italy Market Share Analysis (%) by Indication, 2022 (A) & 2033 (F)
Figure 119: Italy Market Share Analysis (%) by Route of Administration, 2022 (A) & 2033 (F)
Figure 120: Italy Market Share Analysis (%) by Distribution Chnanel,2022 (A) & 2033 (F)
Figure 121: BENELUX Market Share Analysis (%) by Drug Class, 2022 (A) & 2033 (F)
Figure 122: BENELUX Market Share Analysis (%) by Product, 2022 (A) & 2033 (F)
Figure 123: BENELUX Market Share Analysis (%) by Indication, 2022 (A) & 2033 (F)
Figure 124: BENELUX Market Share Analysis (%) by Route of Administration, 2022 (A) & 2033 (F)
Figure 125: BENELUX Market Share Analysis (%) by Distribution Chnanel,2022 (A) & 2033 (F)
Figure 126: Nordic Countries Market Share Analysis (%) by Drug Class, 2022 (A) & 2033 (F)
Figure 127: Nordic Countries Market Share Analysis (%) by Product, 2022 (A) & 2033 (F)
Figure 128: Nordic Countries Market Share Analysis (%) by Indication, 2022 (A) & 2033 (F)
Figure 129: Nordic Countries Market Share Analysis (%) by Route of Administration, 2022 (A) & 2033 (F)
Figure 130: Nordic Countries Market Share Analysis (%) by Distribution Chnanel,2022 (A) & 2033 (F)
Figure 131: United kingdom Market Share Analysis (%) by Drug Class, 2022 (A) & 2033 (F)
Figure 132: United kingdom Market Share Analysis (%) by Product, 2022 (A) & 2033 (F)
Figure 133: United kingdom Market Share Analysis (%) by Indication, 2022 (A) & 2033 (F)
Figure 134: United kingdom Market Share Analysis (%) by Route of Administration, 2022 (A) & 2033 (F)
Figure 135: United kingdom Market Share Analysis (%) by Distribution Chnanel,2022 (A) & 2033 (F)
Figure 136: Eastern Europe Market Share, By Drug Class, 2023 (E)
Figure 137: Eastern Europe Market Share, By Product, 2023 (E)
Figure 138: Eastern Europe Market Share, By Indication, 2023 (E)
Figure 139: Eastern Europe Market Share, By Route of Administration, 2023 (E)
Figure 140: Eastern Europe Market Share, By Distribution Channel, 2023 (E)
Figure 141: Eastern Europe Market Share, By Country, 2023 (E)
Figure 142: Eastern Europe Market Value (US$ Million) Analysis 2018 to 2022
Figure 143: Eastern Europe Market Value (US$ Million) Analysis 2023 to 2033
Figure 144: Eastern Europe Market Attractiveness Analysis by Drug Class, 2023 to 2033
Figure 145: Eastern Europe Market Attractiveness Analysis by Product, 2023 to 2033
Figure 146: Eastern Europe Market Attractiveness Analysis by Indication, 2023 to 2033
Figure 147: Eastern Europe Market Attractiveness Analysis by Route of Administration, 2023 to 2033
Figure 148: Eastern Europe Market Attractiveness Analysis by Distribution Channel, 2023 to 2033
Figure 149: Eastern Europe Market Attractiveness Analysis by Country, 2023 to 2033
Figure 150: Poland Market Share Analysis (%) by Drug Class, 2022 (A) & 2033 (F)
Figure 151: Poland Market Share Analysis (%) by Product, 2022 (A) & 2033 (F)
Figure 152: Poland Market Share Analysis (%) by Indication, 2022 (A) & 2033 (F)
Figure 153: Poland Market Share Analysis (%) by Route of Administration, 2022 (A) & 2033 (F)
Figure 154: Poland Market Share Analysis (%) by Distribution Chnanel,2022 (A) & 2033 (F)
Figure 155: Hungary Market Share Analysis (%) by Drug Class, 2022 (A) & 2033 (F)
Figure 156: Hungary Market Share Analysis (%) by Product, 2022 (A) & 2033 (F)
Figure 157: Hungary Market Share Analysis (%) by Indication, 2022 (A) & 2033 (F)
Figure 158: Hungary Market Share Analysis (%) by Route of Administration, 2022 (A) & 2033 (F)
Figure 159: Hungary Market Share Analysis (%) by Distribution Chnanel,2022 (A) & 2033 (F)
Figure 160: Romania Market Share Analysis (%) by Drug Class, 2022 (A) & 2033 (F)
Figure 161: Romania Market Share Analysis (%) by Product, 2022 (A) & 2033 (F)
Figure 162: Romania Market Share Analysis (%) by Indication, 2022 (A) & 2033 (F)
Figure 163: Romania Market Share Analysis (%) by Route of Administration, 2022 (A) & 2033 (F)
Figure 164: Romania Market Share Analysis (%) by Distribution Chnanel,2022 (A) & 2033 (F)
Figure 165: Czech Republic Market Share Analysis (%) by Drug Class, 2022 (A) & 2033 (F)
Figure 166: Czech Republic Market Share Analysis (%) by Product, 2022 (A) & 2033 (F)
Figure 167: Czech Republic Market Share Analysis (%) by Indication, 2022 (A) & 2033 (F)
Figure 168: Czech Republic Market Share Analysis (%) by Route of Administration, 2022 (A) & 2033 (F)
Figure 169: Czech Republic Market Share Analysis (%) by Distribution Chnanel,2022 (A) & 2033 (F)
Figure 170: South Asia & Pacific Market Share, By Drug Class, 2023 (E)
Figure 171: South Asia & Pacific Market Share, By Product, 2023 (E)
Figure 172: South Asia & Pacific Market Share, By Indication, 2023 (E)
Figure 173: South Asia & Pacific Market Share, By Route of Administration, 2023 (E)
Figure 174: South Asia & Pacific Market Share, By Distribution Channel, 2023 (E)
Figure 175: South Asia & Pacific Market Share, By Country, 2023 (E)
Figure 176: South Asia & Pacific Market Value (US$ Million) Analysis 2018 to 2022
Figure 177: South Asia & Pacific Market Value (US$ Million) Analysis 2023 to 2033
Figure 178: South Asia & Pacific Market Attractiveness Analysis by Drug Class, 2023 to 2033
Figure 179: South Asia & Pacific Market Attractiveness Analysis by Product, 2023 to 2033
Figure 180: South Asia & Pacific Market Attractiveness Analysis by Indication, 2023 to 2033
Figure 181: South Asia & Pacific Market Attractiveness Analysis by Route of Administration, 2023 to 2033
Figure 182: South Asia & Pacific Market Attractiveness Analysis by Distribution Channel, 2023 to 2033
Figure 183: South Asia & Pacific Market Attractiveness Analysis by Country, 2023 to 2033
Figure 184: India Market Share Analysis (%) by Drug Class, 2022 (A) & 2033 (F)
Figure 185: India Market Share Analysis (%) by Product, 2022 (A) & 2033 (F)
Figure 186: India Market Share Analysis (%) by Indication, 2022 (A) & 2033 (F)
Figure 187: India Market Share Analysis (%) by Route of Administration, 2022 (A) & 2033 (F)
Figure 188: India Market Share Analysis (%) by Distribution Chnanel,2022 (A) & 2033 (F)
Figure 189: Indonesia Market Share Analysis (%) by Drug Class, 2022 (A) & 2033 (F)
Figure 190: Indonesia Market Share Analysis (%) by Product, 2022 (A) & 2033 (F)
Figure 191: Indonesia Market Share Analysis (%) by Indication, 2022 (A) & 2033 (F)
Figure 192: Indonesia Market Share Analysis (%) by Route of Administration, 2022 (A) & 2033 (F)
Figure 193: Indonesia Market Share Analysis (%) by Distribution Chnanel,2022 (A) & 2033 (F)
Figure 194: Thailand Market Share Analysis (%) by Drug Class, 2022 (A) & 2033 (F)
Figure 195: Thailand Market Share Analysis (%) by Product, 2022 (A) & 2033 (F)
Figure 196: Thailand Market Share Analysis (%) by Indication, 2022 (A) & 2033 (F)
Figure 197: Thailand Market Share Analysis (%) by Route of Administration, 2022 (A) & 2033 (F)
Figure 198: Thailand Market Share Analysis (%) by Distribution Chnanel,2022 (A) & 2033 (F)
Figure 199: Philippines Market Share Analysis (%) by Drug Class, 2022 (A) & 2033 (F)
Figure 200: Philippines Market Share Analysis (%) by Product, 2022 (A) & 2033 (F)
Figure 201: Philippines Market Share Analysis (%) by Indication, 2022 (A) & 2033 (F)
Figure 202: Philippines Market Share Analysis (%) by Route of Administration, 2022 (A) & 2033 (F)
Figure 203: Philippines Market Share Analysis (%) by Distribution Chnanel,2022 (A) & 2033 (F)
Figure 204: Malaysia Market Share Analysis (%) by Drug Class, 2022 (A) & 2033 (F)
Figure 205: Malaysia Market Share Analysis (%) by Product, 2022 (A) & 2033 (F)
Figure 206: Malaysia Market Share Analysis (%) by Indication, 2022 (A) & 2033 (F)
Figure 207: Malaysia Market Share Analysis (%) by Route of Administration, 2022 (A) & 2033 (F)
Figure 208: Malaysia Market Share Analysis (%) by Distribution Chnanel,2022 (A) & 2033 (F)
Figure 209: Vietnam Market Share Analysis (%) by Drug Class, 2022 (A) & 2033 (F)
Figure 210: Vietnam Market Share Analysis (%) by Product, 2022 (A) & 2033 (F)
Figure 211: Vietnam Market Share Analysis (%) by Indication, 2022 (A) & 2033 (F)
Figure 212: Vietnam Market Share Analysis (%) by Route of Administration, 2022 (A) & 2033 (F)
Figure 213: Vietnam Market Share Analysis (%) by Distribution Chnanel,2022 (A) & 2033 (F)
Figure 214: Australia & New Zealand Market Share Analysis (%) by Drug Class, 2022 (A) & 2033 (F)
Figure 215: Australia & New Zealand Market Share Analysis (%) by Product, 2022 (A) & 2033 (F)
Figure 216: Australia & New Zealand Market Share Analysis (%) by Indication, 2022 (A) & 2033 (F)
Figure 217: Australia & New Zealand Market Share Analysis (%) by Route of Administration, 2022 (A) & 2033 (F)
Figure 218: Australia & New Zealand Market Share Analysis (%) by Distribution Chnanel,2022 (A) & 2033 (F)
Figure 219: East Asia Market Share, By Drug Class, 2023 (E)
Figure 220: East Asia Market Share, By Product, 2023 (E)
Figure 221: East Asia Market Share, By Indication, 2023 (E)
Figure 222: East Asia Market Share, By Route of Administration, 2023 (E)
Figure 223: East Asia Market Share, By Distribution Channel, 2023 (E)
Figure 224: East Asia Market Share, By Country, 2023 (E)
Figure 225: East Asia Market Value (US$ Million) Analysis 2018 to 2022
Figure 226: East Asia Market Value (US$ Million) Analysis 2023 to 2033
Figure 227: East Asia Market Attractiveness Analysis by Drug Class, 2023 to 2033
Figure 228: East Asia Market Attractiveness Analysis by Product, 2023 to 2033
Figure 229: East Asia Market Attractiveness Analysis by Indication, 2023 to 2033
Figure 230: East Asia Market Attractiveness Analysis by Route of Administration, 2023 to 2033
Figure 231: East Asia Market Attractiveness Analysis by Distribution Channel, 2023 to 2033
Figure 232: East Asia Market Attractiveness Analysis by Country, 2023 to 2033
Figure 233: Japan Market Share Analysis (%) by Drug Class, 2022 (A) & 2033 (F)
Figure 234: Japan Market Share Analysis (%) by Product, 2022 (A) & 2033 (F)
Figure 235: Japan Market Share Analysis (%) by Indication, 2022 (A) & 2033 (F)
Figure 236: Japan Market Share Analysis (%) by Route of Administration, 2022 (A) & 2033 (F)
Figure 237: Japan Market Share Analysis (%) by Distribution Chnanel,2022 (A) & 2033 (F)
Figure 238: China Market Share Analysis (%) by Drug Class, 2022 (A) & 2033 (F)
Figure 239: China Market Share Analysis (%) by Product, 2022 (A) & 2033 (F)
Figure 240: China Market Share Analysis (%) by Indication, 2022 (A) & 2033 (F)
Figure 241: China Market Share Analysis (%) by Route of Administration, 2022 (A) & 2033 (F)
Figure 242: China Market Share Analysis (%) by Distribution Chnanel,2022 (A) & 2033 (F)
Figure 243: South Korea Market Share Analysis (%) by Drug Class, 2022 (A) & 2033 (F)
Figure 244: South Korea Market Share Analysis (%) by Product, 2022 (A) & 2033 (F)
Figure 245: South Korea Market Share Analysis (%) by Indication, 2022 (A) & 2033 (F)
Figure 246: South Korea Market Share Analysis (%) by Route of Administration, 2022 (A) & 2033 (F)
Figure 247: South Korea Market Share Analysis (%) by Distribution Chnanel,2022 (A) & 2033 (F)
Figure 248: Central Asia Market Share, By Drug Class, 2023 (E)
Figure 249: Central Asia Market Share, By Product, 2023 (E)
Figure 250: Central Asia Market Share, By Indication, 2023 (E)
Figure 251: Central Asia Market Share, By Route of Administration, 2023 (E)
Figure 252: Central Asia Market Share, By Distribution Channel, 2023 (E)
Figure 253: Central Asia Market Value (US$ Million) Analysis 2018 to 2022
Figure 254: Central Asia Market Value (US$ Million) Analysis 2023 to 2033
Figure 255: Central Asia Market Attractiveness Analysis by Drug Class, 2023 to 2033
Figure 256: Central Asia Market Attractiveness Analysis by Product, 2023 to 2033
Figure 257: Central Asia Market Attractiveness Analysis by Indication, 2023 to 2033
Figure 258: Central Asia Market Attractiveness Analysis by Route of Administration, 2023 to 2033
Figure 259: Central Asia Market Attractiveness Analysis by Distribution Channel, 2023 to 2033
Figure 260: Russia & Belarus Market Share, By Drug Class, 2023 (E)
Figure 261: Russia & Belarus Market Share, By Product, 2023 (E)
Figure 262: Russia & Belarus Market Share, By Indication, 2023 (E)
Figure 263: Russia & Belarus Market Share, By Route of Administration, 2023 (E)
Figure 264: Russia & Belarus Market Share, By Distribution Channel, 2023 (E)
Figure 265: Russia & Belarus Market Value (US$ Million) Analysis 2018 to 2022
Figure 266: Russia & Belarus Market Value (US$ Million) Analysis 2023 to 2033
Figure 267: Russia & Belarus Market Attractiveness Analysis by Drug Class, 2023 to 2033
Figure 268: Russia & Belarus Market Attractiveness Analysis by Product, 2023 to 2033
Figure 269: Russia & Belarus Market Attractiveness Analysis by Indication, 2023 to 2033
Figure 270: Russia & Belarus Market Attractiveness Analysis by Route of Administration, 2023 to 2033
Figure 271: Russia & Belarus Market Attractiveness Analysis by Distribution Channel, 2023 to 2033
Figure 272: Balkan & Baltic Countries Market Share, By Drug Class, 2023 (E)
Figure 273: Balkan & Baltic Countries Market Share, By Product, 2023 (E)
Figure 274: Balkan & Baltic Countries Market Share, By Indication, 2023 (E)
Figure 275: Balkan & Baltic Countries Market Share, By Route of Administration, 2023 (E)
Figure 276: Balkan & Baltic Countries Market Share, By Distribution Channel, 2023 (E)
Figure 277: Balkan & Baltic Countries Market Value (US$ Million) Analysis 2018 to 2022
Figure 278: Balkan & Baltic Countries Market Value (US$ Million) Analysis 2023 to 2033
Figure 279: Balkan & Baltic Countries Market Attractiveness Analysis by Drug Class, 2023 to 2033
Figure 280: Balkan & Baltic Countries Market Attractiveness Analysis by Product, 2023 to 2033
Figure 281: Balkan & Baltic Countries Market Attractiveness Analysis by Indication, 2023 to 2033
Figure 282: Balkan & Baltic Countries Market Attractiveness Analysis by Route of Administration, 2023 to 2033
Figure 283: Balkan & Baltic Countries Market Attractiveness Analysis by Distribution Channel, 2023 to 2033
Figure 284: Middle East and Africa Market Share, By Drug Class, 2023 (E)
Figure 285: Middle East and Africa Market Share, By Product, 2023 (E)
Figure 286: Middle East and Africa Market Share, By Indication, 2023 (E)
Figure 287: Middle East and Africa Market Share, By Route of Administration, 2023 (E)
Figure 288: Middle East and Africa Market Share, By Distribution Channel, 2023 (E)
Figure 289: Middle East and Africa Market Share, By Country, 2023 (E)
Figure 290: Middle East and Africa Market Value (US$ Million) Analysis 2018 to 2022
Figure 291: Middle East and Africa Market Value (US$ Million) Analysis 2023 to 2033
Figure 292: Middle East and Africa Market Attractiveness Analysis by Drug Class, 2023 to 2033
Figure 293: Middle East and Africa Market Attractiveness Analysis by Product, 2023 to 2033
Figure 294: Middle East and Africa Market Attractiveness Analysis by Indication, 2023 to 2033
Figure 295: Middle East and Africa Market Attractiveness Analysis by Route of Administration, 2023 to 2033
Figure 296: Middle East and Africa Market Attractiveness Analysis by Distribution Channel, 2023 to 2033
Figure 297: Middle East and Africa Market Attractiveness Analysis by Country, 2023 to 2033
Figure 298: GCC Countries Market Share Analysis (%) by Drug Class, 2022 (A) & 2033 (F)
Figure 299: GCC Countries Market Share Analysis (%) by Product, 2022 (A) & 2033 (F)
Figure 300: GCC Countries Market Share Analysis (%) by Indication, 2022 (A) & 2033 (F)
Figure 301: GCC Countries Market Share Analysis (%) by Route of Administration, 2022 (A) & 2033 (F)
Figure 302: GCC Countries Market Share Analysis (%) by Distribution Chnanel,2022 (A) & 2033 (F)
Figure 303: Kingdom of Saudi Arabia Market Share Analysis (%) by Drug Class, 2022 (A) & 2033 (F)
Figure 304: Kingdom of Saudi Arabia Market Share Analysis (%) by Product, 2022 (A) & 2033 (F)
Figure 305: Kingdom of Saudi Arabia Market Share Analysis (%) by Indication, 2022 (A) & 2033 (F)
Figure 306: Kingdom of Saudi Arabia Market Share Analysis (%) by Route of Administration, 2022 (A) & 2033 (F)
Figure 307: Kingdom of Saudi Arabia Market Share Analysis (%) by Distribution Chnanel,2022 (A) & 2033 (F)
Figure 308: Türkiye Market Share Analysis (%) by Drug Class, 2022 (A) & 2033 (F)
Figure 309: Türkiye Market Share Analysis (%) by Product, 2022 (A) & 2033 (F)
Figure 310: Türkiye Market Share Analysis (%) by Indication, 2022 (A) & 2033 (F)
Figure 311: Türkiye Market Share Analysis (%) by Route of Administration, 2022 (A) & 2033 (F)
Figure 312: Türkiye Market Share Analysis (%) by Distribution Chnanel,2022 (A) & 2033 (F)
Figure 313: Northern Africa Market Share Analysis (%) by Drug Class, 2022 (A) & 2033 (F)
Figure 314: Northern Africa Market Share Analysis (%) by Product, 2022 (A) & 2033 (F)
Figure 315: Northern Africa Market Share Analysis (%) by Indication, 2022 (A) & 2033 (F)
Figure 316: Northern Africa Market Share Analysis (%) by Route of Administration, 2022 (A) & 2033 (F)
Figure 317: Northern Africa Market Share Analysis (%) by Distribution Chnanel,2022 (A) & 2033 (F)
Figure 318: South Africa Market Share Analysis (%) by Drug Class, 2022 (A) & 2033 (F)
Figure 319: South Africa Market Share Analysis (%) by Product, 2022 (A) & 2033 (F)
Figure 320: South Africa Market Share Analysis (%) by Indication, 2022 (A) & 2033 (F)
Figure 321: South Africa Market Share Analysis (%) by Route of Administration, 2022 (A) & 2033 (F)
Figure 322: South Africa Market Share Analysis (%) by Distribution Chnanel,2022 (A) & 2033 (F)
Figure 323: Israel Market Share Analysis (%) by Drug Class, 2022 (A) & 2033 (F)
Figure 324: Israel Market Share Analysis (%) by Product, 2022 (A) & 2033 (F)
Figure 325: Israel Market Share Analysis (%) by Indication, 2022 (A) & 2033 (F)
Figure 326: Israel Market Share Analysis (%) by Route of Administration, 2022 (A) & 2033 (F)
Figure 327: Israel Market Share Analysis (%) by Distribution Chnanel,2022 (A) & 2033 (F)
Figure 328: Key Developments, By Type of Development
Figure 329: Key Developments, By Year
The painkillers market is expected to reach a valuation of at USD 70.0 billion in 2023.
AbbVie Inc. (Allergan plc), Bristol Myers Squibb Co., Sanofi S.A., are leading painkillers industry players.
Opioids are the key segment by drug class in the worldwide painkillers market.
Over the historical period, from 2018 to 2022, the painkillers market registered a 2.9% CAGR.
North America painkillers market is expected to hold a 92.2% share in 2023.
Thank you!
You will receive an email from our Business Development Manager. Please be sure to check your SPAM/JUNK folder too.