
- Market Size (2026)
- USD 335.8 Mn
- Forecast (2036)
- USD 573.6 Mn
- CAGR (2026 to 2036)
- 5.5%
How big is the Phenylethyl Market in 2026?
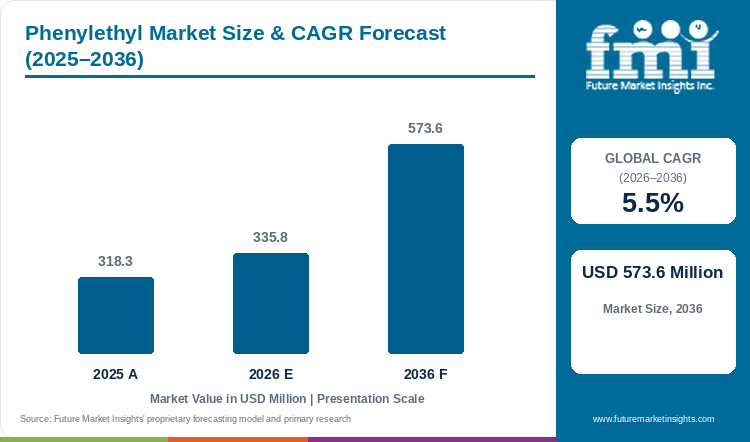
The global phenylethyl alcohol market is estimated at USD 335.8 million in 2026, compared with USD 318.3 million in 2025, and is forecast to reach USD 573.6 million by 2036, expanding at a CAGR of 5.5% from 2026 to 2036.
Demand for phenylethyl alcohol is driven by fragrance compositions and is expanding with new perfume capacity in Europe, Asia and North America. Fragrance houses are adding production and logistics capacity, and the market is expected to grow at a mid-single-digit rate through 2036. For instance, L'Oréal reports that it invested more than EUR 60 million (USD 69 million) in its Gauchy plant in France in 2025, doubling production capacity. Likewise, in September 2025 Givaudan broke ground on a fragrance facility in Guangzhou, China, that will include an automated production site and a creative centre. Perfume capacity adds demand for the alcohol only where a formula specifies it, so these investments show direction and not volume.
Purification is a second driver. Harmony Organics reports installed phenyl ethyl alcohol capacity of 12,000 tonnes a year. It has also invested in high-vacuum distillation columns at its Kurkumbh plant to remove trace impurities and meet olfactory quality requirements. As a result, separation capacity competes alongside production volume for fragrance customers. According to FMI analysis, suppliers able to repeat the required aroma profile across bulk deliveries are better placed to retain orders for established compositions.
Market Size & Forecast
Table 1: Phenylethyl Alcohol Market Size and Forecast (USD million and CAGR percentage), 2025 to 2036
| Market size and forecast | Value |
|---|---|
| 2025 Value | USD 318.3 million |
| Estimated market size in 2026 | USD 335.8 million |
| Projected market size by 2036 | USD 573.6 million |
| CAGR (2026-2036) | 5.5% |
| Added revenue, 2026 to 2036 | USD 237.8 million |
Key Market Trends & Insights
- Chemical synthesis is estimated to account for 87.1% of phenylethyl alcohol demand by product type in 2026, so the buying decision is mostly about an established supplier's finished quality and not about the route.
- Fragrance compositions are expected to hold 62.7% of demand by application in 2026, which ties volume to the formulas that stay in production.
- Perfume output is being expanded. L'Oréal invested more than EUR 60 million (USD 69 million) in its Gauchy plant in 2025 and doubled capacity, which supports repeat orders for formulas that contain the alcohol.
- Purification is part of the offer. Harmony Organics reports 12,000 tonnes of annual capacity and investment in high-vacuum distillation to remove trace impurities, which helps it hold the aroma quality that recurring fragrance orders require.
- Prompt replenishment is a selling point. Belle Aire Creations announced a 27,400-square-foot warehouse expansion in Illinois in October 2025, including raw material testing, to keep lead times at four to five business days, which favors ingredient suppliers that can restock approved material quickly.
- Logistics investment follows production. Symrise began an approximately EUR 25 million (USD 29 million) logistics expansion at Holzminden in May 2026, with completion planned for March 2028, which raises the value of dependable replenishment for aroma ingredients.
Regional Highlights
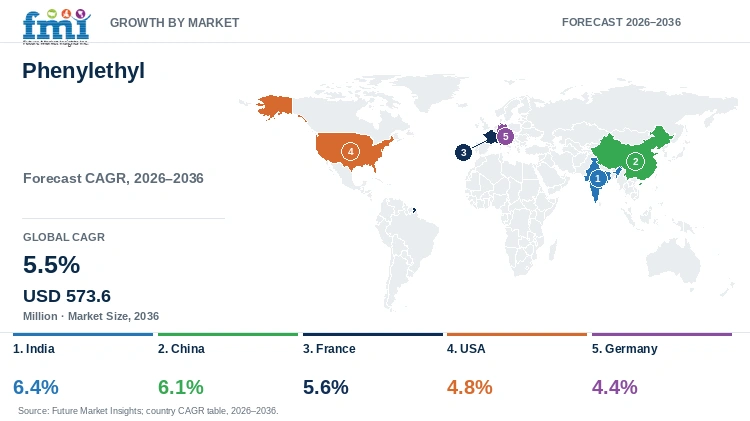
- India is likely to grow at a 6.4% CAGR during the forecast period, followed by China at 6.1%, France at 5.6%, the USA at 4.8% and Germany at 4.4%.
Analyst Perspective
“Phenylethyl alcohol suppliers gain repeat business when the purified ingredient reproduces the odor accepted for a fragrance formula. Fragrance houses assessing a new production route will need evidence for the origin claim alongside an ingredient that performs consistently in their composition.”
- Nikhil Kaitwade, Principal Consultant, FMI
How is the Phenylethyl Market segmented?
The Phenylethyl Market is segmented by product type, application and region.
- By Product Type: Chemical Synthesis, Biotechnological Production and Natural Extraction.
- By Application: Fragrance Compositions, Direct Personal Care Formulation, Flavoring Uses, Industrial Synthesis and Others.
- By Region: North America, Latin America, Western Europe, Eastern Europe, East Asia, South Asia and Pacific, and Middle East and Africa.
Why is Chemical Synthesis the Leading Product Type in the Phenylethyl Market?
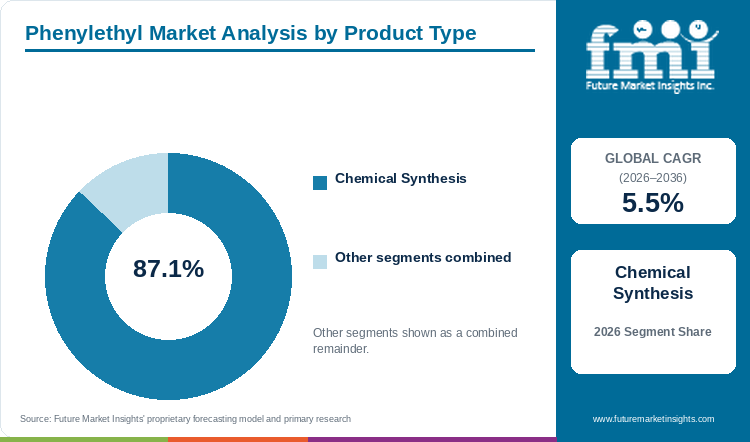
Chemical synthesis accounts for an estimated 87.1% of phenylethyl alcohol demand by product type in 2026, equal to about USD 292.5 million, as per FMI's analysis.
Table 2: Product Type Share for the Phenylethyl Market (percentage share of revenue), 2026
| Segment | Share (2026) |
|---|---|
| Chemical synthesis | 87.1% |
| Other segments combined | 12.9% |
Harmony Organics describes a transition to a styrene-based route in its manufacturing overview and reports 12,000 tonnes of installed annual phenyl ethyl alcohol capacity. That gives an industrial customer a route and a capacity against which to assess a current supply offer.
However, the name of the chemical does not settle whether two sources will smell the same in a fragrance. Trace constituents can change the result even when the main assay is acceptable, and a route grouping alone gives no eligibility for a natural-origin claim in every destination market. Biotechnological production and natural extraction share the remaining 12.9% of product-type demand.
Producers best placed to hold this share maintain the odor profile the customer has accepted while keeping the production route and finished material quality clear. A new route has to compete on the alcohol delivered after purification as well as on the claim attached to its origin.
Why are Fragrance Compositions the Leading Application in the Phenylethyl Market?
Fragrance compositions are estimated to hold 62.7% of phenylethyl alcohol demand by application in 2026, equal to about USD 210.5 million, as per FMI's analysis.
Table 3: Application Share for the Phenylethyl Market (percentage share of revenue), 2026
| Segment | Share (2026) |
|---|---|
| Fragrance compositions | 62.7% |
| Other segments combined | 37.3% |
An approved composition creates repeat purchases for as long as it stays in a commercial product line, and the producer then has to preserve the contribution of the accepted ingredient through later batches. The ingredient's effect depends on the other materials and the level used in the complete formula.
However, the main chemical assay may not reveal a small unwanted odor. A customer can compare proposed material with a retained sensory standard and test it in the intended formula, and the 2026 Candida sorboxylosa study includes a comparison of recovered alcohol with commercial sensory standards, which shows why evaluation stays relevant when the route changes.
Suppliers best placed provide the accepted material consistently and explain changes that could affect the customer's sensory comparison.
What are the Key Drivers, Restraints and Opportunities in the Phenylethyl Market?
The phenylethyl alcohol market is expected to grow from USD 335.8 million in 2026 to USD 573.6 million by 2036, which adds USD 237.8 million over the forecast period. Continuing use in fragrance formulas supports demand, while sensory acceptance and the cost of alternative processes constrain the choice of supply, and production improvements and documented origin offers create the opportunities.
Driver: continuing fragrance formulas. A fragrance producer with an established product line needs an ingredient that preserves the result of its formula, which links repeat demand to a specific use of the alcohol. Growth in scented products alone does not guarantee that every aroma chemical will be used more, and the clearest demand comes from formulas that keep consuming the ingredient.
Restraint: recovery and ingredient acceptance. The 2025 process-design study considers removal of the alcohol during fermentation and the steps needed to recover it. The product has to be separated from its medium and delivered at the required quality, energy and solvent needs can change the commercial result, and a sensory difference can keep a technically successful product out of an existing formula.
Opportunity: an origin offer the customer can use. Some buyers seek an ingredient made by a particular route. The 2026 study adds experimental production evidence and compares the recovered alcohol with commercial standards, so the opportunity depends on evidence for the sourcing claim and on a finished ingredient that performs as intended.
Producers that turn production improvements into repeatable, usable alcohol are best placed to compete for the USD 237.8 million added between 2026 and 2036.
How do Chemical Identity, Intended Use and Origin Claims Influence Demand?
These requirements affect the suitability of a supply offer more than they create additional demand. The substance identity, the use for which it is sold and the evidence behind an origin claim answer different questions.
Chemical identity defines the substance being bought
The FDA identifies phenethyl alcohol under CAS 60-12-8. The market covers this parent alcohol, also called phenylethyl alcohol or 2-phenylethanol, and excludes phenylethylamine and separately sold esters or derivatives. The boundary matters because similar names can otherwise bring different products into the same purchasing discussion.
Intended use determines whether the offer is suitable
The FDA's entry lists the alcohol's flavoring role and its regulatory reference. The entry is not approval for every possible application of a product sold under the chemical name, and a laboratory catalog specification and a commercial flavor ingredient specification serve different orders. Suppliers need to make the intended use and the relevant product documentation clear.
Origin claims need evidence of the actual route
Chemical synthesis, biotechnological production and natural extraction are production-route groups in this report. Fermentation does not automatically justify an unspecified natural designation, so a supplier must support the particular claim and the requirements of its destination market while still meeting the customer's sensory and chemical specification.
These distinctions keep an ingredient sale within its proper application. A supplier that gives a fragrance customer the expected aroma, or a flavor buyer a suitable documented ingredient, has a stronger offer than one that relies on the chemical name or an unsupported origin description.
What Technical and Operational Constraints Affect Phenylethyl Alcohol Supply?
Biological production has to work through recovery and ingredient evaluation before it can be assessed as a commercial source, and improvement at one stage does not show the performance of the full process.
The first constraint is the production environment. The 2025 study examines removal of the alcohol during fermentation as part of a conceptual system that also includes recovery and purification, so a fermentation result has to be read with the process conditions that produced it.
The second is recovery. A measured concentration in the production medium is different from a purified ingredient ready for sale. The batch study published in February 2026 reports approximately 4.7 grams per liter under its experimental conditions, and that figure is research evidence, not an industrial output rate or installed capacity.
The third is the finished aroma. Purification has to deliver the material the customer expects in a complete formula. The comparison with commercial sensory standards in the 2026 study is relevant to this step, but it does not show repeat commercial supply for every intended use.
The fourth is scale and cost. Energy, solvents, purification and repeated batches decide whether a biological route can deliver a usable ingredient at a workable price. A conceptual large-scale design helps assess these questions but does not confirm that a plant has been commissioned.
Established capacity and experimental progress carry different weight. Harmony Organics' stated capacity identifies an industrial manufacturing position, while the two research papers address process development, and a new source becomes commercially useful when the complete process delivers repeat quality in the quantities required.
Where are the Commercial Opportunities for Phenylethyl Alcohol Suppliers?
The opportunities lie in retaining an accepted fragrance ingredient, improving the complete production process and serving distinct applications with a suitable product offer.
The first is formula continuity. An approved material used in a continuing fragrance line supports repeat orders, and suppliers can hold that business by maintaining the accepted odor profile and making material changes clear before the customer compares a new batch with its reference.
The second is biological production with recovery. The 2025 design work examines these stages together, and the 2026 study adds batch production and sensory evidence. The commercial opportunity lies in converting those results into a supply offer with repeat finished quality, since a sourcing preference is useful only when the recovered ingredient works in the intended formula.
The third is the range of buying channels. Bulk aroma ingredient procurement, direct personal care formulation, flavoring use, industrial synthesis and laboratory evaluation need different product specifications and quantities. Suppliers serve them better by stating the intended use and qualification clearly than by assuming that a catalog listing and an industrial ingredient offer are equivalent.
Phenylethyl Market by Country (2026 to 2036)
Table 4: Country Growth Outlook for the Phenylethyl Market (CAGR percentage), 2026 to 2036
| Country | CAGR (2026-2036) |
|---|---|
| India | 6.4% |
| China | 6.1% |
| France | 5.6% |
| USA | 4.8% |
| Germany | 4.4% |
What is supporting phenylethyl alcohol demand in India?
India is likely to grow at a 6.4% CAGR during the forecast period, the highest rate among the countries analysed.
Harmony Organics operates a six-acre manufacturing site at Kurkumbh in Maharashtra with 12,000 tonnes of annual phenyl ethyl alcohol capacity. An established base for domestic and export orders is an advantage for Indian producers. The disadvantage is that the alternative route is still at research stage, since the 2026 fermentation study, which has Indian academic and industrial affiliations, explores a different way of making the alcohol and does not serve current orders.
The outlook combines an established aroma ingredient offer with work to improve how the alcohol is produced and recovered, and chemical manufacturing remains the part that supplies orders today.
What supports the formulated-product opportunity in China?
China is likely to grow at a 6.1% CAGR during the forecast period.
Givaudan's Guangzhou facility, begun in September 2025, will add automated production and a creative centre. Local fragrance production is an advantage, because it creates formula approvals for local supply. The disadvantage is that a high assay cannot settle the sensory comparison, and biological routes, which may add choices, still face the recovery questions examined in the 2025 study.
The outlook follows the use of the alcohol in fragrance compositions and direct personal care formulation, and suppliers that deliver a usable scent contribution and keep the parent alcohol's identity clear are best placed to serve it.
What is driving phenylethyl alcohol demand in France?
France is likely to grow at a 5.6% CAGR during the forecast period.
L'Oréal reports investment of more than EUR 60 million (USD 69 million) in its Gauchy plant in 2025, doubling production capacity. Higher perfume output is an advantage, because it supports replenishment of the alcohol in the compositions that use it. The disadvantage is that a perfumer considering a different source has to test the sensory result in its formula, and a documented route does not replace the need for the expected result in the finished fragrance.
Growth is expected to centre on fragrance composition work, where the alcohol is assessed alongside other ingredients and at the concentration the formula requires.
How does intended use shape phenylethyl alcohol demand in the USA?
The USA is expected to grow at a 4.8% CAGR during the forecast period.
Belle Aire Creations announced its 27,400-square-foot Porter East expansion in Illinois in October 2025, with material storage and raw material testing to support short fragrance delivery times. Prompt replenishment and batch approval at the manufacturer are an advantage for suppliers that can meet them. The disadvantage is that the FDA's entry references the alcohol's flavoring role, and a laboratory product listing does not show that an offer suits a commercial flavor order.
Fragrance and flavoring channels share the same parent chemical, so suppliers need to match each product's specification and documents to the proposed use while keeping the sensory quality fragrance buyers require.
What can Germany gain from production and recovery work?
Germany is projected to grow at a 4.4% CAGR during the forecast period, the lowest rate among the countries analysed.
Symrise began an approximately EUR 25 million (USD 29 million) logistics expansion at Holzminden in May 2026, with completion planned for March 2028, and the project is built around deliveries timed to production. That reinforces the value of dependable replenishment for aroma ingredients, which is an advantage. The disadvantage is that alternative production is assessed only on paper: the 2025 study considers fermentation, removal and purification within a conceptual system, and it does not show an operating German plant or commercial capacity.
The opportunity lies in technical progress that produces an acceptable ingredient consistently, with recovery and finished quality considered alongside the fermentation step.
Who are the notable companies in the Phenylethyl Market?
The companies differ by supply role. Industrial manufacturing, aroma ingredient offers and chemical catalog products serve customers with different order sizes and specifications, and participation does not imply a ranking by phenylethyl alcohol revenue.
Harmony Organics has a directly documented manufacturing offer with installed annual capacity of 12,000 tonnes of phenyl ethyl alcohol. Eternis Fine Chemicals publishes a technical specification for the alcohol for perfumery and flavor uses, and Treatt lists it in its aroma chemical portfolio. These records identify an ingredient offer but do not show equivalent production capacity across the companies.
Merck and Thermo Fisher Scientific sell identifiable chemical catalog products, so the specification, intended use and regional terms have to be checked for the order in question. A fragrance manufacturer buying regular bulk volumes needs a different supply arrangement from a laboratory evaluating a small sample.
Companies compete on the alcohol they can deliver for a defined use. Evidence of manufacturing, a sensory specification and a catalog listing each have value, but they establish different parts of that offer.
Key Developments in the Phenylethyl Market
- On 21 May 2026, Symrise began the second phase of construction of its logistics center in Holzminden, an approximately EUR 25 million (USD 29 million) project with completion planned for March 2028.
- In February 2026, research on Candida sorboxylosa reported batch production of approximately 4.7 grams per liter and compared the recovered alcohol with commercial sensory standards; the result is experimental evidence for a biological route.
- On 13 October 2025, Belle Aire Creations announced a 27,400-square-foot warehouse expansion in Illinois that includes raw material testing.
- On 29 September 2025, Givaudan broke ground on a fragrance facility in Guangzhou with an automated production site and a creative centre.
- In 2025, Delft researchers published conceptual designs for large-scale de novo 2-phenylethanol production that combine fermentation with product recovery and purification; the work does not report a commissioned plant.
Key Players in the Phenylethyl Market
- Harmony Organics
- Eternis Fine Chemicals
- Treatt
- Merck
- Thermo Fisher Scientific
Phenylethyl Market Report Scope
Table 5: Report Scope for the Phenylethyl Market (coverage fields and definitions), 2026 to 2036
| Coverage Field | Report Scope |
|---|---|
| Market Breakdown | Product Type (Chemical Synthesis, Biotechnological Production, Natural Extraction); Application (Fragrance Compositions, Direct Personal Care Formulation, Flavoring Uses, Industrial Synthesis, Others) |
| Quantitative Units | Revenue in USD million and CAGR from 2026 to 2036 |
| Market Definition | Phenylethyl alcohol, CAS 60-12-8, also called phenethyl alcohol or 2-phenylethanol. It excludes phenylethylamine, separately sold esters and derivatives, finished fragrance composition revenue and unsupported direct medical claims. |
| Regions Covered | North America, Latin America, Western Europe, Eastern Europe, East Asia, South Asia and Pacific, Middle East and Africa |
| Countries Covered | India, China, France, USA and Germany |
| Key Companies Covered | Harmony Organics, Eternis Fine Chemicals, Treatt, Merck and Thermo Fisher Scientific |
| Forecast Period | 2026 to 2036 (with 2025 historical baseline) |
| Approach | Combined primary interviews, secondary literature analysis, and top-down data triangulation |
Phenylethyl Market - Research Methodology
The market assessment combines primary interviews with industry participants and secondary research drawn from company disclosures, trade data and industry publications. Market size is built from supply-side and demand-side estimates and validated top-down, and segment shares and competitive positioning are checked through data triangulation before publication.
Phenylethyl Market by Segments
By Product Type
- Chemical Synthesis
- Biotechnological Production
- Natural Extraction
By Application
- Fragrance Compositions
- Direct Personal Care Formulation
- Flavoring Uses
- Industrial Synthesis
- Others
By Region
- North America
- United States
- Canada
- Latin America
- Brazil
- Mexico
- Argentina
- Chile
- Western Europe
- Germany
- France
- United Kingdom
- Italy
- Spain
- Benelux
- Nordics
- Eastern Europe
- Poland
- Czech Republic
- Romania
- Hungary
- East Asia
- China
- Japan
- South Korea
- South Asia and Pacific
- India
- ASEAN
- Australia and New Zealand
- Middle East and Africa
- GCC Countries
- South Africa
- Turkiye
- Israel
Research Sources and Bibliography
- [1] L'Oréal. Operations: driving value chain excellence, 2025 Annual Report. 2026.
- [2] Givaudan. Givaudan breaks ground on new state-of-the-art Fragrance & Beauty facility in Guangzhou, China. 29 September 2025.
- [3] Harmony Organics. Phenyl Ethyl Alcohol (company web page). n.d.
- [4] Harmony Organics. Facility (company web page). n.d.
- [5] Belle Aire Creations. Belle Aire Creations Announces Expansion with Porter East Facility. 13 October 2025.
- [6] Symrise. Symrise breaks ground on the second phase of construction for its logistics center in Holzminden. 21 May 2026.
- [7] Chellapan Sundaram S. P., Gunasekaran A., Chandran C. H., Gopal N. S. and Suchithra T. V. Systematic process optimization for enhanced biosynthesis of 2-phenylethanol using Candida sorboxylosa. February 2026.
- [8] Jankovic T., Fecker T., Daran J.-M., Straathof A. J. J. and Kiss A. A. Advanced process design for large-scale de-novo 2-phenylethanol production via fermentation. 2025.
- [9] U.S. Food and Drug Administration. Substances Added to Food: Phenethyl Alcohol (database entry). 2026.
Table of Content
- Key Takeaways
- Market Size and CAGR
- Top Growth Driver
- Fastest Growing Segment
- Leading Region
- Key Companies
- Emerging Opportunities
- Executive Summary
- Global Market Outlook
- Demand-side Trends
- Supply-side Trends
- Technology Roadmap Analysis
- Analysis and Recommendations
- Analyst Perspective (What is happening? Why now? What should investors know?)
- Key Questions Answered
- How large is the market?
- What is the CAGR?
- What are key trends?
- Which region dominates?
- Who are the leaders?
Read More...
- Market Overview
- Market Coverage / Taxonomy
- Market Definition / Scope / Limitations
- Research Methodology
- Chapter Orientation
- Analytical Lens and Working Hypotheses
- Market Structure, Signals, and Trend Drivers
- Benchmarking and Cross-market Comparability
- Market Sizing, Forecasting, and Opportunity Mapping
- Research Design and Evidence Framework
- Desk Research Programme (Secondary Evidence)
- Expert Input and Fieldwork (Primary Evidence)
- Tooling, Models, and Reference Databases
- Data Engineering and Model Build
- Quality Assurance and Audit Trail
- Market Background
- Market Dynamics (Drivers, Restraints, Opportunity, Trends)
- Scenario Forecast (Optimistic, Likely, Conservative)
- Impact Analysis
- AI Impact
- Sustainability Impact
- Regulatory Impact
- Technology Impact
- Consumer / Buyer Analysis
- Purchase Drivers
- Adoption Barriers
- Buyer Journey
- Opportunity Map Analysis
- Product Life Cycle Analysis
- Supply Chain Analysis
- Investment Feasibility Matrix
- Value Chain Analysis
- PESTLE and Porter's Analysis
- Regulatory Landscape
- Regional Parent Market Outlook
- Production and Consumption Statistics
- Import and Export Statistics
- Global Market Analysis and Forecast, 2021 to 2036
- Historical Market Size Value (USD Million) Analysis, 2021 to 2025
- Current and Future Market Size Value (USD Million) Projections, 2026 to 2036
- Y-o-Y Growth Trend Analysis
- Absolute $ Opportunity Analysis
- Global Market Pricing Analysis, 2021 to 2036
- Global Market Analysis and Forecast, By Product Type, 2021 to 2036
- Introduction / Key Findings
- Historical Market Size Value (USD Million) Analysis By Product Type, 2021 to 2025
- Current and Future Market Size Value (USD Million) Analysis and Forecast By Product Type, 2026 to 2036
- Chemical Synthesis
- Biotechnological Production
- Natural Extraction
- Y-o-Y Growth Trend Analysis By Product Type, 2021 to 2025
- Absolute $ Opportunity Analysis By Product Type, 2026 to 2036
- Global Market Analysis and Forecast, By Application, 2021 to 2036
- Introduction / Key Findings
- Historical Market Size Value (USD Million) Analysis By Application, 2021 to 2025
- Current and Future Market Size Value (USD Million) Analysis and Forecast By Application, 2026 to 2036
- Fragrance Compositions
- Direct Personal Care Formulation
- Flavoring Uses
- Industrial Synthesis
- Others
- Y-o-Y Growth Trend Analysis By Application, 2021 to 2025
- Absolute $ Opportunity Analysis By Application, 2026 to 2036
- Global Market Analysis and Forecast, By Region, 2021 to 2036
- Introduction
- Historical Market Size Value (USD Million) Analysis By Region, 2021 to 2025
- Current Market Size Value (USD Million) Analysis and Forecast By Region, 2026 to 2036
- North America
- Latin America
- Western Europe
- Eastern Europe
- East Asia
- South Asia and Pacific
- Middle East and Africa
- Market Attractiveness Analysis By Region
- North America Market Analysis and Forecast, By Country, 2021 to 2036
- Historical Market Size Value (USD Million) Trend Analysis By Market Taxonomy, 2021 to 2025
- Market Size Value (USD Million) Forecast By Market Taxonomy, 2026 to 2036
- By Country
- United States
- Canada
- By Product Type
- By Application
- By Country
- Market Attractiveness Analysis
- By Country
- By Product Type
- By Application
- Key Takeaways
- Latin America Market Analysis and Forecast, By Country
- Historical Market Size Value (USD Million) Trend Analysis By Market Taxonomy, 2021 to 2025
- Market Size Value (USD Million) Forecast By Market Taxonomy, 2026 to 2036
- By Country
- Brazil
- Mexico
- Argentina
- Chile
- By Product Type
- By Application
- By Country
- Market Attractiveness Analysis
- By Country
- By Product Type
- By Application
- Key Takeaways
- Western Europe Market Analysis and Forecast, By Country
- Historical Market Size Value (USD Million) Trend Analysis By Market Taxonomy, 2021 to 2025
- Market Size Value (USD Million) Forecast By Market Taxonomy, 2026 to 2036
- By Country
- Germany
- France
- United Kingdom
- Italy
- Spain
- Benelux
- Nordics
- By Product Type
- By Application
- By Country
- Market Attractiveness Analysis
- By Country
- By Product Type
- By Application
- Key Takeaways
- Eastern Europe Market Analysis and Forecast, By Country
- Historical Market Size Value (USD Million) Trend Analysis By Market Taxonomy, 2021 to 2025
- Market Size Value (USD Million) Forecast By Market Taxonomy, 2026 to 2036
- By Country
- Poland
- Czech Republic
- Romania
- Hungary
- By Product Type
- By Application
- By Country
- Market Attractiveness Analysis
- By Country
- By Product Type
- By Application
- Key Takeaways
- East Asia Market Analysis and Forecast, By Country
- Historical Market Size Value (USD Million) Trend Analysis By Market Taxonomy, 2021 to 2025
- Market Size Value (USD Million) Forecast By Market Taxonomy, 2026 to 2036
- By Country
- China
- Japan
- South Korea
- By Product Type
- By Application
- By Country
- Market Attractiveness Analysis
- By Country
- By Product Type
- By Application
- Key Takeaways
- South Asia and Pacific Market Analysis and Forecast, By Country
- Historical Market Size Value (USD Million) Trend Analysis By Market Taxonomy, 2021 to 2025
- Market Size Value (USD Million) Forecast By Market Taxonomy, 2026 to 2036
- By Country
- India
- ASEAN
- Australia and New Zealand
- By Product Type
- By Application
- By Country
- Market Attractiveness Analysis
- By Country
- By Product Type
- By Application
- Key Takeaways
- Middle East and Africa Market Analysis and Forecast, By Country
- Historical Market Size Value (USD Million) Trend Analysis By Market Taxonomy, 2021 to 2025
- Market Size Value (USD Million) Forecast By Market Taxonomy, 2026 to 2036
- By Country
- GCC Countries
- South Africa
- Turkiye
- Israel
- By Product Type
- By Application
- By Country
- Market Attractiveness Analysis
- By Country
- By Product Type
- By Application
- Key Takeaways
- Key Countries Market Analysis
- United States
- Pricing Analysis
- Market Share Analysis, 2025
- By Product Type
- By Application
- Canada
- Pricing Analysis
- Market Share Analysis, 2025
- By Product Type
- By Application
- Mexico
- Pricing Analysis
- Market Share Analysis, 2025
- By Product Type
- By Application
- Brazil
- Pricing Analysis
- Market Share Analysis, 2025
- By Product Type
- By Application
- Chile
- Pricing Analysis
- Market Share Analysis, 2025
- By Product Type
- By Application
- Germany
- Pricing Analysis
- Market Share Analysis, 2025
- By Product Type
- By Application
- United Kingdom
- Pricing Analysis
- Market Share Analysis, 2025
- By Product Type
- By Application
- Italy
- Pricing Analysis
- Market Share Analysis, 2025
- By Product Type
- By Application
- Spain
- Pricing Analysis
- Market Share Analysis, 2025
- By Product Type
- By Application
- France
- Pricing Analysis
- Market Share Analysis, 2025
- By Product Type
- By Application
- India
- Pricing Analysis
- Market Share Analysis, 2025
- By Product Type
- By Application
- ASEAN
- Pricing Analysis
- Market Share Analysis, 2025
- By Product Type
- By Application
- Australia and New Zealand
- Pricing Analysis
- Market Share Analysis, 2025
- By Product Type
- By Application
- China
- Pricing Analysis
- Market Share Analysis, 2025
- By Product Type
- By Application
- Japan
- Pricing Analysis
- Market Share Analysis, 2025
- By Product Type
- By Application
- South Korea
- Pricing Analysis
- Market Share Analysis, 2025
- By Product Type
- By Application
- Poland
- Pricing Analysis
- Market Share Analysis, 2025
- By Product Type
- By Application
- Hungary
- Pricing Analysis
- Market Share Analysis, 2025
- By Product Type
- By Application
- South Africa
- Pricing Analysis
- Market Share Analysis, 2025
- By Product Type
- By Application
- United States
- Market Structure Analysis
- Competition Dashboard
- Competition Benchmarking
- Market Share Analysis of Top Players
- By Regional
- By Product Type
- By Application
- Emerging Startups
- Innovation Benchmarking
- Competition Analysis
- Competition Deep Dive
- Harmony Organics
- Overview
- Product Portfolio
- Profitability by Market Segments
- Sales Footprint
- Strategy Overview
- Marketing Strategy
- Product Strategy
- Channel Strategy
- Eternis Fine Chemicals
- Treatt
- Merck
- Thermo Fisher Scientific
- Harmony Organics
- Case Studies
- Success Stories
- Recent Developments
- Competition Deep Dive
- Assumptions & Acronyms Used
List of Tables
- Table 1: Global Market Value (USD Million) Forecast by Region, 2021 to 2036
- Table 2: Global Market Value (USD Million) Forecast by Product Type, 2021 to 2036
- Table 3: Global Market Value (USD Million) Forecast by Application, 2021 to 2036
- Table 4: North America Market Value (USD Million) Forecast by Country, 2021 to 2036
- Table 5: North America Market Value (USD Million) Forecast by Product Type, 2021 to 2036
- Table 6: North America Market Value (USD Million) Forecast by Application, 2021 to 2036
- Table 7: Latin America Market Value (USD Million) Forecast by Country, 2021 to 2036
- Table 8: Latin America Market Value (USD Million) Forecast by Product Type, 2021 to 2036
- Table 9: Latin America Market Value (USD Million) Forecast by Application, 2021 to 2036
- Table 10: Western Europe Market Value (USD Million) Forecast by Country, 2021 to 2036
- Table 11: Western Europe Market Value (USD Million) Forecast by Product Type, 2021 to 2036
- Table 12: Western Europe Market Value (USD Million) Forecast by Application, 2021 to 2036
- Table 13: Eastern Europe Market Value (USD Million) Forecast by Country, 2021 to 2036
- Table 14: Eastern Europe Market Value (USD Million) Forecast by Product Type, 2021 to 2036
- Table 15: Eastern Europe Market Value (USD Million) Forecast by Application, 2021 to 2036
- Table 16: East Asia Market Value (USD Million) Forecast by Country, 2021 to 2036
- Table 17: East Asia Market Value (USD Million) Forecast by Product Type, 2021 to 2036
- Table 18: East Asia Market Value (USD Million) Forecast by Application, 2021 to 2036
- Table 19: South Asia and Pacific Market Value (USD Million) Forecast by Country, 2021 to 2036
- Table 20: South Asia and Pacific Market Value (USD Million) Forecast by Product Type, 2021 to 2036
- Table 21: South Asia and Pacific Market Value (USD Million) Forecast by Application, 2021 to 2036
- Table 22: Middle East and Africa Market Value (USD Million) Forecast by Country, 2021 to 2036
- Table 23: Middle East and Africa Market Value (USD Million) Forecast by Product Type, 2021 to 2036
- Table 24: Middle East and Africa Market Value (USD Million) Forecast by Application, 2021 to 2036
List of Figures
- Figure 1: Global Market Pricing Analysis
- Figure 2: Global Market Value (USD Million) Forecast 2021-2036
- Figure 3: Global Market Value Share and BPS Analysis by Product Type, 2026 and 2036
- Figure 4: Global Market Y-o-Y Growth Comparison by Product Type, 2026-2036
- Figure 5: Global Market Attractiveness Analysis by Product Type
- Figure 6: Global Market Value Share and BPS Analysis by Application, 2026 and 2036
- Figure 7: Global Market Y-o-Y Growth Comparison by Application, 2026-2036
- Figure 8: Global Market Attractiveness Analysis by Application
- Figure 9: Global Market Value (USD Million) Share and BPS Analysis by Region, 2026 and 2036
- Figure 10: Global Market Y-o-Y Growth Comparison by Region, 2026-2036
- Figure 11: Global Market Attractiveness Analysis by Region
- Figure 12: North America Market Incremental Dollar Opportunity, 2026-2036
- Figure 13: Latin America Market Incremental Dollar Opportunity, 2026-2036
- Figure 14: Western Europe Market Incremental Dollar Opportunity, 2026-2036
- Figure 15: Eastern Europe Market Incremental Dollar Opportunity, 2026-2036
- Figure 16: East Asia Market Incremental Dollar Opportunity, 2026-2036
- Figure 17: South Asia and Pacific Market Incremental Dollar Opportunity, 2026-2036
- Figure 18: Middle East and Africa Market Incremental Dollar Opportunity, 2026-2036
- Figure 19: North America Market Value Share and BPS Analysis by Country, 2026 and 2036
- Figure 20: North America Market Value Share and BPS Analysis by Product Type, 2026 and 2036
- Figure 21: North America Market Y-o-Y Growth Comparison by Product Type, 2026-2036
- Figure 22: North America Market Attractiveness Analysis by Product Type
- Figure 23: North America Market Value Share and BPS Analysis by Application, 2026 and 2036
- Figure 24: North America Market Y-o-Y Growth Comparison by Application, 2026-2036
- Figure 25: North America Market Attractiveness Analysis by Application
- Figure 26: Latin America Market Value Share and BPS Analysis by Country, 2026 and 2036
- Figure 27: Latin America Market Value Share and BPS Analysis by Product Type, 2026 and 2036
- Figure 28: Latin America Market Y-o-Y Growth Comparison by Product Type, 2026-2036
- Figure 29: Latin America Market Attractiveness Analysis by Product Type
- Figure 30: Latin America Market Value Share and BPS Analysis by Application, 2026 and 2036
- Figure 31: Latin America Market Y-o-Y Growth Comparison by Application, 2026-2036
- Figure 32: Latin America Market Attractiveness Analysis by Application
- Figure 33: Western Europe Market Value Share and BPS Analysis by Country, 2026 and 2036
- Figure 34: Western Europe Market Value Share and BPS Analysis by Product Type, 2026 and 2036
- Figure 35: Western Europe Market Y-o-Y Growth Comparison by Product Type, 2026-2036
- Figure 36: Western Europe Market Attractiveness Analysis by Product Type
- Figure 37: Western Europe Market Value Share and BPS Analysis by Application, 2026 and 2036
- Figure 38: Western Europe Market Y-o-Y Growth Comparison by Application, 2026-2036
- Figure 39: Western Europe Market Attractiveness Analysis by Application
- Figure 40: Eastern Europe Market Value Share and BPS Analysis by Country, 2026 and 2036
- Figure 41: Eastern Europe Market Value Share and BPS Analysis by Product Type, 2026 and 2036
- Figure 42: Eastern Europe Market Y-o-Y Growth Comparison by Product Type, 2026-2036
- Figure 43: Eastern Europe Market Attractiveness Analysis by Product Type
- Figure 44: Eastern Europe Market Value Share and BPS Analysis by Application, 2026 and 2036
- Figure 45: Eastern Europe Market Y-o-Y Growth Comparison by Application, 2026-2036
- Figure 46: Eastern Europe Market Attractiveness Analysis by Application
- Figure 47: East Asia Market Value Share and BPS Analysis by Country, 2026 and 2036
- Figure 48: East Asia Market Value Share and BPS Analysis by Product Type, 2026 and 2036
- Figure 49: East Asia Market Y-o-Y Growth Comparison by Product Type, 2026-2036
- Figure 50: East Asia Market Attractiveness Analysis by Product Type
- Figure 51: East Asia Market Value Share and BPS Analysis by Application, 2026 and 2036
- Figure 52: East Asia Market Y-o-Y Growth Comparison by Application, 2026-2036
- Figure 53: East Asia Market Attractiveness Analysis by Application
- Figure 54: South Asia and Pacific Market Value Share and BPS Analysis by Country, 2026 and 2036
- Figure 55: South Asia and Pacific Market Value Share and BPS Analysis by Product Type, 2026 and 2036
- Figure 56: South Asia and Pacific Market Y-o-Y Growth Comparison by Product Type, 2026-2036
- Figure 57: South Asia and Pacific Market Attractiveness Analysis by Product Type
- Figure 58: South Asia and Pacific Market Value Share and BPS Analysis by Application, 2026 and 2036
- Figure 59: South Asia and Pacific Market Y-o-Y Growth Comparison by Application, 2026-2036
- Figure 60: South Asia and Pacific Market Attractiveness Analysis by Application
- Figure 61: Middle East and Africa Market Value Share and BPS Analysis by Country, 2026 and 2036
- Figure 62: Middle East and Africa Market Value Share and BPS Analysis by Product Type, 2026 and 2036
- Figure 63: Middle East and Africa Market Y-o-Y Growth Comparison by Product Type, 2026-2036
- Figure 64: Middle East and Africa Market Attractiveness Analysis by Product Type
- Figure 65: Middle East and Africa Market Value Share and BPS Analysis by Application, 2026 and 2036
- Figure 66: Middle East and Africa Market Y-o-Y Growth Comparison by Application, 2026-2036
- Figure 67: Middle East and Africa Market Attractiveness Analysis by Application
- Figure 68: Global Market - Tier Structure Analysis
- Figure 69: Global Market - Company Share Analysis
Frequently Asked Questions
What is the size of the Phenylethyl Market?
The global phenylethyl alcohol market was valued at USD 318.3 million in 2025 and is estimated at USD 335.8 million in 2026. It is forecast to reach USD 573.6 million by 2036, expanding at a CAGR of 5.5% from 2026 to 2036.
Which substance does the Phenylethyl Market cover?
It covers phenylethyl alcohol, CAS 60-12-8, also called phenethyl alcohol or 2-phenylethanol. Phenylethylamine and separately sold esters or other derivatives are excluded.
Which product type and application lead the Phenylethyl Market?
Chemical synthesis is estimated to hold 87.1% of demand by product type in 2026, while fragrance compositions are estimated to hold 62.7% by application.
Which country is likely to grow fastest in the Phenylethyl Market?
India is likely to grow at a 6.4% CAGR during the forecast period, followed by China at 6.1%, France at 5.6%, the USA at 4.8% and Germany at 4.4%.
Does fermentation automatically establish a natural claim?
No. A supplier needs evidence of the actual production route and of the requirements that apply to the particular claim, and the finished material must also meet the intended sensory and chemical specification.
Does a fermentation research result show commercial supply?
No. It shows the result achieved under the study conditions. A conceptual design or laboratory batch does not show commissioned capacity, and commercial supply needs evidence of scale and repeat finished quality. [8][7]
Why does sensory evaluation matter alongside purity?
The ingredient has to give the expected aroma contribution in the complete formula, and the main assay alone may not reveal an unwanted sensory difference between sources. Competitive Analysis of the Phenylethyl Market Key Players
Preview the report firsthand - request a free sample
Get SampleGet the brochure for pricing and purchase details.
Get PDF
