Phosphatidylserine Market Size and Share Forecast Outlook 2025 to 2035

The global phosphatidylserine market is projected to grow from USD 197.6 million in 2025 to USD 331.9 million by 2035, registering a CAGR of 5.3%. Market expansion is being driven by the growing demand for cognitive health supplements and rising awareness about mental well-being.
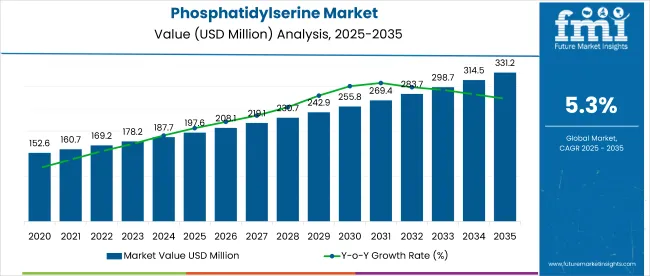
Quick Stats for Phosphatidylserine Market

  • Market Value (2025): USD 197.6 million
  • Forecast Value (2035): USD 331.9 million
  • Forecast CAGR: 5.3%
  • Form Leader in 2025: Powder (70% market share)
  • Top Source Segment: Plant-Based (68% share)
  • Key Growth Region: East Asia (Japan is the fastest-growing market with a 6.7% CAGR)

Phosphatidylserine Market Market Value Analysis

Metric Value
Industry Size (2025E) USD 197.6 million
Industry Value (2035F) USD 331.9 million
CAGR (2025 to 2035) 5.3%

As consumers increasingly adopt dietary supplements to combat age-related memory decline and stress, phosphatidylserine-based products are witnessing significant traction. The ingredient is gaining popularity across functional foods, nutraceuticals, and pharmaceutical applications due to its proven benefits in enhancing brain function and treating cognitive disorders.

The market holds a dominant 62% share in the global cognitive health supplements market, driven by its strong efficacy in enhancing memory and mental focus. Within the dietary supplements market, it accounts for 2%, while in the broader functional food ingredients market, its share stands at around 6%.

It contributes roughly 4% to the growing nootropics market and about 3% to the overall nutraceuticals market. In the expansive health and wellness products market, phosphatidylserine holds a minimal share of less than 0.03%. Its targeted application in brain health continues to solidify its position within these niche categories.

Regulatory frameworks influencing the market include the United States Food and Drug Administration's GRAS (Generally Recognized as Safe) status for phosphatidylserine, which allows its incorporation in functional foods and supplements. In the European Union, it is regulated under EFSA guidelines for novel food ingredients, ensuring product safety and health claim validation.

These global standards, combined with region-specific regulations like India’s FSSAI norms for nutraceuticals and dietary supplements, are pushing manufacturers to develop high-purity, plant-based phosphatidylserine products. This is expected to further boost consumer trust and drive long-term market growth.

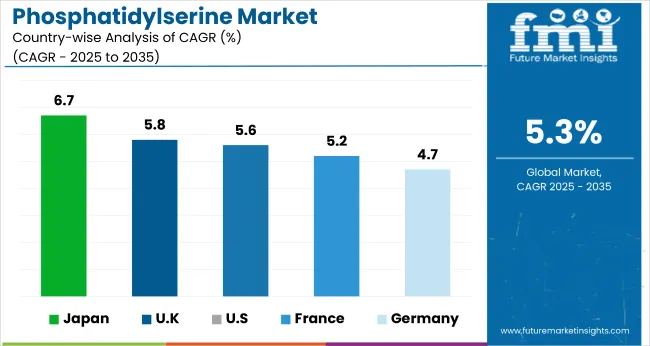
Japan is projected to be the fastest-growing market, expected to expand at a CAGR of 6.7% from 2025 to 2035. Powder will lead the form segment with a 70% share, while plant-based will dominate the source segment with a 68% share. The U.S. and Germany markets are also expected to grow steadily at CAGRs of 5.6% and 4.7%, respectively.

Phosphatidylserine Market Analysis by Top Investment Segments

The global market is segmented by form, end use, grade, nature, source, and region. By form, the market is divided into powder and liquid. In terms of end use, the market includes functional foods, dietary supplements & nutraceuticals, and cosmetic & personal care.

Based on grade, the market is segmented into food grade and pharmaceutical grade. By nature, the market is categorized into organic and conventional. In terms of source, the market is divided into plant source (soybean, sunflower, and other plant sources) and animal-derived. Regionally, the market is classified into North America, Latin America, Europe, East Asia, South Asia, Oceania, Middle East and Africa.
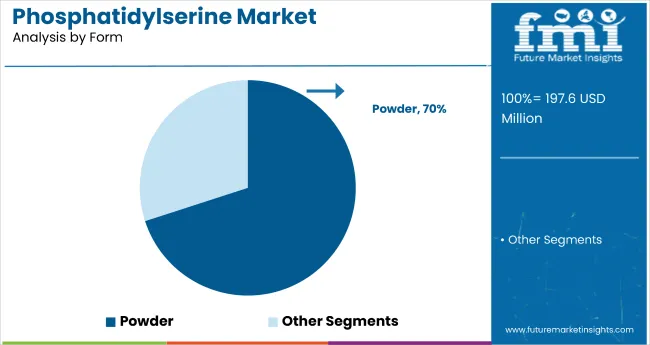
Powder Form to Lead the Form Segment with 70% Market Share

Phosphatidylserine Market Analysis By Form

  • Powder form is expected to dominate the form segment with a 70% market share by 2025, driven by its widespread use in supplements, functional food formulations, and capsule manufacturing.
  • Powder is easier to process, blend, and store, making it suitable for mass production of dietary and nutraceutical products.
  • Its longer shelf life and compatibility with various formulations drive demand across industries.

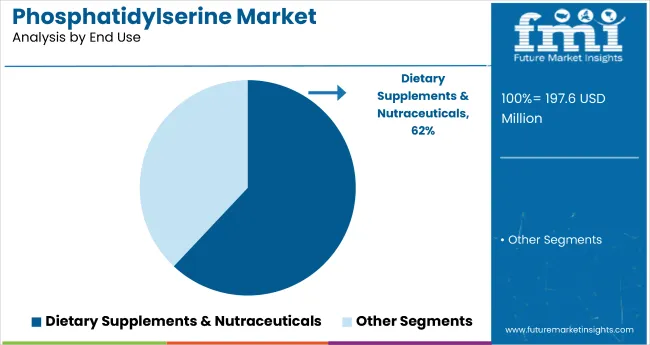
Dietary Supplements & Nutraceuticals to Capture 62% of the End Use Segment in 2025

Phosphatidylserine Market Analysis By End Use

  • Dietary supplements and nutraceuticals are expected to hold 62% of the global market share in 2025, driven by rising demand for cognitive health and memory support products among aging populations, with growing interest in plant-based and clean-label formulations worldwide.
  • Phosphatidylserine is extensively used for cognitive health support, especially in aging populations.
  • Growing consumer awareness regarding mental health and brain function is driving demand in this segment.

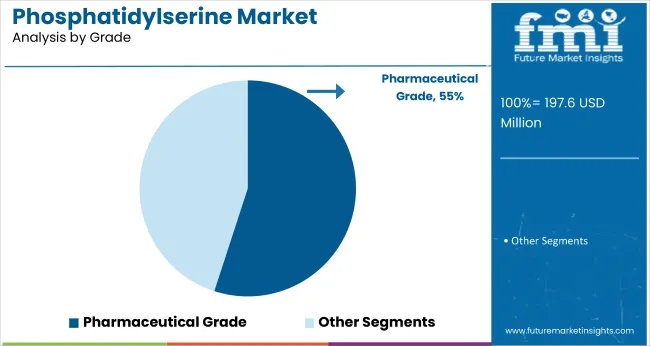
Pharmaceutical Grade to Lead the Grade Segment with 55% Market Share

Phosphatidylserine Market Analysis By Grade

Pharmaceutical grade is projected to lead the grade segment with a 55% market share by 2025, supported by its high purity and suitability for clinical and therapeutic applications. Its widespread use in injectable formulations, vaccine stabilizers, and nutraceutical products further enhances its demand across regulated pharmaceutical manufacturing environments.
  • Higher purity and regulatory compliance make this grade suitable for clinical and therapeutic applications.
  • Increasing R&D in neurodegenerative disease treatments is fueling adoption of pharmaceutical-grade products.

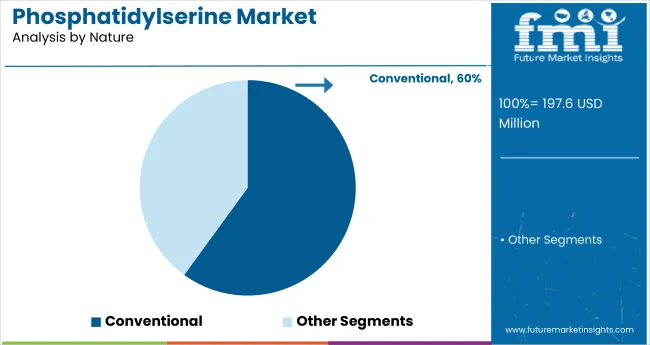
Conventional to Capture the Nature Segment with 60% Market Share in 2025

Phosphatidylserine Market Analysis By Nature

Conventional is projected to capture 60% of the market share by 2025, driven by its wide availability, affordability, and established use in large-scale supplement production. Its consistent supply chain, regulatory familiarity, and ease of formulation across diverse product formats contribute to its dominance in both emerging and developed markets.
  • Higher availability and lower cost compared to organic variants make it a preferred choice for bulk manufacturing.
  • Dominance of conventional sources continues due to limited certified organic production capacity.

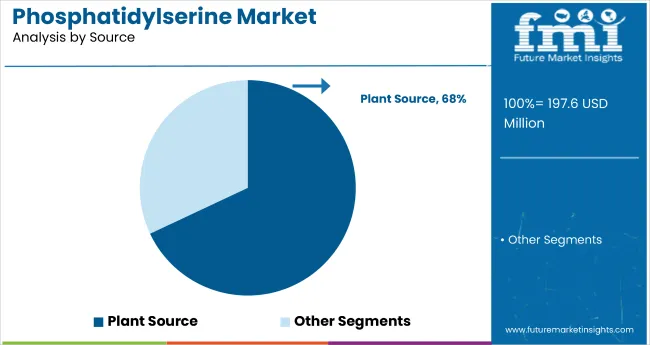
Plant Source to Dominate the Source Segment with 68% Market Share

Phosphatidylserine Market Analysis By Source

Plant source is expected to dominate the source segment with a 68% market share by 2025, supported by rising demand for vegan, allergen-free, and sustainable supplement alternatives. Increased consumer awareness of environmental impact, clean-label preferences, and regulatory support for botanical ingredients further reinforce its growing adoption across global nutraceutical and dietary supplement markets.

  • Increased consumer demand for vegan and plant-based supplements is driving this trend.
  • Soybean and sunflower remain the leading raw materials due to their safety and efficacy.

Top Phosphatidylserine Market Dynamics

The global phosphatidylserine market is witnessing steady growth, driven by rising consumer awareness regarding cognitive health and increasing demand for dietary supplements targeting memory enhancement. Phosphatidylserine plays a vital role in supporting brain function, making it a key ingredient in nutraceutical and functional food formulations.

Recent Trends in the Phosphatidylserine Market

  • Shift toward plant-based phosphatidylserine, especially from sunflower and soybean sources, is gaining traction due to growing consumer preference for vegan and allergen-free supplements.
  • Incorporation of phosphatidylserine in functional food products like nutritional bars, beverages, and dairy alternatives is expanding its application scope beyond traditional capsules and tablets.

Challenges in the Phosphatidylserine Market
  • Complex and expensive production processes, especially for achieving high purity pharmaceutical-grade phosphatidylserine, increase product costs and limit mass adoption.
  • Lack of harmonized global regulations and inconsistent health claims across regions hinder product marketing and delay new product approvals in key markets.

Top Countries Manufacturing, Regulating, and Generating Demand for Phosphatidylserine

Phosphatidylserine Market Cagr Analysis By Country

Japan phosphatidylserine market growth is supported by elderly care innovation, functional nutrition trends, and regulatory support, making it the fastest-growing OECD market at 6.7% CAGR. Germany and France maintain consistent demand driven by EU nutraceutical regulations and funding for wellness innovation under national health initiatives. In contrast, developed economies such as the USA (5.6% CAGR), UK (5.8%), and Japan (6.7%) are expected to grow at a steady 0.89-1.26x of the global growth rate.

The UK follows, supported by rising demand for vegan nootropics and digital retail growth. The USA maintains steady momentum due to widespread use of over-the-counter supplements and regulatory backing through GRAS status. France shows consistent expansion, fueled by national wellness policies and interest in brain health support. Germany, while slightly behind, continues to see stable demand through pharmacy channels and clean-label trends.

The report covers in-depth analysis of 40+ countries; five top-performing OECD countries are highlighted below.

In-depth Analysis of Phosphatidylserine Demand in Japan

The Japan phosphatidylserine revenue is growing at a CAGR of 6.7% from 2025 to 2035. Growth is driven by the nation’s aging population, proactive health culture, and advancements in functional nutrition. Japan integrates phosphatidylserine into fortified foods, beverages, and memory supplements.

  • Strong demand in elderly cognitive health and fortified foods.
  • Preference for soy and sunflower-derived ingredients.

Growth Outlook for Phosphatidylserine in Germany

Sales of phosphatidylserine in Germany are expected to expand at a CAGR of 4.7% during the forecast period, slightly below the global average but driven by regulatory factors. EU-approved health claims and clean-label trends support its use in pharmacy-sold cognitive supplements. Demand is primarily driven by aging consumers and wellness-focused professionals.

  • EU-regulated ingredient labeling supports market trust.
  • Dominant sales through natural health retailers and pharmacies.

Cognitive Support Ingredient Demand in France

The French phosphatidylserine market is projected to grow at a CAGR of 5.2% during the forecast period, in line with the global average. Demand is driven by increasing brain health awareness, national wellness policies, and workplace stress prevention initiatives. Functional foods and over the counter (OTC) supplements remain the primary application segments.

  • Popular among aging professionals seeking memory support.
  • Growth in fortified food and over-the-counter formats.

Demand Trajectory for Phosphatidylserine in the USA

The USA phosphatidylserine market is projected to grow at a CAGR of 5.6% from 2025 to 2035, translating to 1.06x the global growth rate. Demand is driven by high awareness of memory support supplements and widespread access to nutraceuticals. The FDA’s GRAS status enables its use in a variety of functional products, including cereals, beverages, and capsules.

  • Mass-market availability through pharmacies and online platforms.
  • GRAS recognition supports functional food integration.

Brain Health Trends in the UK

The UK phosphatidylserine market is projected to grow at a CAGR of 5.8% from 2025 to 2035, representing the fastest growth among top OECD nations at 1.09x the global pace. This growth is supported by rising demand for vegan brain health products and nootropics. Supplements targeting focus and memory are gaining traction among middle-aged and senior consumers.
  • High demand for vegan and plant-derived cognitive enhancers.
  • E-commerce and retail pharmacy expansion drive accessibility.

Leading Phosphatidylserine Suppliers and Manufacturers

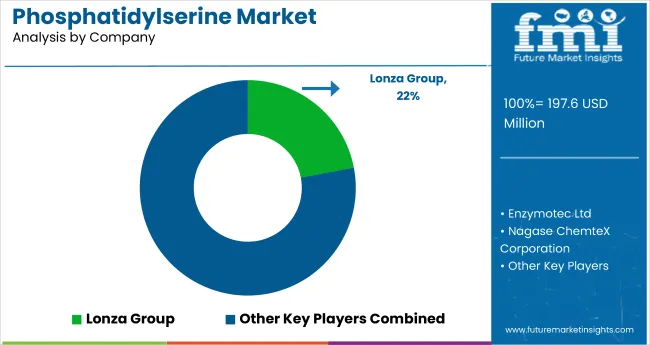
Phosphatidylserine Market Analysis By Company

The global market is moderately consolidated, with key players such as Lonza Group, Enzymotec Ltd, Lipogen Products Ltd, Doosan Corporation, and Novastell leading the global supply landscape. These companies offer pharmaceutical and food-grade phosphatidylserine solutions that support cognitive health, memory enhancement, and functional food applications. Lonza Group focuses on high-purity, plant-derived ingredients for the nutraceutical sector, while Enzymotec Ltd and Lipogen Products Ltd specialize in brain health formulations backed by clinical studies.

Doosan Corporation delivers advanced phospholipid manufacturing capabilities, and Novastell supports clean-label, soy and sunflower-derived sourcing. Other prominent players such as Nagase ChemteX Corporation, Bontac Bio-engineering Co. Ltd., ECA Healthcare, Lipoid GmbH, and Chemi Nutra LLC contribute through targeted innovations, including organic, vegan-certified, and encapsulated phosphatidylserine for enhanced bioavailability.

Recent Phosphatidylserine Industry News

  • In April 2025, BONTAC launched next-gen NAD⁺ supplements at the Tokyo Health Food Expo, introducing patented NMNH and NRHM innovations with superior bioavailability, stability, and metabolic support for global health applications.
  • In March 2025, SN Tech, a joint venture by Nagase & Co., Nagase ChemteX, and SACHEM, opened a new plant in Higashiosaka to recycle semiconductor developer TMAH, marking Japan’s first such initiative, with mass production set for FY2025.

Phosphatidylserine Market Report Scope

Report Attributes Details
Market Size (2025) USD 197.6 million
Projected Market Size (2035) USD 331.9 million
CAGR (2025 to 2035) 5.3%
Base Year for Estimation 2024
Historical Period 2020 to 2024
Projections Period 2025 to 2035
Report Parameter USD million for value/volume in metric tons
Form Analyzed Powder and Liquid
End Use Analyzed Functional Foods, Dietary Supplements & Nutraceuticals, and Cosmetic & Personal Care
Grade Analyzed Food Grade and Pharmaceutical Grade
Nature Analyzed Organic and Conventional
Source Analyzed Plant Source (Soybean, Sunflower, Other Plant Sources) and Animal-Derived
Regions Covered North America, Latin America, Europe, East Asia, South Asia, Oceania, Middle East and Africa
Countries Covered United States, United Kingdom, Germany, France, Japan, China, India, Brazil, South Korea, Australia and 40+ countries
Key Players Influencing the Market Lonza Group, Enzymotec Ltd, Lipogen Products Ltd., Doosan Corporation, Novastell, Nagase ChemteX Corporation, Bontac Bio-engineering Co. Ltd., ECA Healthcare, Inc., Lipoid GmbH, Chemi Nutra LLC
Additional Attributes Dollar sales by form and grade, share by source, regional demand outlook, functional ingredient trends, clean-label innovation, competitive landscape benchmarking

Key Segments

By Form:

  • Powder
  • Liquid

By End Use:

  • Functional Foods
  • Dietary Supplements & Nutraceuticals
  • Cosmetics & Personal Care

By Grade:

  • Food Grade
  • Pharmaceutical Grade

By Nature:

  • Organic
  • Conventional

By Source:

  • Plant Source
    • Soybean
    • Sunflower
    • Others (Cabbage etc.)
  • Animal-derived

By Region:

  • North America
  • Latin America
  • Western Europe
  • Eastern Europe
  • East Asia
  • South Asia & Pacific
  • Middle East and Africa

Table of Content

  1. Executive Summary
    • Global Market Outlook
    • Demand-side Trends
    • Supply-side Trends
    • Technology Roadmap Analysis
    • Analysis and Recommendations
  2. Market Overview
    • Market Coverage / Taxonomy
    • Market Definition / Scope / Limitations
  3. Market Background
    • Market Dynamics
      • Drivers
      • Restraints
      • Opportunity
      • Trends
    • Scenario Forecast
      • Demand in Optimistic Scenario
      • Demand in Likely Scenario
      • Demand in Conservative Scenario
    • Opportunity Map Analysis
    • Product Life Cycle Analysis
    • Supply Chain Analysis
      • Supply Side Participants and their Roles
        • Producers
        • Mid-Level Participants (Traders/ Agents/ Brokers)
        • Wholesalers and Distributors
      • Value Added and Value Created at Node in the Supply Chain
      • List of Raw Material Suppliers
      • List of Existing and Potential Buyer’s
    • Investment Feasibility Matrix
    • Value Chain Analysis
      • Profit Margin Analysis
      • Wholesalers and Distributors
      • Retailers
    • PESTLE and Porter’s Analysis
    • Regulatory Landscape
      • By Key Regions
      • By Key Countries
    • Regional Parent Market Outlook
    • Production and Consumption Statistics
    • Import and Export Statistics
  4. Global Market Analysis 2020 to 2024 and Forecast, 2025 to 2035
    • Historical Market Size Value (USD Million) & Volume (Metric Tons) Analysis, 2020 to 2024
    • Current and Future Market Size Value (USD Million) & Volume (Metric Tons) Projections, 2025 to 2035
      • Y-o-Y Growth Trend Analysis
      • Absolute $ Opportunity Analysis
  5. Global Market Pricing Analysis 2020 to 2024 and Forecast 2025 to 2035
  6. Global Market Analysis 2020 to 2024 and Forecast 2025 to 2035, By Form
    • Introduction / Key Findings
    • Historical Market Size Value (USD Million) & Volume (Metric Tons) Analysis By Form, 2020 to 2024
    • Current and Future Market Size Value (USD Million) & Volume (Metric Tons) Analysis and Forecast By Form, 2025 to 2035
      • Powder
      • Liquid
    • Y-o-Y Growth Trend Analysis By Form, 2020 to 2024
    • Absolute $ Opportunity Analysis By Form, 2025 to 2035
  7. Global Market Analysis 2020 to 2024 and Forecast 2025 to 2035, By End Use
    • Introduction / Key Findings
    • Historical Market Size Value (USD Million) & Volume (Metric Tons) Analysis By End Use, 2020 to 2024
    • Current and Future Market Size Value (USD Million) & Volume (Metric Tons) Analysis and Forecast By End Use, 2025 to 2035
      • Functional Foods
      • Dietary Supplements & Nutraceuticals
      • Cosmetic & Personal Care
    • Y-o-Y Growth Trend Analysis By End Use, 2020 to 2024
    • Absolute $ Opportunity Analysis By End Use, 2025 to 2035
  8. Global Market Analysis 2020 to 2024 and Forecast 2025 to 2035, By Grade
    • Introduction / Key Findings
    • Historical Market Size Value (USD Million) & Volume (Metric Tons) Analysis By Grade, 2020 to 2024
    • Current and Future Market Size Value (USD Million) & Volume (Metric Tons) Analysis and Forecast By Grade, 2025 to 2035
      • Food Grade
      • Pharmaceutical Grade
    • Y-o-Y Growth Trend Analysis By Grade, 2020 to 2024
    • Absolute $ Opportunity Analysis By Grade, 2025 to 2035
  9. Global Market Analysis 2020 to 2024 and Forecast 2025 to 2035, By Nature
    • Introduction / Key Findings
    • Historical Market Size Value (USD Million) & Volume (Metric Tons) Analysis By Nature, 2020 to 2024
    • Current and Future Market Size Value (USD Million) & Volume (Metric Tons) Analysis and Forecast By Nature, 2025 to 2035
      • Organic
      • Conventional
    • Y-o-Y Growth Trend Analysis By Nature, 2020 to 2024
    • Absolute $ Opportunity Analysis By Nature, 2025 to 2035
  10. Global Market Analysis 2020 to 2024 and Forecast 2025 to 2035, By Source
    • Introduction / Key Findings
    • Historical Market Size Value (USD Million) & Volume (Metric Tons) Analysis By Source, 2020 to 2024
    • Current and Future Market Size Value (USD Million) & Volume (Metric Tons) Analysis and Forecast By Source, 2025 to 2035
      • Plant Source
        • Soybean
        • Sunflower
        • Other Plant Sources
      • Animal-Derived
    • Y-o-Y Growth Trend Analysis By Source, 2020 to 2024
    • Absolute $ Opportunity Analysis By Source, 2025 to 2035
  11. Global Market Analysis 2020 to 2024 and Forecast 2025 to 2035, By Region
    • Introduction
    • Historical Market Size Value (USD Million) & Volume (Metric Tons) Analysis By Region, 2020 to 2024
    • Current Market Size Value (USD Million) & Volume (Metric Tons) Analysis and Forecast By Region, 2025 to 2035
      • North America
      • Latin America
      • Western Europe
      • Eastern Europe
      • East Asia
      • South Asia & Pacific
      • Middle East and Africa
    • Market Attractiveness Analysis By Region
  12. North America Market Analysis 2020 to 2024 and Forecast 2025 to 2035, By Country
    • Historical Market Size Value (USD Million) & Volume (Metric Tons) Trend Analysis By Market Taxonomy, 2020 to 2024
    • Market Size Value (USD Million) & Volume (Metric Tons) Forecast By Market Taxonomy, 2025 to 2035
      • By Country
        • USA
        • Canada
        • Mexico
      • By Form
      • By End Use
      • By Grade
      • By Nature
      • By Source
    • Market Attractiveness Analysis
      • By Country
      • By Form
      • By End Use
      • By Grade
      • By Nature
      • By Source
    • Key Takeaways
  13. Latin America Market Analysis 2020 to 2024 and Forecast 2025 to 2035, By Country
    • Historical Market Size Value (USD Million) & Volume (Metric Tons) Trend Analysis By Market Taxonomy, 2020 to 2024
    • Market Size Value (USD Million) & Volume (Metric Tons) Forecast By Market Taxonomy, 2025 to 2035
      • By Country
        • Brazil
        • Argentina
        • Rest of LATAM
      • By Form
      • By End Use
      • By Grade
      • By Nature
      • By Source
    • Market Attractiveness Analysis
      • By Country
      • By Form
      • By End Use
      • By Grade
      • By Nature
      • By Source
    • Key Takeaways
  14. Western Europe Market Analysis 2020 to 2024 and Forecast 2025 to 2035, By Country
    • Historical Market Size Value (USD Million) & Volume (Metric Tons) Trend Analysis By Market Taxonomy, 2020 to 2024
    • Market Size Value (USD Million) & Volume (Metric Tons) Forecast By Market Taxonomy, 2025 to 2035
      • By Country
        • Germany
        • Italy
        • France
        • UK
        • Spain
        • BENELUX
        • Nordic
        • Rest of W.Europe
      • By Form
      • By End Use
      • By Grade
      • By Nature
      • By Source
    • Market Attractiveness Analysis
      • By Country
      • By Form
      • By End Use
      • By Grade
      • By Nature
      • By Source
    • Key Takeaways
  15. Eastern Europe Market Analysis 2020 to 2024 and Forecast 2025 to 2035, By Country
    • Historical Market Size Value (USD Million) & Volume (Metric Tons) Trend Analysis By Market Taxonomy, 2020 to 2024
    • Market Size Value (USD Million) & Volume (Metric Tons) Forecast By Market Taxonomy, 2025 to 2035
      • By Country
        • Russia
        • Hungary
        • Poland
        • Balkan & Baltics
        • Rest of E. Europe
      • By Form
      • By End Use
      • By Grade
      • By Nature
      • By Source
    • Market Attractiveness Analysis
      • By Country
      • By Form
      • By End Use
      • By Grade
      • By Nature
      • By Source
    • Key Takeaways
  16. East Asia Market Analysis 2020 to 2024 and Forecast 2025 to 2035, By Country
    • Historical Market Size Value (USD Million) & Volume (Metric Tons) Trend Analysis By Market Taxonomy, 2020 to 2024
    • Market Size Value (USD Million) & Volume (Metric Tons) Forecast By Market Taxonomy, 2025 to 2035
      • By Country
        • China
        • Japan
        • South Korea
      • By Form
      • By End Use
      • By Grade
      • By Nature
      • By Source
    • Market Attractiveness Analysis
      • By Country
      • By Form
      • By End Use
      • By Grade
      • By Nature
      • By Source
    • Key Takeaways
  17. South Asia & Pacific Market Analysis 2020 to 2024 and Forecast 2025 to 2035, By Country
    • Historical Market Size Value (USD Million) & Volume (Metric Tons) Trend Analysis By Market Taxonomy, 2020 to 2024
    • Market Size Value (USD Million) & Volume (Metric Tons) Forecast By Market Taxonomy, 2025 to 2035
      • By Country
        • India
        • Australia & New Zealand
        • ASEAN
        • Rest of SAP
      • By Form
      • By End Use
      • By Grade
      • By Nature
      • By Source
    • Market Attractiveness Analysis
      • By Country
      • By Form
      • By End Use
      • By Grade
      • By Nature
      • By Source
    • Key Takeaways
  18. Middle East and Africa Market Analysis 2020 to 2024 and Forecast 2025 to 2035, By Country
    • Historical Market Size Value (USD Million) & Volume (Metric Tons) Trend Analysis By Market Taxonomy, 2020 to 2024
    • Market Size Value (USD Million) & Volume (Metric Tons) Forecast By Market Taxonomy, 2025 to 2035
      • By Country
        • GCC Countries
        • Northern Africa
        • South Africa
        • Turkiye
        • Rest of MEA
      • By Form
      • By End Use
      • By Grade
      • By Nature
      • By Source
    • Market Attractiveness Analysis
      • By Country
      • By Form
      • By End Use
      • By Grade
      • By Nature
      • By Source
    • Key Takeaways
  19. Key Countries Market Analysis
    • USA
      • Pricing Analysis
      • Market Share Analysis, 2024
        • By Form
        • By End Use
        • By Grade
        • By Nature
        • By Source
    • Canada
      • Pricing Analysis
      • Market Share Analysis, 2024
        • By Form
        • By End Use
        • By Grade
        • By Nature
        • By Source
    • Brazil
      • Pricing Analysis
      • Market Share Analysis, 2024
        • By Form
        • By End Use
        • By Grade
        • By Nature
        • By Source
    • Mexico
      • Pricing Analysis
      • Market Share Analysis, 2024
        • By Form
        • By End Use
        • By Grade
        • By Nature
        • By Source
    • Argentina
      • Pricing Analysis
      • Market Share Analysis, 2024
        • By Form
        • By End Use
        • By Grade
        • By Nature
        • By Source
  20. Market Structure Analysis
    • Competition Dashboard
    • Competition Benchmarking
    • Market Share Analysis of Top Players
      • By Regional
      • By Form
      • By End Use
      • By Grade
      • By Nature
      • By Source
  21. Competition Analysis
    • Competition Deep Dive
      • Lonza Group
        • Overview
        • Product Portfolio
        • Profitability by Market Segments (Product/Age /Sales Channel/Region)
        • Sales Footprint
        • Strategy Overview
          • Marketing Strategy
          • Product Strategy
          • Channel Strategy
      • Enzymotec Ltd
        • Overview
        • Product Portfolio
        • Profitability by Market Segments (Product/Age /Sales Channel/Region)
        • Sales Footprint
        • Strategy Overview
          • Marketing Strategy
          • Product Strategy
          • Channel Strategy
      • Lipogen Products Ltd.
        • Overview
        • Product Portfolio
        • Profitability by Market Segments (Product/Age /Sales Channel/Region)
        • Sales Footprint
        • Strategy Overview
          • Marketing Strategy
          • Product Strategy
          • Channel Strategy
      • Doosan Corporation
        • Overview
        • Product Portfolio
        • Profitability by Market Segments (Product/Age /Sales Channel/Region)
        • Sales Footprint
        • Strategy Overview
          • Marketing Strategy
          • Product Strategy
          • Channel Strategy
      • Novastell
        • Overview
        • Product Portfolio
        • Profitability by Market Segments (Product/Age /Sales Channel/Region)
        • Sales Footprint
        • Strategy Overview
          • Marketing Strategy
          • Product Strategy
          • Channel Strategy
      • Nagase ChemteX Corporation
        • Overview
        • Product Portfolio
        • Profitability by Market Segments (Product/Age /Sales Channel/Region)
        • Sales Footprint
        • Strategy Overview
          • Marketing Strategy
          • Product Strategy
          • Channel Strategy
      • Bontac Bio-engineering Co. Ltd.
        • Overview
        • Product Portfolio
        • Profitability by Market Segments (Product/Age /Sales Channel/Region)
        • Sales Footprint
        • Strategy Overview
          • Marketing Strategy
          • Product Strategy
          • Channel Strategy
      • ECA Healthcare, Inc.
        • Overview
        • Product Portfolio
        • Profitability by Market Segments (Product/Age /Sales Channel/Region)
        • Sales Footprint
        • Strategy Overview
          • Marketing Strategy
          • Product Strategy
          • Channel Strategy
      • Lipoid GmbH
        • Overview
        • Product Portfolio
        • Profitability by Market Segments (Product/Age /Sales Channel/Region)
        • Sales Footprint
        • Strategy Overview
          • Marketing Strategy
          • Product Strategy
          • Channel Strategy
      • Chemi Nutra LLC
        • Overview
        • Product Portfolio
        • Profitability by Market Segments (Product/Age /Sales Channel/Region)
        • Sales Footprint
        • Strategy Overview
          • Marketing Strategy
          • Product Strategy
          • Channel Strategy
  22. Assumptions & Acronyms Used
  23. Research Methodology

List of Tables

  • Table 1: Global Market Value (USD Million) Forecast by Region, 2020-2035
  • Table 2: Global Market Volume (Metric Tons) Forecast by Region, 2020-2035
  • Table 3: Global Market Value (USD Million) Forecast by Form, 2020-2035
  • Table 4: Global Market Volume (Metric Tons) Forecast by Form, 2020-2035
  • Table 5: Global Market Value (USD Million) Forecast by End Use, 2020-2035
  • Table 6: Global Market Volume (Metric Tons) Forecast by End Use, 2020-2035
  • Table 7: Global Market Value (USD Million) Forecast by Grade, 2020-2035
  • Table 8: Global Market Volume (Metric Tons) Forecast by Grade, 2020-2035
  • Table 9: Global Market Value (USD Million) Forecast by Nature, 2020-2035
  • Table 10: Global Market Volume (Metric Tons) Forecast by Nature, 2020-2035
  • Table 11: Global Market Value (USD Million) Forecast by Source, 2020-2035
  • Table 12: Global Market Volume (Metric Tons) Forecast by Source, 2020-2035
  • Table 13: North America Market Value (USD Million) Forecast by Country, 2020-2035
  • Table 14: North America Market Volume (Metric Tons) Forecast by Country, 2020-2035
  • Table 15: North America Market Value (USD Million) Forecast by Form, 2020-2035
  • Table 16: North America Market Volume (Metric Tons) Forecast by Form, 2020-2035
  • Table 17: North America Market Value (USD Million) Forecast by End Use, 2020-2035
  • Table 18: North America Market Volume (Metric Tons) Forecast by End Use, 2020-2035
  • Table 19: North America Market Value (USD Million) Forecast by Grade, 2020-2035
  • Table 20: North America Market Volume (Metric Tons) Forecast by Grade, 2020-2035
  • Table 21: North America Market Value (USD Million) Forecast by Nature, 2020-2035
  • Table 22: North America Market Volume (Metric Tons) Forecast by Nature, 2020-2035
  • Table 23: North America Market Value (USD Million) Forecast by Source, 2020-2035
  • Table 24: North America Market Volume (Metric Tons) Forecast by Source, 2020-2035
  • Table 25: Latin America Market Value (USD Million) Forecast by Country, 2020-2035
  • Table 26: Latin America Market Volume (Metric Tons) Forecast by Country, 2020-2035
  • Table 27: Latin America Market Value (USD Million) Forecast by Form, 2020-2035
  • Table 28: Latin America Market Volume (Metric Tons) Forecast by Form, 2020-2035
  • Table 29: Latin America Market Value (USD Million) Forecast by End Use, 2020-2035
  • Table 30: Latin America Market Volume (Metric Tons) Forecast by End Use, 2020-2035
  • Table 31: Latin America Market Value (USD Million) Forecast by Grade, 2020-2035
  • Table 32: Latin America Market Volume (Metric Tons) Forecast by Grade, 2020-2035
  • Table 33: Latin America Market Value (USD Million) Forecast by Nature, 2020-2035
  • Table 34: Latin America Market Volume (Metric Tons) Forecast by Nature, 2020-2035
  • Table 35: Latin America Market Value (USD Million) Forecast by Source, 2020-2035
  • Table 36: Latin America Market Volume (Metric Tons) Forecast by Source, 2020-2035
  • Table 37: Western Europe Market Value (USD Million) Forecast by Country, 2020-2035
  • Table 38: Western Europe Market Volume (Metric Tons) Forecast by Country, 2020-2035
  • Table 39: Western Europe Market Value (USD Million) Forecast by Form, 2020-2035
  • Table 40: Western Europe Market Volume (Metric Tons) Forecast by Form, 2020-2035
  • Table 41: Western Europe Market Value (USD Million) Forecast by End Use, 2020-2035
  • Table 42: Western Europe Market Volume (Metric Tons) Forecast by End Use, 2020-2035
  • Table 43: Western Europe Market Value (USD Million) Forecast by Grade, 2020-2035
  • Table 44: Western Europe Market Volume (Metric Tons) Forecast by Grade, 2020-2035
  • Table 45: Western Europe Market Value (USD Million) Forecast by Nature, 2020-2035
  • Table 46: Western Europe Market Volume (Metric Tons) Forecast by Nature, 2020-2035
  • Table 47: Western Europe Market Value (USD Million) Forecast by Source, 2020-2035
  • Table 48: Western Europe Market Volume (Metric Tons) Forecast by Source, 2020-2035
  • Table 49: Eastern Europe Market Value (USD Million) Forecast by Country, 2020-2035
  • Table 50: Eastern Europe Market Volume (Metric Tons) Forecast by Country, 2020-2035
  • Table 51: Eastern Europe Market Value (USD Million) Forecast by Form, 2020-2035
  • Table 52: Eastern Europe Market Volume (Metric Tons) Forecast by Form, 2020-2035
  • Table 53: Eastern Europe Market Value (USD Million) Forecast by End Use, 2020-2035
  • Table 54: Eastern Europe Market Volume (Metric Tons) Forecast by End Use, 2020-2035
  • Table 55: Eastern Europe Market Value (USD Million) Forecast by Grade, 2020-2035
  • Table 56: Eastern Europe Market Volume (Metric Tons) Forecast by Grade, 2020-2035
  • Table 57: Eastern Europe Market Value (USD Million) Forecast by Nature, 2020-2035
  • Table 58: Eastern Europe Market Volume (Metric Tons) Forecast by Nature, 2020-2035
  • Table 59: Eastern Europe Market Value (USD Million) Forecast by Source, 2020-2035
  • Table 60: Eastern Europe Market Volume (Metric Tons) Forecast by Source, 2020-2035
  • Table 61: East Asia Market Value (USD Million) Forecast by Country, 2020-2035
  • Table 62: East Asia Market Volume (Metric Tons) Forecast by Country, 2020-2035
  • Table 63: East Asia Market Value (USD Million) Forecast by Form, 2020-2035
  • Table 64: East Asia Market Volume (Metric Tons) Forecast by Form, 2020-2035
  • Table 65: East Asia Market Value (USD Million) Forecast by End Use, 2020-2035
  • Table 66: East Asia Market Volume (Metric Tons) Forecast by End Use, 2020-2035
  • Table 67: East Asia Market Value (USD Million) Forecast by Grade, 2020-2035
  • Table 68: East Asia Market Volume (Metric Tons) Forecast by Grade, 2020-2035
  • Table 69: East Asia Market Value (USD Million) Forecast by Nature, 2020-2035
  • Table 70: East Asia Market Volume (Metric Tons) Forecast by Nature, 2020-2035
  • Table 71: East Asia Market Value (USD Million) Forecast by Source, 2020-2035
  • Table 72: East Asia Market Volume (Metric Tons) Forecast by Source, 2020-2035
  • Table 73: South Asia & Pacific Market Value (USD Million) Forecast by Country, 2020-2035
  • Table 74: South Asia & Pacific Market Volume (Metric Tons) Forecast by Country, 2020-2035
  • Table 75: South Asia & Pacific Market Value (USD Million) Forecast by Form, 2020-2035
  • Table 76: South Asia & Pacific Market Volume (Metric Tons) Forecast by Form, 2020-2035
  • Table 77: South Asia & Pacific Market Value (USD Million) Forecast by End Use, 2020-2035
  • Table 78: South Asia & Pacific Market Volume (Metric Tons) Forecast by End Use, 2020-2035
  • Table 79: South Asia & Pacific Market Value (USD Million) Forecast by Grade, 2020-2035
  • Table 80: South Asia & Pacific Market Volume (Metric Tons) Forecast by Grade, 2020-2035
  • Table 81: South Asia & Pacific Market Value (USD Million) Forecast by Nature, 2020-2035
  • Table 82: South Asia & Pacific Market Volume (Metric Tons) Forecast by Nature, 2020-2035
  • Table 83: South Asia & Pacific Market Value (USD Million) Forecast by Source, 2020-2035
  • Table 84: South Asia & Pacific Market Volume (Metric Tons) Forecast by Source, 2020-2035
  • Table 85: Middle East and Africa Market Value (USD Million) Forecast by Country, 2020-2035
  • Table 86: Middle East and Africa Market Volume (Metric Tons) Forecast by Country, 2020-2035
  • Table 87: Middle East and Africa Market Value (USD Million) Forecast by Form, 2020-2035
  • Table 88: Middle East and Africa Market Volume (Metric Tons) Forecast by Form, 2020-2035
  • Table 89: Middle East and Africa Market Value (USD Million) Forecast by End Use, 2020-2035
  • Table 90: Middle East and Africa Market Volume (Metric Tons) Forecast by End Use, 2020-2035
  • Table 91: Middle East and Africa Market Value (USD Million) Forecast by Grade, 2020-2035
  • Table 92: Middle East and Africa Market Volume (Metric Tons) Forecast by Grade, 2020-2035
  • Table 93: Middle East and Africa Market Value (USD Million) Forecast by Nature, 2020-2035
  • Table 94: Middle East and Africa Market Volume (Metric Tons) Forecast by Nature, 2020-2035
  • Table 95: Middle East and Africa Market Value (USD Million) Forecast by Source, 2020-2035
  • Table 96: Middle East and Africa Market Volume (Metric Tons) Forecast by Source, 2020-2035

List of Figures

  • Figure 1: Global Market Volume (Metric Tons) Forecast 2020-2035
  • Figure 2: Global Market Pricing Analysis
  • Figure 3: Global Market Value (USD Million) Forecast 2020-2035
  • Figure 4: Global Market Value Share and BPS Analysis by Form, 2025 and 2035
  • Figure 5: Global Market Y-o-Y Growth Comparison by Form, 2025-2035
  • Figure 6: Global Market Attractiveness Analysis by Form
  • Figure 7: Global Market Value Share and BPS Analysis by End Use, 2025 and 2035
  • Figure 8: Global Market Y-o-Y Growth Comparison by End Use, 2025-2035
  • Figure 9: Global Market Attractiveness Analysis by End Use
  • Figure 10: Global Market Value Share and BPS Analysis by Grade, 2025 and 2035
  • Figure 11: Global Market Y-o-Y Growth Comparison by Grade, 2025-2035
  • Figure 12: Global Market Attractiveness Analysis by Grade
  • Figure 13: Global Market Value Share and BPS Analysis by Nature, 2025 and 2035
  • Figure 14: Global Market Y-o-Y Growth Comparison by Nature, 2025-2035
  • Figure 15: Global Market Attractiveness Analysis by Nature
  • Figure 16: Global Market Value Share and BPS Analysis by Source, 2025 and 2035
  • Figure 17: Global Market Y-o-Y Growth Comparison by Source, 2025-2035
  • Figure 18: Global Market Attractiveness Analysis by Source
  • Figure 19: Global Market Value (USD Million) Share and BPS Analysis by Region, 2025 and 2035
  • Figure 20: Global Market Y-o-Y Growth Comparison by Region, 2025-2035
  • Figure 21: Global Market Attractiveness Analysis by Region
  • Figure 22: North America Market Incremental $ Opportunity, 2025-2035
  • Figure 23: Latin America Market Incremental $ Opportunity, 2025-2035
  • Figure 24: Western Europe Market Incremental $ Opportunity, 2025-2035
  • Figure 25: Eastern Europe Market Incremental $ Opportunity, 2025-2035
  • Figure 26: East Asia Market Incremental $ Opportunity, 2025-2035
  • Figure 27: South Asia & Pacific Market Incremental $ Opportunity, 2025-2035
  • Figure 28: Middle East and Africa Market Incremental $ Opportunity, 2025-2035
  • Figure 29: North America Market Value Share and BPS Analysis by Country, 2025 and 2035
  • Figure 30: North America Market Value Share and BPS Analysis by Form, 2025 and 2035
  • Figure 31: North America Market Y-o-Y Growth Comparison by Form, 2025-2035
  • Figure 32: North America Market Attractiveness Analysis by Form
  • Figure 33: North America Market Value Share and BPS Analysis by End Use, 2025 and 2035
  • Figure 34: North America Market Y-o-Y Growth Comparison by End Use, 2025-2035
  • Figure 35: North America Market Attractiveness Analysis by End Use
  • Figure 36: North America Market Value Share and BPS Analysis by Grade, 2025 and 2035
  • Figure 37: North America Market Y-o-Y Growth Comparison by Grade, 2025-2035
  • Figure 38: North America Market Attractiveness Analysis by Grade
  • Figure 39: North America Market Value Share and BPS Analysis by Nature, 2025 and 2035
  • Figure 40: North America Market Y-o-Y Growth Comparison by Nature, 2025-2035
  • Figure 41: North America Market Attractiveness Analysis by Nature
  • Figure 42: North America Market Value Share and BPS Analysis by Source, 2025 and 2035
  • Figure 43: North America Market Y-o-Y Growth Comparison by Source, 2025-2035
  • Figure 44: North America Market Attractiveness Analysis by Source
  • Figure 45: Latin America Market Value Share and BPS Analysis by Country, 2025 and 2035
  • Figure 46: Latin America Market Value Share and BPS Analysis by Form, 2025 and 2035
  • Figure 47: Latin America Market Y-o-Y Growth Comparison by Form, 2025-2035
  • Figure 48: Latin America Market Attractiveness Analysis by Form
  • Figure 49: Latin America Market Value Share and BPS Analysis by End Use, 2025 and 2035
  • Figure 50: Latin America Market Y-o-Y Growth Comparison by End Use, 2025-2035
  • Figure 51: Latin America Market Attractiveness Analysis by End Use
  • Figure 52: Latin America Market Value Share and BPS Analysis by Grade, 2025 and 2035
  • Figure 53: Latin America Market Y-o-Y Growth Comparison by Grade, 2025-2035
  • Figure 54: Latin America Market Attractiveness Analysis by Grade
  • Figure 55: Latin America Market Value Share and BPS Analysis by Nature, 2025 and 2035
  • Figure 56: Latin America Market Y-o-Y Growth Comparison by Nature, 2025-2035
  • Figure 57: Latin America Market Attractiveness Analysis by Nature
  • Figure 58: Latin America Market Value Share and BPS Analysis by Source, 2025 and 2035
  • Figure 59: Latin America Market Y-o-Y Growth Comparison by Source, 2025-2035
  • Figure 60: Latin America Market Attractiveness Analysis by Source
  • Figure 61: Western Europe Market Value Share and BPS Analysis by Country, 2025 and 2035
  • Figure 62: Western Europe Market Value Share and BPS Analysis by Form, 2025 and 2035
  • Figure 63: Western Europe Market Y-o-Y Growth Comparison by Form, 2025-2035
  • Figure 64: Western Europe Market Attractiveness Analysis by Form
  • Figure 65: Western Europe Market Value Share and BPS Analysis by End Use, 2025 and 2035
  • Figure 66: Western Europe Market Y-o-Y Growth Comparison by End Use, 2025-2035
  • Figure 67: Western Europe Market Attractiveness Analysis by End Use
  • Figure 68: Western Europe Market Value Share and BPS Analysis by Grade, 2025 and 2035
  • Figure 69: Western Europe Market Y-o-Y Growth Comparison by Grade, 2025-2035
  • Figure 70: Western Europe Market Attractiveness Analysis by Grade
  • Figure 71: Western Europe Market Value Share and BPS Analysis by Nature, 2025 and 2035
  • Figure 72: Western Europe Market Y-o-Y Growth Comparison by Nature, 2025-2035
  • Figure 73: Western Europe Market Attractiveness Analysis by Nature
  • Figure 74: Western Europe Market Value Share and BPS Analysis by Source, 2025 and 2035
  • Figure 75: Western Europe Market Y-o-Y Growth Comparison by Source, 2025-2035
  • Figure 76: Western Europe Market Attractiveness Analysis by Source
  • Figure 77: Eastern Europe Market Value Share and BPS Analysis by Country, 2025 and 2035
  • Figure 78: Eastern Europe Market Value Share and BPS Analysis by Form, 2025 and 2035
  • Figure 79: Eastern Europe Market Y-o-Y Growth Comparison by Form, 2025-2035
  • Figure 80: Eastern Europe Market Attractiveness Analysis by Form
  • Figure 81: Eastern Europe Market Value Share and BPS Analysis by End Use, 2025 and 2035
  • Figure 82: Eastern Europe Market Y-o-Y Growth Comparison by End Use, 2025-2035
  • Figure 83: Eastern Europe Market Attractiveness Analysis by End Use
  • Figure 84: Eastern Europe Market Value Share and BPS Analysis by Grade, 2025 and 2035
  • Figure 85: Eastern Europe Market Y-o-Y Growth Comparison by Grade, 2025-2035
  • Figure 86: Eastern Europe Market Attractiveness Analysis by Grade
  • Figure 87: Eastern Europe Market Value Share and BPS Analysis by Nature, 2025 and 2035
  • Figure 88: Eastern Europe Market Y-o-Y Growth Comparison by Nature, 2025-2035
  • Figure 89: Eastern Europe Market Attractiveness Analysis by Nature
  • Figure 90: Eastern Europe Market Value Share and BPS Analysis by Source, 2025 and 2035
  • Figure 91: Eastern Europe Market Y-o-Y Growth Comparison by Source, 2025-2035
  • Figure 92: Eastern Europe Market Attractiveness Analysis by Source
  • Figure 93: East Asia Market Value Share and BPS Analysis by Country, 2025 and 2035
  • Figure 94: East Asia Market Value Share and BPS Analysis by Form, 2025 and 2035
  • Figure 95: East Asia Market Y-o-Y Growth Comparison by Form, 2025-2035
  • Figure 96: East Asia Market Attractiveness Analysis by Form
  • Figure 97: East Asia Market Value Share and BPS Analysis by End Use, 2025 and 2035
  • Figure 98: East Asia Market Y-o-Y Growth Comparison by End Use, 2025-2035
  • Figure 99: East Asia Market Attractiveness Analysis by End Use
  • Figure 100: East Asia Market Value Share and BPS Analysis by Grade, 2025 and 2035
  • Figure 101: East Asia Market Y-o-Y Growth Comparison by Grade, 2025-2035
  • Figure 102: East Asia Market Attractiveness Analysis by Grade
  • Figure 103: East Asia Market Value Share and BPS Analysis by Nature, 2025 and 2035
  • Figure 104: East Asia Market Y-o-Y Growth Comparison by Nature, 2025-2035
  • Figure 105: East Asia Market Attractiveness Analysis by Nature
  • Figure 106: East Asia Market Value Share and BPS Analysis by Source, 2025 and 2035
  • Figure 107: East Asia Market Y-o-Y Growth Comparison by Source, 2025-2035
  • Figure 108: East Asia Market Attractiveness Analysis by Source
  • Figure 109: South Asia & Pacific Market Value Share and BPS Analysis by Country, 2025 and 2035
  • Figure 110: South Asia & Pacific Market Value Share and BPS Analysis by Form, 2025 and 2035
  • Figure 111: South Asia & Pacific Market Y-o-Y Growth Comparison by Form, 2025-2035
  • Figure 112: South Asia & Pacific Market Attractiveness Analysis by Form
  • Figure 113: South Asia & Pacific Market Value Share and BPS Analysis by End Use, 2025 and 2035
  • Figure 114: South Asia & Pacific Market Y-o-Y Growth Comparison by End Use, 2025-2035
  • Figure 115: South Asia & Pacific Market Attractiveness Analysis by End Use
  • Figure 116: South Asia & Pacific Market Value Share and BPS Analysis by Grade, 2025 and 2035
  • Figure 117: South Asia & Pacific Market Y-o-Y Growth Comparison by Grade, 2025-2035
  • Figure 118: South Asia & Pacific Market Attractiveness Analysis by Grade
  • Figure 119: South Asia & Pacific Market Value Share and BPS Analysis by Nature, 2025 and 2035
  • Figure 120: South Asia & Pacific Market Y-o-Y Growth Comparison by Nature, 2025-2035
  • Figure 121: South Asia & Pacific Market Attractiveness Analysis by Nature
  • Figure 122: South Asia & Pacific Market Value Share and BPS Analysis by Source, 2025 and 2035
  • Figure 123: South Asia & Pacific Market Y-o-Y Growth Comparison by Source, 2025-2035
  • Figure 124: South Asia & Pacific Market Attractiveness Analysis by Source
  • Figure 125: Middle East and Africa Market Value Share and BPS Analysis by Country, 2025 and 2035
  • Figure 126: Middle East and Africa Market Value Share and BPS Analysis by Form, 2025 and 2035
  • Figure 127: Middle East and Africa Market Y-o-Y Growth Comparison by Form, 2025-2035
  • Figure 128: Middle East and Africa Market Attractiveness Analysis by Form
  • Figure 129: Middle East and Africa Market Value Share and BPS Analysis by End Use, 2025 and 2035
  • Figure 130: Middle East and Africa Market Y-o-Y Growth Comparison by End Use, 2025-2035
  • Figure 131: Middle East and Africa Market Attractiveness Analysis by End Use
  • Figure 132: Middle East and Africa Market Value Share and BPS Analysis by Grade, 2025 and 2035
  • Figure 133: Middle East and Africa Market Y-o-Y Growth Comparison by Grade, 2025-2035
  • Figure 134: Middle East and Africa Market Attractiveness Analysis by Grade
  • Figure 135: Middle East and Africa Market Value Share and BPS Analysis by Nature, 2025 and 2035
  • Figure 136: Middle East and Africa Market Y-o-Y Growth Comparison by Nature, 2025-2035
  • Figure 137: Middle East and Africa Market Attractiveness Analysis by Nature
  • Figure 138: Middle East and Africa Market Value Share and BPS Analysis by Source, 2025 and 2035
  • Figure 139: Middle East and Africa Market Y-o-Y Growth Comparison by Source, 2025-2035
  • Figure 140: Middle East and Africa Market Attractiveness Analysis by Source
  • Figure 141: Global Market - Tier Structure Analysis
  • Figure 142: Global Market - Company Share Analysis

Frequently Asked Questions

What is the projected size of the phosphatidylserine market in 2025?

The market is valued at USD 197.6 million in 2025.

What is the outlook on phosphatidylserine demand by 2035?

The market is forecasted to reach USD 331.9 million by 2035, reflecting a CAGR of 5.3%.

Which segment leads the phosphatidylserine market by form in 2025?

Powder form will lead the form segment, accounting for 70% of the global market share in 2025.

What is the top source segment for the phosphatidylserine market in 2025?

Plant source will dominate the source segment with a 68% share in 2025.

Which country is projected to have the fastest-growing phosphatidylserine market?

Japan is projected to grow at the fastest rate, with a CAGR of 6.7% from 2025 to 2035.

Future Market Insights

Phosphatidylserine Market