Phycocyanin Market
Market Insights on Phycocyanin covering sales outlook, demand forecast & up-to-date key trends
Phycocyanin Market By Nature (Organic, Conventional), Form (Powder, Liquid), Grade (Phycocyanin E18, Phycocyanin E25, Phycocyanin E3.0) Application (Food & Beverage, Cosmetics & Personal Care, Nutraceuticals, Animal Feed, Aquaculture) & Region - Forecast to 2021 - 2031
About the Report
With growing phycocyanin applications in food and beverage, cosmetics and personal care industries due to high nutrition value of phycocyanin, the global phycocyanin market is anticipated to witness a substantial growth rate throughout the period of assessment. However, factors such as growing demand of phycocyanin due to cost efficiency, satisfactory government initiatives for the production of phycocyanin, and increasing health benefits awareness accompanied with phycocyanin making it a super food are pushing the growth of the global market.
Customer awareness is increasing regarding the use of Spirulina which is high in nutrients and used as a food source since last many years. Phycocyanin is a blue color pigment extracted from Spirulina and is utilized by manufacturers in food and beverages industry.
In its new study, ESOMAR-certified market research and consulting firm Future Market Insights (FMI) offers insights about key factors driving demand for phycocyanin. The report tracks the global sales of phycocyanin in 20+ high-growth markets, along with analyzing the impact COVID-19 has had on the food and beverage industry in general, and phycocyanin in particular.
Let us know your requirement to get
100% FREE customization
Historical and Future Outlook
Since 2013, the U.S. Food and Drug Administration (FDA) approved phyocyanin usage in food and beverage industry. In the last few years, many manufacturers have started producing phycocyanin due to the growing demand for natural and organic products. Additionally, many manufacturers have launched new and innovative colors made from phycocyanin which can propel the market to newer heights.
In 2016, phycocyanin extracted from Spirulina has become the most striking color globally and the regulatory bodies approved the utilization of phycocyanin in cosmetic and personal care industries owing to its texture and features. The European Food Safety Authority (EFSA), for food safety has banned the utilization of artificial colors in food products consumed in EU countries. This has improved growth prospects in the market.
Besides stringent regulations banning the use of artificial colors, rising awareness regarding health benefits of phycocyanin has been aiding the overall expansion. With regards to nutrition, 100 grams of phycocyanin consists of more than 60 grams of protein with various vitamins such as Vitamin A, B, C, E and K, carbohydrates, fibers with various minerals such as calcium, iron, magnesium, phosphorus, potassium, sodium, zinc and others.
Increasing awareness of harmful effects of artificial colors used in the food and beverage products has resulted in a surge in demand for more natural ingredient in the formulation of the product which is increasing the traction of phycocyanin as natural colorant in the market as key brands for food colors are going clean label and more natural.
However, phycocyanin contamination is critically affecting production, constant variations in import and export of phycocyanin and rough environment change stimulating the production of phycocyanin are disturbing the growth of the global phycocyanin market.
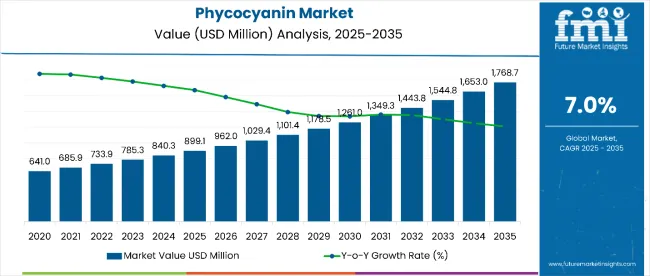
According to FMI’s analysis, phycocyanin sales have grown at 5.2% CAGR between 2016 and 2020.
Consumers’ interest is piqued in natural products, creating opportunities for products obtained from organic sources. Companies functioning in the phycocyanin market are expected to leverage this opportunity during the forecast period. Key players in phycocyanin market are greatly concentrating on research & development (R&D) activities to develop multi-functional profiles of naturally obtained phycocyanin from Spirulina which offers high health benefits.
Nowadays, manufacturers are increasingly examining phycocyanin, however, some companies have implemented new practices. Driven by trends such as incorporating anti-oxidant properties in cosmetics, new entrants within the market have been focusing on innovations. These advances present a progressive outlook for growth. FMI expects global phycocyanin market to grow at 6.8% CAGR through 2031.
Find your sweet spots for generating winning opportunities in this market.
Talk to AnalystWhy Phycocyanin is Gaining Traction in Cosmetic Industry?
Application of phycocyanin in the cosmetic industry is increasing since it contains anti-oxidant properties. Nowadays, micro-algae is been utilized for the treatment of skin problems, which includes pigment disorders, tanning and aging. Furthermore, prospects for skin whitening, anti-aging and pigmentation reducing products are considerably high and this will create lucrative growth opportunities for the market.
- For example, Kunye’s Nourish Face Mask, also known as the “green smoothie for your face” is gaining acceptance among the health conscious customers. Nourish Face Mask is an organic face mask that combines formula such as phycocyanin, wheatgrass, neem, sea kelp, and Canadian bentonite Clay.
Why Super Food is Creating Positive Buzz in the Phycocyanin Market?
Due to the growing demand for natural products, phycocyanin demand in industries such as beverage, food, animal feed, pet food, cosmetics and nutraceutical has increased. Phycocyanin is considered as super food as it is a naturally grown food with highest amount of protein. Natural health benefits of phycocyanin lowers the LDL cholesterol and raises HDL cholesterol in the body. Additionally, phycocyanin also helps in preventing medical conditions such as macular degeneration and arthritis.

An unified Market Research Subscription Platform, built for today’s disparate research needs.
What is the Regulatory Impact on Global Phycocyanin Sales?
Key manufacturers got FDA approval for the use of natural colors produced from phycocyanin in 2013. Furthermore, till the end of 2016, various companies globally were producing natural colors from phycocyanin such as green, blue, red, and brown. However, the blue color phycocyanin has become the most active color globally due to its texture and features and also primarily due to its utilization in food and beverage industry.
- FDA and EFSA have published regulations related to phycocyanin and its products which state that these products can have arsenic and lead in acceptable limits. Due to high contamination, phycocyanin products of many China-based companies are banned in 2015 and 2016 due to high soil and water pollution in China.
EFSA, the regulatory agency of EU countries has banned the utilization of synthetic color for food safety for the products that are consumed in EU countries, which subsequently promotes the growth for natural color market.
Manufacturers have also started launching new innovative colors which can change the course of action of the whole industry.
DDW Inc., a U.S. based food colorant's manufacturer launched a new blue color phycocyanin liquid with improved light stability by up to 40%.
Country-wise Insights
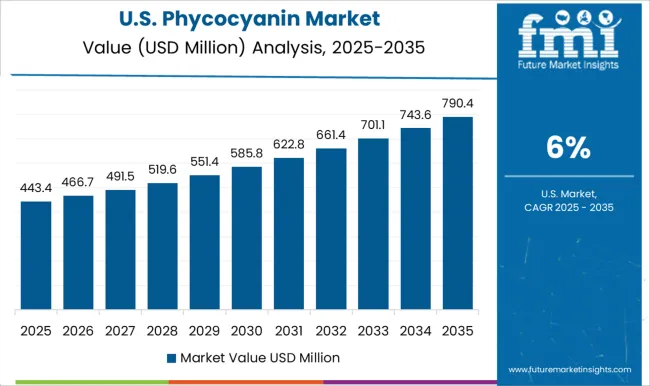
How Big is the Opportunity in U.S.?
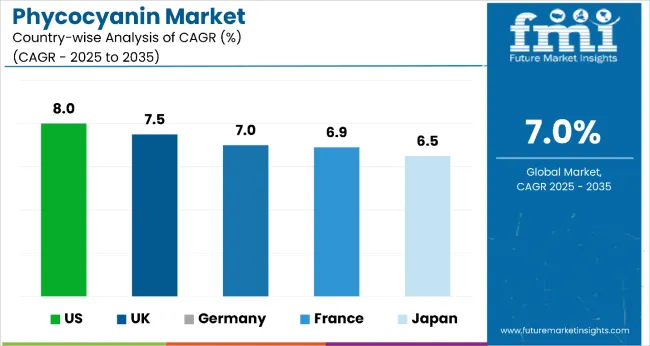
FMI has projected the U.S. to remain one of the most lucrative markets throughout the forecast period. The North America food and beverage industry remains on a steady pitch, due to stable consumer spending in the region. In the U.S., variations in the Food Safety Modernization Act (FSMA) can define that America’s food safety laws focuses less on claims of food adulteration and more on prevention of food contamination.
Rising awareness regarding the role of food in well-being of the people has made consumers in U.S. and Canada more observant towards the ingredients utilized by manufacturers. Moreover, due to inclination towards healthy foods, the North American food and beverage companies has been expanding their portfolios.
- Companies such as DDW Inc. and Cyanotech are investing increasingly in creating new products of phycocyanin which can help in strengthening of the market.
How big is the opportunity in UK for phycocyanin market?
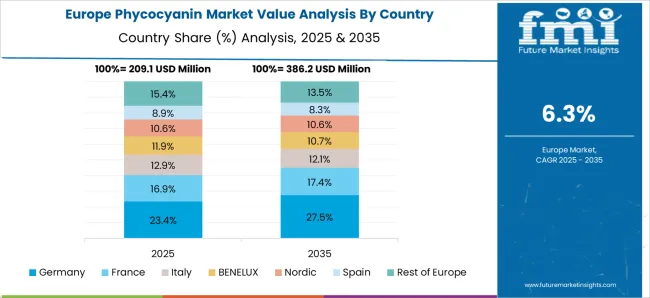
FMI has projected the U.K. to remain one of the most lucrative markets among the Europe phycocyanin market throughout the course of the forecast period. It holds14.5% market share in the European phycocyanin in 2020. The key factor supporting the growth of phycocyanin market is health concern of consumers.
- In June 2020, GNT Group, the supplier of Coloring Foods had established a variety of blue powders EXBERRY® obtained from phycocyanin with considerably greater color strength. They are offered in both micronized powder and standard form.
How big is the opportunity in Germany for phycocyanin market?
Germany remained dominant in the Europe phycocyanin market with a share of 27.1% in 2020. Some of the leading companies operating in Japan have been entering into collaborations to foster growth. This will remain one of the chief drivers.
- For instance, Ecoflora and Chr. Hansen signed exclusive partnership in 2020. The new partnership added a complimentary new blue shade to the collection of natural colors, taking new opportunities for new applications and color blends.
How big is the opportunity in China for phycocyanin?
China is one of the key markets in East Asia due to the increasing health disorders prevalence such as obesity in the country, which is attributed by the shifting consumption patterns and consumers opting for more plant-based products. China is projected to generate the substantial revenue of US$ 13.9 Mn as compared to the other countries during the forecast period of 2031.
How big is the opportunity in Japan for phycocyanin market?
The demand for phycocyanin is rising in Japan. One of the key factors supporting expansion is increasing consumer demand for natural products which is a driving factor for market, which has been encouraging leading companies focus on product launches.
- In June 2020, DIC had launched a liquid version of its Linablue® naturally derived blue food coloring.
Category Wise
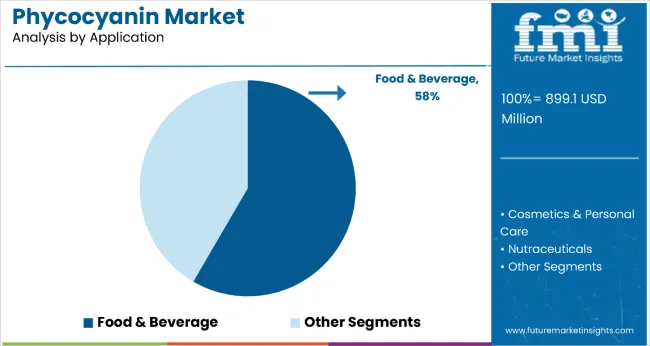
Why Food & Beverage Exhibits High Demand for Phycocyanin?
The food and beverage segment holds the largest share of the overall phycocyanin market which is attributed to the increasing consumer inclination towards ready-to-drink beverages, growing trend of substituting artificial colorants with natural ones, rising health issue awareness related with the utilization of synthetic colorants in soft drinks. Additionally, increasing demand for protein-enhanced drinks is boosting phycocyanin demand globally.
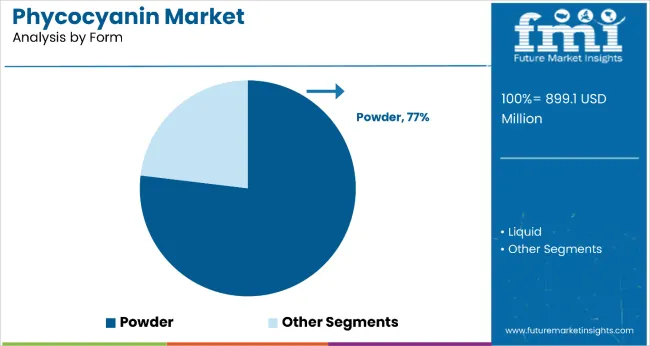
Why is Phycocyanin more preferred in Powder form?
Consumers are preferring powder form over liquid as powder allows high flexibility with dosing and offers active nutrient delivery. In powder form, the absence of water prevents the occurrence of oxidative phenomena which degrades blue protein.
Why Phycocyanin E18 Grade holds Largest Share?
Phycocyanin E18 is made up of natural food colourant as it is used in food and beverage industry in candies, frozen desserts, solid beverages, noodles etc. Additionally, is the most widely used specification in the world, with high-cost performance and excellent solubility.
Why is Organic Nature More Preferred for Phycocyanin?
Organic food has gained a large consumer base as in the last decade and has developed rapidly in developed countries. With increasing awareness, the consumer base is shifting towards organic and non-GMO products. The rapidly emerging organic food products market is driven not just by healthy eating beliefs, but also by the increasing acceptance of the opinion that producing organic foods is kinder to the planet.
Opportunities Abound in Phycocyanin Industry
Increasing utilization of phycocyanin as Spirulina in animal and fish feed industry due to the rising demand for nutritional foods is boosting the phycocyanin market growth. According to a journal A Potential Drug for Cancer Treatment phycocyanin which is extracted from marine organisms has low toxicity and high efficiency and can also be utilized as a functional food. Furthermore, it has been reported that phycocyanin has anti-oxidative properties and imitates anti-cancerous property as well. Thus, it is utilized as a potential drug and has become a new hot spot in the field of drug research. As a result, there is a mounting opportunity for consumers opting for natural products for the treatment of diseases.
Moreover, there are several technological advancements taking place in the field of phycocyanin. Few examples of the technological innovations in this filed are: launch of phycocyanin in Granule agent, gelling agent and launch of natural colors made from phycocyanin. Also, companies are developing new food and beverage products developed that can increase the nutritional value of the food as well as decrease the cost of production of various products.
Additionally, phycocyanin manufacturers are shifting their focus towards producing phycocyanin in closed environment instead of producing it in natural water bodies due to contamination issues. Industrialization has affected the environment adversely due to the waste generation during production, transport and consumption of all the products globally.
Although, the environment has no negative effect from phycocyanin production. Phycocyanin is 100% eco-friendly and bio-degradable natural product which doesn’t affect soil or air in any way. However, Spirulina grows on water and thus can create a friendly environment with water.
Competitive Landscape
Phycocyanin sales have improved in past 5 years due to changing perception among consumers towards super-food, which consists of enormous amount of nutritional contents. Moreover, one teaspoon of phycocyanin is sufficient to provide a good quantity of minerals, proteins and vitamins which is usually obtained from food consumed in a whole day.
Nowadays, manufacturers are aiming towards providing phycocyanin at an optimum cost, owing to the high demand from consumers. Companies have implemented numerous integrated production approach for delivering cost-effective products.
Recently in 2020, The Chr. Hansen application and R&D team had developed an exclusive, liquid blue that guards the color in the instant it hits the tremendously hot candy mass.
Fermentalg, a french microalgae player had sign up a multi-year technological, commercial development, and industrial contract with DDW a US industrial group to bring the natural blue color developed by Fermentalg Blue Origins, to market.
Some of the leading companies operating in the market are:
- Chr. Hansen Holding A/S
- Cyanotech Corp
- DDW Inc.
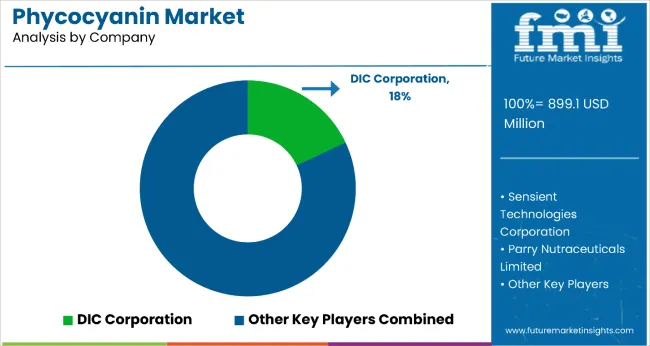
- DIC Corporation
- Dongtai City Spirulina Bio-Engineering Co., Ltd.
- Fuqing King Dnarmsa Spirulina Co., Ltd.
- GNT Holding B.V.
- Sensient Technologies Corp.
- Parry Nutraceuticals Limited
- Döhler GmbH
- Naturex S.A.
- Naturalin Bio-Resources Co., Ltd
- Far East Bio-Tec Co., Ltd.
- Fraken Biochem Co., Ltd.
*The list is not exhaustive, and only for representational purposes. Full competitive intelligence with SWOT analysis available in the report.
Scope of the Report
Attribute |
Details |
Forecast Period |
2021-2031 |
Historical Data Available for |
2016-2020 |
Market Analysis |
USD Million for Value and MT for Volume |
Key Regions Covered |
North America, Western Europe, Eastern Europe, Latin America, Japan, APEJ, MEA |
Key Countries Covered |
US, Canada, Germany, France, U.K., Spain, Italy, Rest of Western Europe, Russia, Poland, Rest of Eastern Europe, Brazil, Mexico, Rest of Latin America, Japan, China, India, Australia & New Zealand, ASEAN, Rest of APEJ, GCC Countries, South Africa, Rest of MEA |
Key Segments Covered |
Nature, Form, Grade, Application and Region |
Key Companies Profiled |
|
Report Coverage |
Market Forecast, brand share analysis, competition intelligence, Drivers, Restraints, Opportunities and Threats analysis, Key factors, Market Dynamics and Challenges, Strategic Growth Initiatives |
Customization & Pricing |
Phycocyanin Market by Category
Nature
- Organic
- Conventional
Form
- Powder
- Liquid
Grade
- Phycocyanin E18
- Phycocyanin E25
- Phycocyanin E3.0
Application
- Food & Beverage
- Confectionery
- Beverages
- Dairy Products
- Bakery Products
- Baby Food Formula
- Others
- Cosmetics & Personal Care
- Face Cream
- Moisturizers & Lotions
- Lipsticks
- Eye Liners
- Eye Shadow
- Soap
- Body Wash
- Nutraceuticals
- Animal Feed
- Aquaculture
Region
- North America
- Western Europe
- Eastern Europe
- Latin America
- Japan
- APEJ
- MEA
Frequently Asked Questions
The global phycocyanin market is estimated to grow by CAGR of 6.8% for the next 5 years.
The powder form of phycocyanin holds the dominant share in the market and is forecast to grow at 6.7% CAGR by 2031. Powder form is more preferred because it allows high flexibility with dosing and offers active nutrient delivery. In powder form, the absence of water prevents the occurrence of oxidative phenomena which degrades blue protein.
Some of the leading companies offering phycocyanin are Chr. Hansen Holding A/S, Cyanotech Corp, DDW Inc., DIC Corporation, Dongtai City Spirulina Bio-Engineering Co., Ltd., Fuqing King Dnarmsa Spirulina Co., Ltd., GNT Holding B.V., Sensient Technologies Corp., among others.
Some of the key factors supporting use of phycocyanin includes the increasing awareness about high nutrition value of Spirulina, approval of phycocyanin extracted from Spirulina for use in food and beverages by regulatory agencies, government initiative towards production of Spirulina, and launch of new varieties of natural color’s produced from Spirulina and many others.
Table of Content
1. Market Introduction
1.1. Market Coverage / Taxonomy
1.2. Market Definition / Scope / Limitations
2. Market Dynamics
2.1. Drivers
2.2. Restraints
2.3. Opportunity
2.4. Trends
2.5. Key Regulations
2.6. Market Background
2.7. Macro-Economic Factors
2.8. Forecast Factors - Relevance & Impact
2.9. Value Chain Analysis
2.10. Supply Chain Analysis
2.10.1. Raw Material Suppliers
2.10.2. Product Manufacturers
2.10.3. Distributors/Suppliers/Wholesalers
3. Global Phycocyanin Market Analysis Scenario
3.1. Historical Market Volume (Metric Tons) Analysis, 2016-2020
3.2. Current and Future Market Volume (Metric Tons) Projections, 2021-2031
3.3. Y-o-Y Growth Trend Analysis
3.4. Global Phycocyanin Market - Pricing Analysis
3.5. Regional Pricing Analysis (US$/Metric Tons) By Nature
3.6. Global Average Pricing Analysis Benchmark
3.7. Pricing Influencing Factors
4. Global Phycocyanin Market Analysis 2016-2020 and Forecast 2021-2031, By Region
4.1. Introduction
4.2. Historical Market Size (US$ Mn) and Volume Analysis By Region, 2016 - 2020
4.3. Current Market Size (US$ Mn) and Volume Analysis and Forecast By Region, 2020 - 2031
4.3.1. North America
4.3.2. Western Europe
4.3.3. Eastern Europe
4.3.4. Latin America
4.3.5. Japan
4.3.6. APEJ
4.3.7. MEA
4.4. Market Attractiveness Analysis By Region
5. Global Phycocyanin Market Analysis 2016-2020 and Forecast 2021-2031, By Nature
5.1. Introduction / Key Findings
5.2. Historical Market Size (US$ Mn) and Volume Analysis By Nature , 2016 - 2020
5.3. Current and Future Market Size (US$ Mn) and Volume Analysis and Forecast By Nature, 2020 – 2031
5.3.1. Organic
5.3.2. Conventional
5.4. Market Attractiveness Analysis By Nature
6. Global Phycocyanin Market Analysis 2016-2020 and Forecast 2021-2031, By Form
6.1. Introduction / Key Findings
6.2. Historical Market Size (US$ Mn) and Volume Analysis By Form, 2016 - 2020
6.3. Current and Future Market Size (US$ Mn) and Volume Analysis and Forecast By Form, 2020 - 2031
6.3.1. Powder
6.3.2. Liquid
6.4. Market Attractiveness Analysis By Form
7. Global Phycocyanin Market Analysis 2016-2020 and Forecast 2021-2031, By Grade
7.1. Introduction / Key Findings
7.2. Historical Market Size (US$ Mn) and Volume Analysis By Application, 2016 - 2020
7.3. Current and Future Market Size (US$ Mn) and Volume Analysis and Forecast By Grade, 2020 - 2031
7.3.1. Phycocyanin E18
7.3.2. Phycocyanin E25
7.3.3. Phycocyanin E3.0
7.4. Market Attractiveness Analysis By Application
8. Global Phycocyanin Market Analysis 2016-2020 and Forecast 2021-2031, By Application
8.1. Introduction / Key Findings
8.2. Historical Market Size (US$ Mn) and Volume Analysis By Application, 2016 - 2020
8.3. Current and Future Market Size (US$ Mn) and Volume Analysis and Forecast By Application, 2020 - 2031
8.3.1. Food & Beverage
8.3.2. Cosmetics & Personal Care
8.3.3. Nutraceuticals
8.3.4. Animal Feed
8.3.5. Aquaculture
8.4. Market Attractiveness Analysis By Application
9. North America Phycocyanin Market Analysis 2016-2020 and Forecast 2021-2031
9.1. Introduction
9.2. Historical Market Size (US$ Mn) and Volume Trend Analysis By Market Taxonomy, 2016 - 2020
9.3. Market Size (US$ Mn) and Volume Forecast By Market Taxonomy, 2020 - 2031
9.3.1. By Country
9.3.1.1. U.S.
9.3.1.2. Canada
9.3.2. By Nature
9.3.3. By Form
9.3.4. By Grade
9.3.5. By Application
9.4. Market Attractiveness Analysis
9.4.1. By Country
9.4.2. By Nature
9.4.3. By Form
9.4.4. By Grade
9.4.5. By Application
9.5. Drivers and Restraints - Impact Analysis
10. Western Europe Phycocyanin Market Analysis 2016-2020 and Forecast 2021-2031
10.1. Introduction
10.2. Historical Market Size (US$ Mn) and Volume Trend Analysis By Market Taxonomy, 2016 - 2020
10.3. Market Size (US$ Mn) and Volume Forecast By Market Taxonomy, 2020 - 2031
10.3.1. By Country
10.3.1.1. Germany
10.3.1.2. France
10.3.1.3. U.K.
10.3.1.4. Spain
10.3.1.5. Italy
10.3.1.6. Rest of Western Europe
10.3.2. By Nature
10.3.3. By Form
10.3.4. By Grade
10.3.5. By Application
10.4. Market Attractiveness Analysis
10.4.1. By Country
10.4.2. By Nature
10.4.3. By Form
10.4.4. By Grade
10.4.5. By Application
10.5. Drivers and Restraints - Impact Analysis
11. Eastern Europe Phycocyanin Market Analysis 2016-2020 and Forecast 2021-2031
11.1. Introduction
11.2. Historical Market Size (US$ Mn) and Volume Trend Analysis By Market Taxonomy, 2016 - 2020
11.3. Market Size (US$ Mn) and Volume Forecast By Market Taxonomy, 2020 - 2031
11.3.1. By Country
11.3.1.1. Russia
11.3.1.2. Poland
11.3.1.3. Rest of Eastern Europe
11.3.2. By Nature
11.3.3. By Form
11.3.4. By Grade
11.3.5. By Application
11.4. Market Attractiveness Analysis
11.4.1. By Country
11.4.2. By Nature
11.4.3. By Form
11.4.4. By Grade
11.4.5. By Application
11.5. Drivers and Restraints - Impact Analysis
12. Latin America Phycocyanin Market Analysis 2016-2020 and Forecast 2021-2031
12.1. Introduction
12.2. Historical Market Size (US$ Mn) and Volume Trend Analysis By Market Taxonomy, 2016 - 2020
12.3. Market Size (US$ Mn) and Volume Forecast By Market Taxonomy, 2020 - 2031
12.3.1. By Country
12.3.1.1. Brazil
12.3.1.2. Mexico
12.3.1.3. Rest of Latin America
12.3.2. By Nature
12.3.3. By Form
12.3.4. By Grade
12.3.5. By Application
12.4. Market Attractiveness Analysis
12.4.1. By Country
12.4.2. By Nature
12.4.3. By Form
12.4.4. By Grade
12.4.5. By Application
12.5. Drivers and Restraints - Impact Analysis
13. APEJ Phycocyanin Market Analysis 2016-2020 and Forecast 2021-2031
13.1. Introduction
13.2. Historical Market Size (US$ Mn) and Volume Trend Analysis By Market Taxonomy, 2016 - 2020
13.3. Market Size (US$ Mn) and Volume Forecast By Market Taxonomy, 2020 - 2031
13.3.1. By Country
13.3.1.1. China
13.3.1.2. India
13.3.1.3. ASEAN
13.3.1.4. Australia & New Zealand
13.3.1.5. Rest of APEJ
13.3.2. By Nature
13.3.3. By Form
13.3.4. By Grade
13.3.5. By Application
13.4. Market Attractiveness Analysis
13.4.1. By Country
13.4.2. By Nature
13.4.3. By Form
13.4.4. By Grade
13.4.5. By Application
13.5. Drivers and Restraints - Impact Analysis
14. Middle East and Africa Phycocyanin Market Analysis 2016-2020 and Forecast 2021-2031
14.1. Introduction
14.2. Historical Market Size (US$ Mn) and Volume Trend Analysis By Market Taxonomy, 2016 - 2020
14.3. Market Size (US$ Mn) and Volume Forecast By Market Taxonomy, 2020 - 2031
14.3.1. By Country
14.3.1.1. GCC Countries
14.3.1.2. South Africa
14.3.1.3. Rest of MEA
14.3.2. By Nature
14.3.3. By Form
14.3.4. By Grade
14.3.5. By Application
14.4. Market Attractiveness Analysis
14.4.1. By Country
14.4.2. By Nature
14.4.3. By Form
14.4.4. By Grade
14.4.5. By Application
14.5. Drivers and Restraints - Impact Analysis
15. Japan Phycocyanin Market Analysis 2016-2020 and Forecast 2021-2031
15.1. Introduction
15.2. Historical Market Size (US$ Mn) and Volume Trend Analysis By Market Taxonomy, 2016 - 2020
15.3. Market Size (US$ Mn) and Volume Forecast By Market Taxonomy, 2020 - 2031
15.3.1. By Country
15.3.2. By Nature
15.3.3. By Form
15.3.4. By Grade
15.3.5. By Application
15.4. Market Attractiveness Analysis
15.4.1. By Country
15.4.2. By Nature
15.4.3. By Form
15.4.4. By Grade
15.4.5. By Application
15.5. Drivers and Restraints - Impact Analysis
16. Competition Landscape
16.1. Global Phycocyanin Market Competition - a Dashboard View
16.2. Global Phycocyanin Market Structure Analysis
16.3. Global Phycocyanin Market Company Share Analysis
16.3.1. Company Market Share Analysis of Top 10 Players, By Region
16.3.2. Company Market Share Analysis of Top 10 Players, By Nature
16.4. Key Participants Market Presence (Intensity Mapping) by Region
16.5. Competition Analysis
16.6. Competition Dashboard
16.7. Competition Benchmarking
16.8. Competition Deep Dive
16.8.1. Chr. Hansen Holding A/S
16.8.1.1. Overview
16.8.1.2. Product Portfolio
16.8.1.3. Key Developments/Key Takeaways
16.8.1.4. Strategy Overview
16.8.1.5. Financial Overview
16.8.2. Cyanotech Corp
16.8.2.1. Overview
16.8.2.2. Product Portfolio
16.8.2.3. Key Developments/Key Takeaways
16.8.2.4. Strategy Overview
16.8.2.5. Financial Overview
16.8.3. DDW Inc.
16.8.3.1. Overview
16.8.3.2. Product Portfolio
16.8.3.3. Key Developments/Key Takeaways
16.8.3.4. Strategy Overview
16.8.3.5. Financial Overview
16.8.4. DIC Corporation
16.8.4.1. Overview
16.8.4.2. Product Portfolio
16.8.4.3. Key Developments/Key Takeaways
16.8.4.4. Strategy Overview
16.8.4.5. Financial Overview
16.8.5. Dongtai City Spirulina Bio-Engineering Co., Ltd.
16.8.5.1. Overview
16.8.5.2. Product Portfolio
16.8.5.3. Key Developments/Key Takeaways
16.8.5.4. Strategy Overview
16.8.5.5. Financial Overview
16.8.6. Fuqing King Dnarmsa Spirulina Co., Ltd.
16.8.6.1. Overview
16.8.6.2. Product Portfolio
16.8.6.3. Key Developments/Key Takeaways
16.8.6.4. Strategy Overview
16.8.6.5. Financial Overview
16.8.7. GNT Holding B.V.
16.8.7.1. Overview
16.8.7.2. Product Portfolio
16.8.7.3. Key Developments/Key Takeaways
16.8.7.4. Strategy Overview
16.8.7.5. Financial Overview
16.8.8. Sensient Technologies Corp.
16.8.8.1. Overview
16.8.8.2. Product Portfolio
16.8.8.3. Key Developments/Key Takeaways
16.8.8.4. Strategy Overview
16.8.8.5. Financial Overview
16.8.9. Parry Nutraceuticals Limited
16.8.9.1. Overview
16.8.9.2. Product Portfolio
16.8.9.3. Key Developments/Key Takeaways
16.8.9.4. Strategy Overview
16.8.9.5. Financial Overview
16.8.10. Döhler GmbH
16.8.10.1. Overview
16.8.10.2. Product Portfolio
16.8.10.3. Key Developments/Key Takeaways
16.8.10.4. Strategy Overview
16.8.10.5. Financial Overview
16.8.11. Naturex S.A.
16.8.11.1. Overview
16.8.11.2. Product Portfolio
16.8.11.3. Key Developments/Key Takeaways
16.8.11.4. Strategy Overview
16.8.11.5. Financial Overview
16.8.12. Naturalin Bio-Resources Co., Ltd
16.8.12.1. Overview
16.8.12.2. Product Portfolio
16.8.12.3. Key Developments/Key Takeaways
16.8.12.4. Strategy Overview
16.8.12.5. Financial Overview
16.8.13. Far East Bio-Tec Co., Ltd.
16.8.13.1. Overview
16.8.13.2. Product Portfolio
16.8.13.3. Key Developments/Key Takeaways
16.8.13.4. Strategy Overview
16.8.13.5. Financial Overview
16.8.14. Fraken Biochem Co., Ltd.
16.8.14.1. Overview
16.8.14.2. Product Portfolio
16.8.14.3. Key Developments/Key Takeaways
16.8.14.4. Strategy Overview
16.8.14.5. Financial Overview
16.8.15. Others
16.8.15.1. Overview
16.8.15.2. Product Portfolio
16.8.15.3. Key Developments/Key Takeaways
16.8.15.4. Strategy Overview
16.8.15.5. Financial Overview
17. Research Methodology
Let us know your requirement to get
100% FREE customization
List of Tables
Table 1: Global Phycocyanin Market Value (US$ Mn) and Forecast By Region, 2016–2020
Table 2: Global Phycocyanin Market Value (US$ Mn) and Forecast By Region, 2021–2031
Table 3: Global Phycocyanin Market Volume (Metric Tons) and Forecast By Region, 2016–2020
Table 4: Global Phycocyanin Market Volume (Metric Tons) and Forecast By Region, 2021–2031
Table 5: Global Phycocyanin Market Value (US$ Mn) and Forecast By Nature, 2016–2020
Table 6: Global Phycocyanin Market Value (US$ Mn) and Forecast By Nature, 2021–2031
Table 7: Global Phycocyanin Market Volume (Metric Tons) and Forecast By Nature, 2016–2020
Table 8: Global Phycocyanin Market Volume (Metric Tons) and Forecast By Nature, 2021–2031
Table 9: Global Phycocyanin Market Value (US$ Mn) and Forecast By Form, 2016–2020
Table 10: Global Phycocyanin Market Value (US$ Mn) and Forecast By Form, 2021–2031
Table 11: Global Phycocyanin Market Volume (Metric Tons) and Forecast By Form, 2016–2020
Table 12: Global Phycocyanin Market Volume (Metric Tons) and Forecast By Form, 2021–2031
Table 13: Global Phycocyanin Market Value (US$ Mn) and Forecast By Grade, 2016–2020
Table 14: Global Phycocyanin Market Value (US$ Mn) and Forecast By Grade, 2021–2031
Table 15: Global Phycocyanin Market Volume (Metric Tons) and Forecast By Grade, 2016–2020
Table 16: Global Phycocyanin Market Volume (Metric Tons) and Forecast By Grade, 2021–2031
Table 17: Global Phycocyanin Market Value (US$ Mn) and Forecast By Application, 2016–2020
Table 18: Global Phycocyanin Market Value (US$ Mn) and Forecast By Application, 2021–2031
Table 19: Global Phycocyanin Market Volume (Metric Tons) and Forecast By Application, 2016–2020
Table 20: Global Phycocyanin Market Volume (Metric Tons) and Forecast By Application, 2021–2031
Table 21: North America Phycocyanin Market Value (US$ Mn) and Forecast By Country, 2016–2020
Table 22: North America Phycocyanin Market Value (US$ Mn) and Forecast By Country, 2021–2031
Table 23: North America Phycocyanin Market Volume (Metric Tons) and Forecast By Country, 2016–2020
Table 24: North America Phycocyanin Market Volume (Metric Tons) and Forecast By Country, 2021–2031
Table 25: North America Phycocyanin Market Value (US$ Mn) and Forecast By Nature, 2016–2020
Table 26: North America Phycocyanin Market Value (US$ Mn) and Forecast By Nature, 2021–2031
Table 27: North America Phycocyanin Market Volume (Metric Tons) and Forecast By Nature, 2016–2020
Table 28: North America Phycocyanin Market Volume (Metric Tons) and Forecast By Nature, 2021–2031
Table 29: North America Phycocyanin Market Value (US$ Mn) and Forecast By Form, 2016–2020
Table 30: North America Phycocyanin Market Value (US$ Mn) and Forecast By Form, 2021–2031
Table 31: North America Phycocyanin Market Volume (Metric Tons) and Forecast By Form, 2016–2020
Table 32: North America Phycocyanin Market Volume (Metric Tons) and Forecast By Form, 2021–2031
Table 33: North America Phycocyanin Market Value (US$ Mn) and Forecast By Grade, 2016–2020
Table 34: North America Phycocyanin Market Value (US$ Mn) and Forecast By Grade, 2021–2031
Table 35: North America Phycocyanin Market Volume (Metric Tons) and Forecast By Grade, 2016–2020
Table 36: North America Phycocyanin Market Volume (Metric Tons) and Forecast By Grade, 2021–2031
Table 37: North America Phycocyanin Market Value (US$ Mn) and Forecast By Application, 2016–2020
Table 38: North America Phycocyanin Market Value (US$ Mn) and Forecast By Application, 2021–2031
Table 39: North America Phycocyanin Market Volume (Metric Tons) and Forecast By Application, 2016–2020
Table 40: North America Phycocyanin Market Volume (Metric Tons) and Forecast By Application, 2021–2031
Table 41: Western Europe Phycocyanin Market Value (US$ Mn) and Forecast By Country, 2016–2020
Table 42: Western Europe Phycocyanin Market Value (US$ Mn) and Forecast By Country, 2021–2031
Table 43: Western Europe Phycocyanin Market Volume (Metric Tons) and Forecast By Country, 2016–2020
Table 44: Western Europe Phycocyanin Market Volume (Metric Tons) and Forecast By Country, 2021–2031
Table 45: Western Europe Phycocyanin Market Value (US$ Mn) and Forecast By Nature, 2016–2020
Table 46: Western Europe Phycocyanin Market Value (US$ Mn) and Forecast By Nature, 2021–2031
Table 47: Western Europe Phycocyanin Market Volume (Metric Tons) and Forecast By Nature, 2016–2020
Table 48: Western Europe Phycocyanin Market Volume (Metric Tons) and Forecast By Nature, 2021–2031
Table 49: Western Europe Phycocyanin Market Value (US$ Mn) and Forecast By Form, 2016–2020
Table 50: Western Europe Phycocyanin Market Value (US$ Mn) and Forecast By Form, 2021–2031
Table 51: Western Europe Phycocyanin Market Volume (Metric Tons) and Forecast By Form, 2016–2020
Table 52: Western Europe Phycocyanin Market Volume (Metric Tons) and Forecast By Form, 2021–2031
Table 53: Western Europe Phycocyanin Market Value (US$ Mn) and Forecast By Grade, 2016–2020
Table 54: Western Europe Phycocyanin Market Value (US$ Mn) and Forecast By Grade, 2021–2031
Table 55: Western Europe Phycocyanin Market Volume (Metric Tons) and Forecast By Grade, 2016–2020
Table 56: Western Europe Phycocyanin Market Volume (Metric Tons) and Forecast By Grade, 2021–2031
Table 57: Western Europe Phycocyanin Market Value (US$ Mn) and Forecast By Application, 2016–2020
Table 58: Western Europe Phycocyanin Market Value (US$ Mn) and Forecast By Application, 2021–2031
Table 59: Western Europe Phycocyanin Market Volume (Metric Tons) and Forecast By Application, 2016–2020
Table 60: Western Europe Phycocyanin Market Volume (Metric Tons) and Forecast By Application, 2021–2031
Table 61: Eastern Europe Phycocyanin Market Value (US$ Mn) and Forecast By Country, 2016–2020
Table 62: Eastern Europe Phycocyanin Market Value (US$ Mn) and Forecast By Country, 2021–2031
Table 63: Eastern Europe Phycocyanin Market Volume (Metric Tons) and Forecast By Country, 2016–2020
Table 64: Eastern Europe Phycocyanin Market Volume (Metric Tons) and Forecast By Country, 2021–2031
Table 65: Eastern Europe Phycocyanin Market Value (US$ Mn) and Forecast By Nature, 2016–2020
Table 66: Eastern Europe Phycocyanin Market Value (US$ Mn) and Forecast By Nature, 2021–2031
Table 67: Eastern Europe Phycocyanin Market Volume (Metric Tons) and Forecast By Nature, 2016–2020
Table 68: Eastern Europe Phycocyanin Market Volume (Metric Tons) and Forecast By Nature, 2021–2031
Table 69: Eastern Europe Phycocyanin Market Value (US$ Mn) and Forecast By Form, 2016–2020
Table 70: Eastern Europe Phycocyanin Market Value (US$ Mn) and Forecast By Form, 2021–2031
Table 71: Eastern Europe Phycocyanin Market Volume (Metric Tons) and Forecast By Form, 2016–2020
Table 72: Eastern Europe Phycocyanin Market Volume (Metric Tons) and Forecast By Form, 2021–2031
Table 73: Eastern Europe Phycocyanin Market Value (US$ Mn) and Forecast By Grade, 2016–2020
Table 74: Eastern Europe Phycocyanin Market Value (US$ Mn) and Forecast By Grade, 2021–2031
Table 75: Eastern Europe Phycocyanin Market Volume (Metric Tons) and Forecast By Grade, 2016–2020
Table 76: Eastern Europe Phycocyanin Market Volume (Metric Tons) and Forecast By Grade, 2021–2031
Table 77: Eastern Europe Phycocyanin Market Value (US$ Mn) and Forecast By Application, 2016–2020
Table 78: Eastern Europe Phycocyanin Market Value (US$ Mn) and Forecast By Application, 2021–2031
Table 79: Eastern Europe Phycocyanin Market Volume (Metric Tons) and Forecast By Application, 2016–2020
Table 80: Eastern Europe Phycocyanin Market Volume (Metric Tons) and Forecast By Application, 2021–2031
Table 81: Latin America Phycocyanin Market Value (US$ Mn) and Forecast By Country, 2016–2020
Table 82: Latin America Phycocyanin Market Value (US$ Mn) and Forecast By Country, 2021–2031
Table 83: Latin America Phycocyanin Market Volume (Metric Tons) and Forecast By Country, 2016–2020
Table 84: Latin America Phycocyanin Market Volume (Metric Tons) and Forecast By Country, 2021–2031
Table 85: Latin America Phycocyanin Market Value (US$ Mn) and Forecast By Nature, 2016–2020
Table 86: Latin America Phycocyanin Market Value (US$ Mn) and Forecast By Nature, 2021–2031
Table 87: Latin America Phycocyanin Market Volume (Metric Tons) and Forecast By Nature, 2016–2020
Table 88: Latin America Phycocyanin Market Volume (Metric Tons) and Forecast By Nature, 2021–2031
Table 89: Latin America Phycocyanin Market Value (US$ Mn) and Forecast By Form, 2016–2020
Table 90: Latin America Phycocyanin Market Value (US$ Mn) and Forecast By Form, 2021–2031
Table 91: Latin America Phycocyanin Market Volume (Metric Tons) and Forecast By Form, 2016–2020
Table 92: Latin America Phycocyanin Market Volume (Metric Tons) and Forecast By Form, 2021–2031
Table 93: Latin America Phycocyanin Market Value (US$ Mn) and Forecast By Grade, 2016–2020
Table 94: Latin America Phycocyanin Market Value (US$ Mn) and Forecast By Grade, 2021–2031
Table 95: Latin America Phycocyanin Market Volume (Metric Tons) and Forecast By Grade, 2016–2020
Table 96: Latin America Phycocyanin Market Volume (Metric Tons) and Forecast By Grade, 2021–2031
Table 97: Latin America Phycocyanin Market Value (US$ Mn) and Forecast By Application, 2016–2020
Table 98: Latin America Phycocyanin Market Value (US$ Mn) and Forecast By Application, 2021–2031
Table 99: Latin America Phycocyanin Market Volume (Metric Tons) and Forecast By Application, 2016–2020
Table 100: Latin America Phycocyanin Market Volume (Metric Tons) and Forecast By Application, 2021–2031
Table 101: Japan Phycocyanin Market Value (US$ Mn) and Forecast By Country, 2016–2020
Table 102: Japan Phycocyanin Market Value (US$ Mn) and Forecast By Country, 2021–2031
Table 103: Japan Phycocyanin Market Volume (Metric Tons) and Forecast By Country, 2016–2020
Table 104: Japan Phycocyanin Market Volume (Metric Tons) and Forecast By Country, 2021–2031
Table 105: Japan Phycocyanin Market Value (US$ Mn) and Forecast By Nature, 2016–2020
Table 106: Japan Phycocyanin Market Value (US$ Mn) and Forecast By Nature, 2021–2031
Table 107: Japan Phycocyanin Market Volume (Metric Tons) and Forecast By Nature, 2016–2020
Table 108: Japan Phycocyanin Market Volume (Metric Tons) and Forecast By Nature, 2021–2031
Table 109: Japan Phycocyanin Market Value (US$ Mn) and Forecast By Form, 2016–2020
Table 110: Japan Phycocyanin Market Value (US$ Mn) and Forecast By Form, 2021–2031
Table 111: Japan Phycocyanin Market Volume (Metric Tons) and Forecast By Form, 2016–2020
Table 112: Japan Phycocyanin Market Volume (Metric Tons) and Forecast By Form, 2021–2031
Table 113: Japan Phycocyanin Market Value (US$ Mn) and Forecast By Grade, 2016–2020
Table 114: Japan Phycocyanin Market Value (US$ Mn) and Forecast By Grade, 2021–2031
Table 115: Japan Phycocyanin Market Volume (Metric Tons) and Forecast By Grade, 2016–2020
Table 116: Japan Phycocyanin Market Volume (Metric Tons) and Forecast By Grade, 2021–2031
Table 117: Japan Phycocyanin Market Value (US$ Mn) and Forecast By Application, 2016–2020
Table 118: Japan Phycocyanin Market Value (US$ Mn) and Forecast By Application, 2021–2031
Table 119: Japan Phycocyanin Market Volume (Metric Tons) and Forecast By Application, 2016–2020
Table 120: Japan Phycocyanin Market Volume (Metric Tons) and Forecast By Application, 2021–2031
Table 121: APEJ Phycocyanin Market Value (US$ Mn) and Forecast By Country, 2016–2020
Table 122: APEJ Phycocyanin Market Value (US$ Mn) and Forecast By Country, 2021–2031
Table 123: APEJ Phycocyanin Market Volume (Metric Tons) and Forecast By Country, 2016–2020
Table 124: APEJ Phycocyanin Market Volume (Metric Tons) and Forecast By Country, 2021–2031
Table 125: APEJ Phycocyanin Market Value (US$ Mn) and Forecast By Nature, 2016–2020
Table 126: APEJ Phycocyanin Market Value (US$ Mn) and Forecast By Nature, 2021–2031
Table 127: APEJ Phycocyanin Market Volume (Metric Tons) and Forecast By Nature, 2016–2020
Table 128: APEJ Phycocyanin Market Volume (Metric Tons) and Forecast By Nature, 2021–2031
Table 129: APEJ Phycocyanin Market Value (US$ Mn) and Forecast By Form, 2016–2020
Table 130: APEJ Phycocyanin Market Value (US$ Mn) and Forecast By Form, 2021–2031
Table 131: APEJ Phycocyanin Market Volume (Metric Tons) and Forecast By Form, 2016–2020
Table 132: APEJ Phycocyanin Market Volume (Metric Tons) and Forecast By Form, 2021–2031
Table 133: APEJ Phycocyanin Market Value (US$ Mn) and Forecast By Grade, 2016–2020
Table 134: APEJ Phycocyanin Market Value (US$ Mn) and Forecast By Grade, 2021–2031
Table 135: APEJ Phycocyanin Market Volume (Metric Tons) and Forecast By Grade, 2016–2020
Table 136: APEJ Phycocyanin Market Volume (Metric Tons) and Forecast By Grade, 2021–2031
Table 137: APEJ Phycocyanin Market Value (US$ Mn) and Forecast By Application, 2016–2020
Table 138: APEJ Phycocyanin Market Value (US$ Mn) and Forecast By Application, 2021–2031
Table 139: APEJ Phycocyanin Market Volume (Metric Tons) and Forecast By Application, 2016–2020
Table 140: APEJ Phycocyanin Market Volume (Metric Tons) and Forecast By Application, 2021–2031
Table 141: MEA Phycocyanin Market Value (US$ Mn) and Forecast By Country, 2016–2020
Table 142: MEA Phycocyanin Market Value (US$ Mn) and Forecast By Country, 2021–2031
Table 143: MEA Phycocyanin Market Volume (Metric Tons) and Forecast By Country, 2016–2020
Table 144: MEA Phycocyanin Market Volume (Metric Tons) and Forecast By Country, 2021–2031
Table 145: MEA Phycocyanin Market Value (US$ Mn) and Forecast By Nature, 2016–2020
Table 146: MEA Phycocyanin Market Value (US$ Mn) and Forecast By Nature, 2021–2031
Table 147: MEA Phycocyanin Market Volume (Metric Tons) and Forecast By Nature, 2016–2020
Table 148: MEA Phycocyanin Market Volume (Metric Tons) and Forecast By Nature, 2021–2031
Table 149: MEA Phycocyanin Market Value (US$ Mn) and Forecast By Form, 2016–2020
Table 150: MEA Phycocyanin Market Value (US$ Mn) and Forecast By Form, 2021–2031
Table 151: MEA Phycocyanin Market Volume (Metric Tons) and Forecast By Form, 2016–2020
Table 152: MEA Phycocyanin Market Volume (Metric Tons) and Forecast By Form, 2021–2031
Table 153: MEA Phycocyanin Market Value (US$ Mn) and Forecast By Grade, 2016–2020
Table 154: MEA Phycocyanin Market Value (US$ Mn) and Forecast By Grade, 2021–2031
Table 155: MEA Phycocyanin Market Volume (Metric Tons) and Forecast By Grade, 2016–2020
Table 156: MEA Phycocyanin Market Volume (Metric Tons) and Forecast By Grade, 2021–2031
Table 157: MEA Phycocyanin Market Value (US$ Mn) and Forecast By Application, 2016–2020
Table 158: MEA Phycocyanin Market Value (US$ Mn) and Forecast By Application, 2021–2031
Table 159: MEA Phycocyanin Market Volume (Metric Tons) and Forecast By Application, 2016–2020
Table 160: MEA Phycocyanin Market Volume (Metric Tons) and Forecast By Application, 2021–2031
Find your sweet spots for generating winning opportunities in this market.
Talk to AnalystList of Charts
Figure 1: Global Phycocyanin Market Value Share (%) and BPS Analysis By Region, 2016 & 2021 & 2031
Figure 2: Global Phycocyanin Market Y-o-Y Analysis By Region, 2021 to 2031
Figure 3: Global Phycocyanin Market Attractiveness, By Region, 2021 to 2031
Figure 4: Global Phycocyanin Market Value Share (%) and BPS Analysis By Nature, 2016 & 2021 & 2031
Figure 5: Global Phycocyanin Market Y-o-Y Analysis By Nature, 2021 to 2031
Figure 6: Global Phycocyanin Market Attractiveness, By Nature, 2021 to 2031
Figure 7: Global Phycocyanin Market Value Share (%) and BPS Analysis By Form, 2016 & 2021 & 2031
Figure 8: Global Phycocyanin Market Y-o-Y Analysis By Form, 2021 to 2031
Figure 9: Global Phycocyanin Market Attractiveness, By Form, 2021 to 2031
Figure 10: Global Phycocyanin Market Value Share (%) and BPS Analysis By Grade, 2016 & 2021 & 2031
Figure 11: Global Phycocyanin Market Y-o-Y Analysis By Grade, 2021 to 2031
Figure 12: Global Phycocyanin Market Attractiveness, By Grade, 2021 to 2031
Figure 13: Global Phycocyanin Market Value Share (%) and BPS Analysis By Application, 2016 & 2021 & 2031
Figure 14: Global Phycocyanin Market Y-o-Y Analysis By Application, 2021 to 2031
Figure 15: Global Phycocyanin Market Attractiveness, By Application, 2021 to 2031
Figure 16: North America Phycocyanin Market Value Share (%) and BPS Analysis By Country, 2016 & 2021 & 2031
Figure 17: North America Phycocyanin Market Y-o-Y Analysis By Country, 2021 to 2031
Figure 18: North America Phycocyanin Market Attractiveness, By Country, 2021 to 2031
Figure 19: North America Phycocyanin Market Value Share (%) and BPS Analysis By Nature, 2016 & 2021 & 2031
Figure 20: North America Phycocyanin Market Y-o-Y Analysis By Nature, 2021 to 2031
Figure 21: North America Phycocyanin Market Attractiveness, By Nature, 2021 to 2031
Figure 22: North America Phycocyanin Market Value Share (%) and BPS Analysis By Form, 2016 & 2021 & 2031
Figure 23: North America Phycocyanin Market Y-o-Y Analysis By Form, 2021 to 2031
Figure 24: North America Phycocyanin Market Attractiveness, By Form, 2021 to 2031
Figure 25: North America Phycocyanin Market Value Share (%) and BPS Analysis By Grade, 2016 & 2021 & 2031
Figure 26: North America Phycocyanin Market Y-o-Y Analysis By Grade, 2021 to 2031
Figure 27: North America Phycocyanin Market Attractiveness, By Grade, 2021 to 2031
Figure 28: North America Phycocyanin Market Value Share (%) and BPS Analysis By Application, 2016 & 2021 & 2031
Figure 29: North America Phycocyanin Market Y-o-Y Analysis By Application, 2021 to 2031
Figure 30: North America Phycocyanin Market Attractiveness, By Application, 2021 to 2031
Figure 31: Western Europe Phycocyanin Market Value Share (%) and BPS Analysis By Country, 2016 & 2021 & 2031
Figure 32: Western Europe Phycocyanin Market Y-o-Y Analysis By Country, 2021 to 2031
Figure 33: Western Europe Phycocyanin Market Attractiveness, By Country, 2021 to 2031
Figure 34: Western Europe Phycocyanin Market Value Share (%) and BPS Analysis By Nature, 2016 & 2021 & 2031
Figure 35: Western Europe Phycocyanin Market Y-o-Y Analysis By Nature, 2021 to 2031
Figure 36: Western Europe Phycocyanin Market Attractiveness, By Nature, 2021 to 2031
Figure 37: Western Europe Phycocyanin Market Value Share (%) and BPS Analysis By Form, 2016 & 2021 & 2031
Figure 38: Western Europe Phycocyanin Market Y-o-Y Analysis By Form, 2021 to 2031
Figure 39: Western Europe Phycocyanin Market Attractiveness, By Form, 2021 to 2031
Figure 40: Western Europe Phycocyanin Market Value Share (%) and BPS Analysis By Grade, 2016 & 2021 & 2031
Figure 41: Western Europe Phycocyanin Market Y-o-Y Analysis By Grade, 2021 to 2031
Figure 42: Western Europe Phycocyanin Market Attractiveness, By Grade, 2021 to 2031
Figure 43: Western Europe Phycocyanin Market Value Share (%) and BPS Analysis By Application, 2016 & 2021 & 2031
Figure 44: Western Europe Phycocyanin Market Y-o-Y Analysis By Application, 2021 to 2031
Figure 45: Western Europe Phycocyanin Market Attractiveness, By Application, 2021 to 2031
Figure 46: Eastern Europe Phycocyanin Market Value Share (%) and BPS Analysis By Country, 2016 & 2021 & 2031
Figure 47: Eastern Europe Phycocyanin Market Y-o-Y Analysis By Country, 2021 to 2031
Figure 48: Eastern Europe Phycocyanin Market Attractiveness, By Country, 2021 to 2031
Figure 49: Eastern Europe Phycocyanin Market Value Share (%) and BPS Analysis By Nature, 2016 & 2021 & 2031
Figure 50: Eastern Europe Phycocyanin Market Y-o-Y Analysis By Nature, 2021 to 2031
Figure 51: Eastern Europe Phycocyanin Market Attractiveness, By Nature, 2021 to 2031
Figure 52: Eastern Europe Phycocyanin Market Value Share (%) and BPS Analysis By Form, 2016 & 2021 & 2031
Figure 53: Eastern Europe Phycocyanin Market Y-o-Y Analysis By Form, 2021 to 2031
Figure 54: Eastern Europe Phycocyanin Market Attractiveness, By Form, 2021 to 2031
Figure 55: Eastern Europe Phycocyanin Market Value Share (%) and BPS Analysis By Grade, 2016 & 2021 & 2031
Figure 56: Eastern Europe Phycocyanin Market Y-o-Y Analysis By Grade, 2021 to 2031
Figure 57: Eastern Europe Phycocyanin Market Attractiveness, By Grade, 2021 to 2031
Figure 58: Eastern Europe Phycocyanin Market Value Share (%) and BPS Analysis By Application, 2016 & 2021 & 2031
Figure 59: Eastern Europe Phycocyanin Market Y-o-Y Analysis By Application, 2021 to 2031
Figure 60: Eastern Europe Phycocyanin Market Attractiveness, By Application, 2021 to 2031
Figure 61: Latin America Phycocyanin Market Value Share (%) and BPS Analysis By Country, 2016 & 2021 & 2031
Figure 62: Latin America Phycocyanin Market Y-o-Y Analysis By Country, 2021 to 2031
Figure 63: Latin America Phycocyanin Market Attractiveness, By Country, 2021 to 2031
Figure 64: Latin America Phycocyanin Market Value Share (%) and BPS Analysis By Nature, 2016 & 2021 & 2031
Figure 65: Latin America Phycocyanin Market Y-o-Y Analysis By Nature, 2021 to 2031
Figure 66: Latin America Phycocyanin Market Attractiveness, By Nature, 2021 to 2031
Figure 67: Latin America Phycocyanin Market Value Share (%) and BPS Analysis By Form, 2016 & 2021 & 2031
Figure 68: Latin America Phycocyanin Market Y-o-Y Analysis By Form, 2021 to 2031
Figure 69: Latin America Phycocyanin Market Attractiveness, By Form, 2021 to 2031
Figure 70: Latin America Phycocyanin Market Value Share (%) and BPS Analysis By Grade, 2016 & 2021 & 2031
Figure 71: Latin America Phycocyanin Market Y-o-Y Analysis By Grade, 2021 to 2031
Figure 72: Latin America Phycocyanin Market Attractiveness, By Grade, 2021 to 2031
Figure 73: Latin America Phycocyanin Market Value Share (%) and BPS Analysis By Application, 2016 & 2021 & 2031
Figure 74: Latin America Phycocyanin Market Y-o-Y Analysis By Application, 2021 to 2031
Figure 75: Latin America Phycocyanin Market Attractiveness, By Application, 2021 to 2031
Figure 76: Japan Phycocyanin Market Value Share (%) and BPS Analysis By Country, 2016 & 2021 & 2031
Figure 77: Japan Phycocyanin Market Y-o-Y Analysis By Country, 2021 to 2031
Figure 78: Japan Phycocyanin Market Attractiveness, By Country, 2021 to 2031
Figure 79: Japan Phycocyanin Market Value Share (%) and BPS Analysis By Nature, 2016 & 2021 & 2031
Figure 80: Japan Phycocyanin Market Y-o-Y Analysis By Nature, 2021 to 2031
Figure 81: Japan Phycocyanin Market Attractiveness, By Nature, 2021 to 2031
Figure 82: Japan Phycocyanin Market Value Share (%) and BPS Analysis By Form, 2016 & 2021 & 2031
Figure 83: Japan Phycocyanin Market Y-o-Y Analysis By Form, 2021 to 2031
Figure 84: Japan Phycocyanin Market Attractiveness, By Form, 2021 to 2031
Figure 85: Japan Phycocyanin Market Value Share (%) and BPS Analysis By Grade, 2016 & 2021 & 2031
Figure 86: Japan Phycocyanin Market Y-o-Y Analysis By Grade, 2021 to 2031
Figure 87: Japan Phycocyanin Market Attractiveness, By Grade, 2021 to 2031
Figure 88: Japan Phycocyanin Market Value Share (%) and BPS Analysis By Application, 2016 & 2021 & 2031
Figure 89: Japan Phycocyanin Market Y-o-Y Analysis By Application, 2021 to 2031
Figure 90: Japan Phycocyanin Market Attractiveness, By Application, 2021 to 2031
Figure 91: APEJ Phycocyanin Market Value Share (%) and BPS Analysis By Country, 2016 & 2021 & 2031
Figure 92: APEJ Phycocyanin Market Y-o-Y Analysis By Country, 2021 to 2031
Figure 93: APEJ Phycocyanin Market Attractiveness, By Country, 2021 to 2031
Figure 94: APEJ Phycocyanin Market Value Share (%) and BPS Analysis By Nature, 2016 & 2021 & 2031
Figure 95: APEJ Phycocyanin Market Y-o-Y Analysis By Nature, 2021 to 2031
Figure 96: APEJ Phycocyanin Market Attractiveness, By Nature, 2021 to 2031
Figure 97: APEJ Phycocyanin Market Value Share (%) and BPS Analysis By Form, 2016 & 2021 & 2031
Figure 98: APEJ Phycocyanin Market Y-o-Y Analysis By Form, 2021 to 2031
Figure 99: APEJ Phycocyanin Market Attractiveness, By Form, 2021 to 2031
Figure 100: APEJ Phycocyanin Market Value Share (%) and BPS Analysis By Grade, 2016 & 2021 & 2031
Figure 101: APEJ Phycocyanin Market Y-o-Y Analysis By Grade, 2021 to 2031
Figure 102: APEJ Phycocyanin Market Attractiveness, By Grade, 2021 to 2031
Figure 103: APEJ Phycocyanin Market Value Share (%) and BPS Analysis By Application, 2016 & 2021 & 2031
Figure 104: APEJ Phycocyanin Market Y-o-Y Analysis By Application, 2021 to 2031
Figure 105: APEJ Phycocyanin Market Attractiveness, By Application, 2021 to 2031
Figure 106: MEA Phycocyanin Market Value Share (%) and BPS Analysis By Country, 2016 & 2021 & 2031
Figure 107: MEA Phycocyanin Market Y-o-Y Analysis By Country, 2021 to 2031
Figure 108: MEA Phycocyanin Market Attractiveness, By Country, 2021 to 2031
Figure 109: MEA Phycocyanin Market Value Share (%) and BPS Analysis By Nature, 2016 & 2021 & 2031
Figure 110: MEA Phycocyanin Market Y-o-Y Analysis By Nature, 2021 to 2031
Figure 111: MEA Phycocyanin Market Attractiveness, By Nature, 2021 to 2031
Figure 112: MEA Phycocyanin Market Value Share (%) and BPS Analysis By Form, 2016 & 2021 & 2031
Figure 113: MEA Phycocyanin Market Y-o-Y Analysis By Form, 2021 to 2031
Figure 114: MEA Phycocyanin Market Attractiveness, By Form, 2021 to 2031
Figure 115: MEA Phycocyanin Market Value Share (%) and BPS Analysis By Grade, 2016 & 2021 & 2031
Figure 116: MEA Phycocyanin Market Y-o-Y Analysis By Grade, 2021 to 2031
Figure 117: MEA Phycocyanin Market Attractiveness, By Grade, 2021 to 2031
Figure 118: MEA Phycocyanin Market Value Share (%) and BPS Analysis By Application, 2016 & 2021 & 2031
Figure 119: MEA Phycocyanin Market Y-o-Y Analysis By Application, 2021 to 2031
Figure 120: MEA Phycocyanin Market Attractiveness, By Application, 2021 to 2031
Need specific information?
Request CustomizationExplore Food and Beverage Insights
View Reports