
- Market Size (2026)
- USD 68.4 Mn
- Forecast (2036)
- USD 122.5 Mn
- CAGR (2026 to 2036)
- 6.0%
How big is Phycoerythrin Market in 2026?
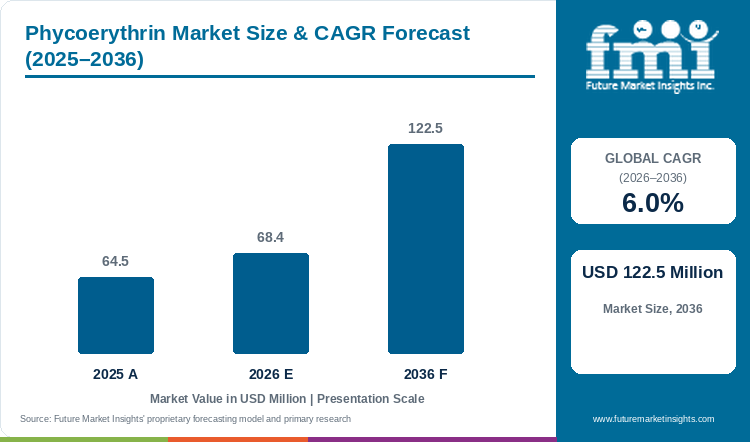
After recording a sector valuation of USD 64.5 million across 2025, worldwide phycoerythrin market value is projected at USD 68.4 million within 2026 and slated to total USD 122.5 million by 2036 under a 6.0% CAGR.
R-Phycoerythrin is slated to account for 66.1% of spectral type valuation in 2026 because hospital immunology laboratories and diagnostic kit makers rely on this bright red-algal protein to detect faint immune markers on blood cells. Small organic dyes often fade or blur into background cell glow on 488-nanometer and 561-nanometer lasers, whereas purified red-algal phycoerythrin gives five to ten times brighter fluorescence per labeled antibody. A June 2025 review in the International Journal of Molecular Sciences confirmed that full-spectrum unmixing in spectral flow cytometry expands the number of cell markers that hematology labs can measure in a single tube [1]. As clinical laboratories run larger antibody panels and algal biorefineries co-extract food-grade phycocyanin extracts, Future Market Insights estimates that worldwide phycoerythrin industry valuation will move past USD 64.5 million across 2025 to reach USD 68.4 million within 2026 and total USD 122.5 million in market size by 2036, reflecting a 6.0% CAGR and USD 54.1 million in net new annual market value.
Key Market Trends & Insights
- By spectral type: R-Phycoerythrin is slated to represent 66.1% of spectral market value in 2026 because its broad excitation range from 488 to 565 nanometers works on both standard and spectral flow cytometers.
- By purity grade: Diagnostic & Flow-Cytometry Grade is projected to claim 63.9% of grade valuation in 2026 as antibody conjugators require HPLC purity above 95% and zero free-dye carryover.
- By application: Flow Cytometry, Immunoassays & Fluorescence Microscopy is estimated to represent 66.3% of application market size for 2026 because of routine leukemia testing and Luminex bead assays.
- By conjugate format: Unconjugated Native Purified Phycobiliprotein is anticipated to hold 39.7% of format valuation in 2026 as contract conjugation houses buy bulk ammonium-sulfate suspensions for custom antibody linking.
Regional Highlights
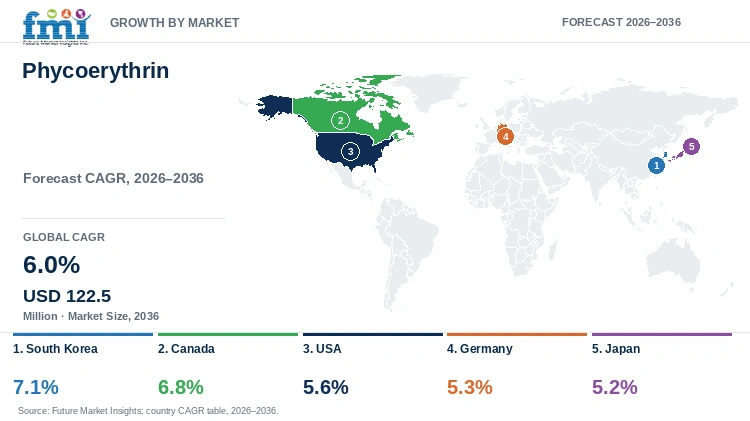
- East Asian and North American pace setters: South Korea is projected to top country-level market growth with a 7.1% yearly CAGR up to 2036, followed by Canada at a 6.8% annual clip.
- Established diagnostic and biopharma hubs: Industry valuation across the USA is forecast to climb 5.6% per year versus 5.3% in Germany and 5.2% in Japan.
Market Size & Forecast
Table 1: Market Size and Forecast for the Phycoerythrin Market (USD million and CAGR percentage), 2025 to 2036
| Metric | Value |
|---|---|
| 2025 Market Value | USD 64.5 million |
| Estimated Market Size in 2026 | USD 68.4 million |
| Projected Industry Valuation by 2036 | USD 122.5 million |
| CAGR, 2026 to 2036 | 6.0% |
| Added Annual Market Value, 2026 to 2036 | USD 54.1 million |
Seasonal swings in wild red seaweed harvests and thick slime build-up inside closed photobioreactors have long made it hard for marine bioprocessors to keep purified pigment output steady. In September 2025, researchers at the Chinese Academy of Sciences reported in Marine Drugs that growing Porphyridium purpureum under low-salinity (10 ppt) semi-continuous fresh-medium renewal boosted phycoerythrin yield by 253% over batch culture to 160 milligrams per liter (8.39% dry weight) while cutting broth viscosity [2]. Because of these cultivation gains, algal producers are scaling indoor tubular photobioreactors and algal natural food colours to supply both laboratory fluorophores and food-grade antioxidant pigments. Biopharma buyers sign multi-batch supply contracts to lock in consistent A566/A280 purity ratios.
Photobioreactor Extraction and Fluorophore Lot Sizing
Table 2: Photobioreactor Extraction and Fluorophore Lot Sizing for the Phycoerythrin Market (USD million and operational ranges), 2025 to 2036
| Metric | 2025 | 2026 | 2036 |
|---|---|---|---|
| Market size (USD million) | 64.5 | 68.4 | 122.5 |
| Purified diagnostic R-PE & B-PE output (kilograms) | 4,100 to 4,450 | 4,350 to 4,720 | 7,600 to 8,250 |
| Food & nutraceutical grade pigment volume (tonnes) | 48.0 to 53.0 | 51.0 to 56.5 | 92.0 to 102.0 |
| Diagnostic-grade wholesale price (USD per gram) | 9,800 to 12,800 | 9,900 to 13,100 | 10,500 to 14,200 |
Operational note: Diagnostic-grade output reflects chromatographically purified R-PE and B-PE with A565/A280 ratios of 4.5 to 5.8 sold in milligram and gram vials, whereas food-grade pigment volume reflects spray-dried red-algal extracts.
Extraction teams isolate analytical-grade phycoerythrin from Porphyridium and Gracilaria cells by breaking the cell walls in phosphate buffer and running ammonium-sulfate precipitation before ion-exchange column polishing. Upstream marine cultivators also connect closed photobioreactors growing photobioreactor microalgae biomass directly to chilled ultrafiltration skids so the red pigment does not fade under light.
Per Capita & Cytometry Core Facility Sizing
Table 3: Per Capita and Cytometry-Laboratory Valuation Indicators for the Phycoerythrin Market (USD), 2025 to 2036
| Metric | 2025 | 2026 | 2036 |
|---|---|---|---|
| World population (billion) | 8.2 | 8.3 | 9.0 |
| Market value per 1,000 people (USD) | 7.9 | 8.2 | 13.6 |
| Annual PE reagent procurement per cytometry lab (USD) | 3,600 to 4,200 | 3,800 to 4,450 | 5,800 to 6,750 |
| Spectral & multiplex panel reagent share (%) | 61.0% to 65.0% | 63.0% to 67.0% | 71.0% to 75.0% |
Table 4: Flow-Cytometry Core Facility & Application Valuation Indicators for the Phycoerythrin Market (USD and percentages), 2026
| Metric | Value | Institutional Reference Basis |
|---|---|---|
| Market size, 2026 | USD 68.4 million | 2026 global market valuation baseline |
| Clinical & research flow-cytometry facilities worldwide | 16,500 laboratories | Global cytometry core and IVD lab registry |
| Average annual phycoerythrin value per facility | USD 4,145 | Annualized fluorophore and conjugate valuation |
| Flow cytometry & immunoassay market value, 2026 | USD 45.3 million | 66.3% application segment allocation |
Multi-center CAR-T and minimal residual disease trials need reagent lots calibrated to a known number of phycoerythrin molecules per cell so receptor counts match across hospitals. Algal biotechnology producers pair marine red-algal extraction with cultivated freshwater microalgae strains to supply companion phycobilisome dyes for clinical diagnostic panels.
Analyst Perspective
"Automated spectral flow cytometers and multiplex bead arrays keep high-purity R-phycoerythrin indispensable for detecting low-density immune receptors. Freeze-thaw denaturation and pH above 7.5 or heat above 70 degrees Celsius still restrict unstabilized food-grade pigment conversion."
- Nandini Roy Choudhury, Principal Consultant, Future Market Insights.
How is the phycoerythrin market segmented?
The phycoerythrin market is segmented by spectral type, purity grade, application, conjugate format, and region. In 2026, R-Phycoerythrin is projected at 66.1%, Diagnostic & Flow-Cytometry Grade at 63.9%, Flow Cytometry, Immunoassays & Fluorescence Microscopy at 66.3%, and Unconjugated Native Purified Phycobiliprotein at 39.7%.
By spectral type: R-Phycoerythrin, B-Phycoerythrin, and Allophycocyanin & Tandem Dye Conjugates.
By purity grade: Diagnostic & Flow-Cytometry Grade and Food & Nutraceutical Antioxidant Pigment Grade.
By application: Flow Cytometry, Immunoassays & Fluorescence Microscopy and Nutraceuticals & Natural Confectionery Colorants.
By conjugate format: Unconjugated Native Purified Phycobiliprotein, Streptavidin & Secondary Antibody Conjugates, and Primary Monoclonal Antibody & Tandem Conjugates.
Why does R-Phycoerythrin command the spectral type category?
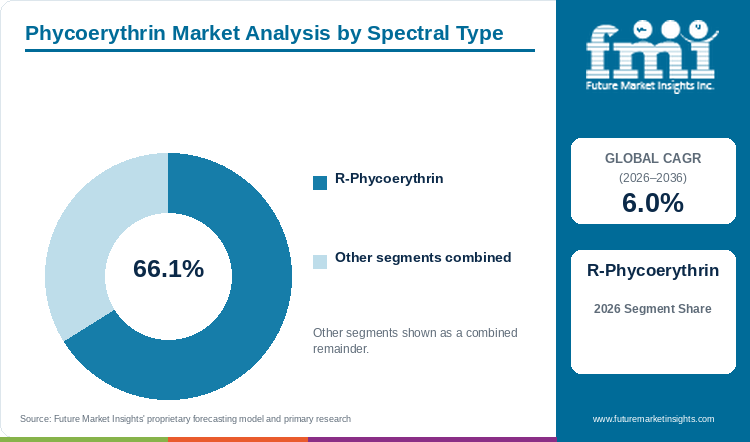
R-Phycoerythrin is slated to represent 66.1% of spectral type valuation in 2026, rooted in its three-peak absorption profile.
Table 5: Spectral Type Share for the Phycoerythrin Market (percentage share), 2026
| Spectral Type | Share (2026) |
|---|---|
| R-Phycoerythrin | 66.1% |
| Other Segments Combined | 33.9%* |
| Total | 100.0% |
*Note: Combined share of remaining spectral type categories totaling 100.0% of 2026 industry valuation.
Table 6: Spectral Type Leadership and Market Growth for the Phycoerythrin Market (segment and CAGR percentage), 2026 to 2036
| Metric | Value |
|---|---|
| Global CAGR (2026 to 2036) | 6.0% |
| Leading Segment | R-Phycoerythrin |
Unlike B-phycoerythrin which lacks strong absorption at 498 nanometers, R-phycoerythrin shows three distinct excitation peaks at 496 and 546 as well as 565 nanometers because of its alpha-beta-gamma subunit structure. This wide absorption window lets a single dye work under both blue 488-nanometer lasers and yellow-green 561-nanometer lasers when linked to diagnostic monoclonal antibodies.
- R-Phycoerythrin is forecast to secure 66.1% of spectral type market value in 2026 by acting as both a primary 575-nanometer detector label and the energy donor for PE-Cy5 and PE-Cy7 tandems.
- An April 2025 study from the Federal University of Ceara published in the International Journal of Biological Macromolecules purified R-phycoerythrin from farmed Solieria filiformis red seaweed through ion-exchange and size-exclusion columns, reaching a 4.5 purity index and 60.19% structural stability up to 70 degrees Celsius [3].
What keeps Diagnostic & Flow-Cytometry Grade ahead by purity grade?
Diagnostic & Flow-Cytometry Grade is projected to generate 63.9% of purity grade valuation in 2026, assisted by high unit realization.
Analytical-grade phycoerythrin purified to an A566/A280 ratio of 5.0 or higher and an A620/A566 phycocyanin-contamination ratio below 0.010 realizes from USD 10 up to USD 25 for each milligram in reagent catalogs. Leftover phycocyanin or algal sugars cause unwanted background binding across multiplex bead immunoassay platforms, which makes multi-column polishing essential for diagnostic antibody suppliers.
- Diagnostic & Flow-Cytometry Grade is projected to claim 63.9% of purity grade market value during 2026 because milligram reagent pricing outweighs bulk food-colorant tonnage.
- Columbia Biosciences documented in its 2026 SureLight R-Phycoerythrin technical specifications that diagnostic-grade D42-000 lots hold A566/A280 absorbance ratios of at least 5.00 and HPLC purity of at least 95% for flow cytometry and Luminex conjugation [4].
How does Flow Cytometry, Immunoassays & Fluorescence Microscopy lead applications?
Flow Cytometry, Immunoassays & Fluorescence Microscopy is estimated to concentrate 66.3% of 2026 application market size, supported by oncology immunophenotyping.
Clinical lymphoma and leukemia testing panels reserve the bright phycoerythrin channel for the faintest surface markers on T cells and natural killer cells. Beyond cell sorting, streptavidin-R-PE reporters provide high detection sensitivity across Luminex cytokine bead arrays and live-cell super-resolution microscopes.
- Flow Cytometry, Immunoassays & Fluorescence Microscopy is estimated to represent 66.3% of application market value during 2026 through repeat per-patient diagnostic antibody usage.
- Becton, Dickinson and Company launched the BD FACSDiscover A8 Cell Analyzer in May 2025, pairing BD SpectralFX 50-plus-color spectral flow cytometry with real-time BD CellView spatial cell imaging for immuno-oncology labs [5].
Why does Unconjugated Native Purified Phycobiliprotein lead conjugate formats?
Unconjugated Native Purified Phycobiliprotein is anticipated to hold 39.7% of conjugate format demand in 2026, driven by B2B bulk supply.
Diagnostic antibody makers and contract conjugation houses buy unconjugated R-phycoerythrin suspended in 60% ammonium sulfate or pre-activated with maleimide and Sulfo-SMCC or copper-free DBCO click-chemistry linkers. Bulk unconjugated phycobiliprotein lets IVD companies control exact dye-to-antibody ratios across their own monoclonal clones and custom PE-tandem dyes.
- Unconjugated Native Purified Phycobiliprotein is anticipated to capture 39.7% of conjugate format market size in 2026 ahead of streptavidin (32.4%) and primary monoclonal conjugates (27.9%).
- A February 2026 study from the University of Birmingham and University of Bristol published in Nature Communications used native mass spectrometry to show that phycobiliprotein alpha-beta hexamers keep their assembly interfaces conserved across cyanobacterial and algal species [6].
What are the drivers, restraints, and opportunities in the phycoerythrin market?
Automated clinical flow cytometry and FDA synthetic-dye phase-outs are anticipated to lift phycoerythrin market valuation until 2036, whereas freeze-thaw and thermal denaturation restrain unbuffered handling and click-chemistry tandems create multiplex opportunities.
- Driver: Automated spectral flow cytometry workflows and CAR-T minimal residual disease testing raise repeat demand for R-phycoerythrin conjugates.
- Restraint: Irreversible hexamer breakdown during freezing and heat bleaching above 70 degrees Celsius require strict 2-to-8-degree cold-chain shipping.
- Opportunity: Phycoerythrin recovery from carrageenan seaweed side-streams and polymer-stabilized tandem conjugates open oncology and antioxidant nutraceutical markets.
Growth Analysis and Future Potential: Qualitative Demand Catalysts
Hospital hematology labs and biopharma contract research organizations are automating 25-to-50-color cell-sorting panels to speed up cell-therapy batch release whilst food color houses evaluate red-algal pigments with cyanobacterial spirulina extracts. Automated pipetting stations need pre-mixed phycoerythrin and PE-tandem antibody cocktails that show zero lot-to-lot brightness drift. In October 2026, Agilent Technologies Inc. introduced its NovoStation Sample Preparation System for automated flow cytometry workflows, cutting hands-on operator time by over 90% (from 85.5 minutes to 7.9 minutes) across a 25-color 30-sample panel [7]. Faster sample prep directly increases reagent usage per analyzer.
Risk Assessment of the Phycoerythrin Market: Operational and Formulation Friction
Sensitivity to ice crystal damage during freezing, dye fading under intense laser light, and tandem-dye energy-transfer breakdown remain the main technical limits on phycoerythrin usage. Unlike synthetic polymer dyes or oil-soluble antioxidant ketocarotenoid astaxanthin, water-based phycoerythrin hexamers break apart into dim monomers if accidentally frozen below zero degrees Celsius during air transit. In November 2025, Cyanotech Corporation noted in its second-quarter fiscal 2026 financial report that international tariff pressures affected contract phycobiliprotein extraction competitiveness even as total microalgae revenue rose 19.3% year-over-year to USD 6.976 million [8]. Cold-chain insulated boxes and batch tandem calibration add operating costs for reagent distributors.
Commercial Opportunity Analysis: Formulation Differentiation and Value-Add Formats
Marine bioprocessors can earn new revenue by extracting antioxidant phycoerythrin from farmed tropical red seaweed and building copper-free click-chemistry PE conjugates. Carrageenan processors working with Kappaphycus alvarezii can wash out water-soluble phycobiliprotein fractions before alkaline cooking to supply nutraceutical capsules and heat-stable confectionery food colors. In July 2025, a multi-institute study published in Scientific Reports isolated phycoerythrin with 69.84% protein purity from farmed Kappaphycus alvarezii while confirming strong DPPH and ABTS antioxidant activity and an IC50 of 131.7 micrograms per milliliter against human lung cancer cells [9]. Red seaweed side-stream recovery lowers raw biomass costs.
Phycoerythrin Market by Country (2026 to 2036)
South Korea is projected to top country-level phycoerythrin growth at a 7.1% yearly CAGR over 2026 to 2036 ahead of Canada at 6.8%, while the USA (5.6%) and Germany (5.3%) plus Japan (5.2%) build on mature cytometry networks.
FMI projects that South Korea will record the fastest national phycoerythrin CAGR at 7.1% between 2026 and 2036, whereas Japan is anticipated to grow by 5.2% annually. Varied trajectories across East Asian and North American laboratories compared with Western Europe reflect national CAR-T bioprocessing expansion and NIST fluorescence standardization.
Table 7: Country CAGR and Primary Growth Levers for the Phycoerythrin Market (CAGR percentage and operational drivers), 2026 to 2036
| Country | CAGR (2026 to 2036) | Primary Growth Lever |
|---|---|---|
| South Korea | 7.1% | Seoul and Gyeonggi spectral cytometry panel adoption and Incheon CDMO cell-therapy QC expansion |
| Canada | 6.8% | Early university adoption of 5-laser spectral flow cytometers and Atlantic red-seaweed extraction |
| USA | 5.6% | NIST-FDA-NIAID flow cytometry fluorescence standardization and FDA natural colorant transitions |
| Germany | 5.3% | EMBL and DKFZ spectral cytometry core networks and Darmstadter life-science reagent manufacturing |
| Japan | 5.2% | 45-color spectral flow cytometry protocols and closed-system Porphyridium pigment cultivation |
Source: Future Market Insights analysis
South Korea Phycoerythrin Market Outlook (2026 to 2036)
Rapid capacity additions across Songdo and Gyeonggi biopharma contract manufacturing hubs make South Korea the fastest-growing national market for flow-cytometry grade phycoerythrin. Domestic cell-therapy developers and university hospitals rely on R-phycoerythrin and PE-tandem conjugates to track immune cell subsets across oncology and immunology trials. In July 2026, researchers at Seoul National University and LK Bioscience in Gyeonggi-do published an optimized three-laser 27-color spectral flow cytometry panel in PLoS One that resolves 16 lymphoid and myeloid cell subsets across multiple tissues [10]. National phycoerythrin market value across South Korea is projected to climb 7.1% annually from 2026 to 2036, though cold-chain air freight on imported U.S. conjugates still adds cost.
Key takeaway: In South Korea, expanding 27-color spectral cytometry research in Seoul and biopharma CDMO quality control are projected to drive a 7.1% annual market growth rate.
Canada Phycoerythrin Market Outlook (2026 to 2036)
Early university deployment of 3-to-5-laser spectral flow cytometers across Ontario and Quebec plus British Columbia cancer centers sets Canada apart in high-parameter fluorophore adoption. In January 2025, Agilent Technologies highlighted the first Canadian installation of its NovoCyte Opteon Spectral Flow Cytometer at York University in Toronto, where stem-cell and cancer researchers validated an 18-color panel on the first day of operation [11]. Federal stem-cell research grants and Health Canada updates to its List of Permitted Food Colours in October 2025 help Canadian phycoerythrin market valuation climb at an expected 6.8% per year until 2036. Winter freeze-protection rules during cross-province courier transit still raise reagent shipping costs.
Key takeaway: In Canada, rapid cancer-center upgrades to spectral flow cytometry and updated food-color rules are expected to sustain a 6.8% CAGR.
USA Phycoerythrin Market Outlook (2026 to 2036)
Domestic fluorophore purification in Maryland and Hawaii and the world's largest installed base of clinical flow cytometers gives the United States the highest national phycoerythrin market value globally. In June 2025, metrology specialists at the National Institute of Standards and Technology co-hosted the NIST-FDA-NIAID AI and Flow Cytometry Workshop in Gaithersburg to set reference values for fluorophore concentration and absolute PE fluorescence intensity [12]. United States phycoerythrin industry valuation is projected to grow by 5.6% each year across the 2026 to 2036 decade for oncology IVD panels and natural confectionery trials. Academic NIH grant timing and competition from violet polymer dyes still moderate domestic volume growth.
Key takeaway: In the USA, NIST-FDA fluorescence quantitation standards and biopharma cell-therapy pipelines are forecast to anchor 5.6% annual valuation growth.
Germany Phycoerythrin Market Outlook (2026 to 2036)
Germany leads European demand for diagnostic-grade phycoerythrin through its cluster of immunology institutes in Heidelberg and Borstel and cell-analysis plants in Bergisch Gladbach and Darmstadt. In December 2025, cytometry directors from the European Molecular Biology Laboratory (EMBL) and the German Cancer Research Center (DKFZ) co-authored the CYTO 2025 workshop report in Cytometry Part A detailing standardization rules for high-dimensional spectral panels [13]. German market valuation for purified phycoerythrin reagents is anticipated to rise by 5.3% annually between 2026 and 2036 across hospital hematology cores. Stringent European Union In Vitro Diagnostic Medical Devices Regulation (IVDR) reviews still lengthen registration schedules for new clinical PE antibody kits.
Key takeaway: In Germany, translational immunology core facilities and domestic MACS and Sigma-Aldrich reagent manufacturing are anticipated to support 5.3% yearly market growth.
Japan Phycoerythrin Market Outlook (2026 to 2036)
What sets Japan apart in East Asia is its combined expertise in red-algal aquaculture and optical engineering for high-parameter spectral flow cytometry in Tokyo and Yokohama. In March 2026, Sony Corporation Life Science researchers in Tokyo and Yokohama published a 45-color spectral flow cytometry protocol in STAR Protocols detailing spectral reference acquisition and unmixing for human peripheral blood mononuclear cell aging analysis [14]. Japanese market size for purified phycoerythrin reagents is slated to climb by 5.2% each year over the forecast horizon to 2036 as university hospitals and stem-cell centers standardize multi-color panels. Biennial National Health Insurance diagnostic fee cuts and yen weakness against imported U.S. antibodies still tighten hospital reagent budgets.
Key takeaway: In Japan, 45-color spectral cytometry innovation and regenerative medicine cell-sorting protocols are slated to support 5.2% yearly market expansion through 2036.
Full report country CAGRs cover: North America; Latin America; Western Europe; Eastern Europe; East Asia; South Asia and Pacific; Middle East and Africa.
Who are the notable companies in the phycoerythrin market?
Thermo Fisher Scientific Inc., Becton, Dickinson and Company, Merck KGaA, Agilent Technologies, Inc., Columbia Biosciences Corporation, Cyanotech Corporation, BioLegend, Inc., and Miltenyi Biotec B.V. & Co. KG are the notable companies in the phycoerythrin market.
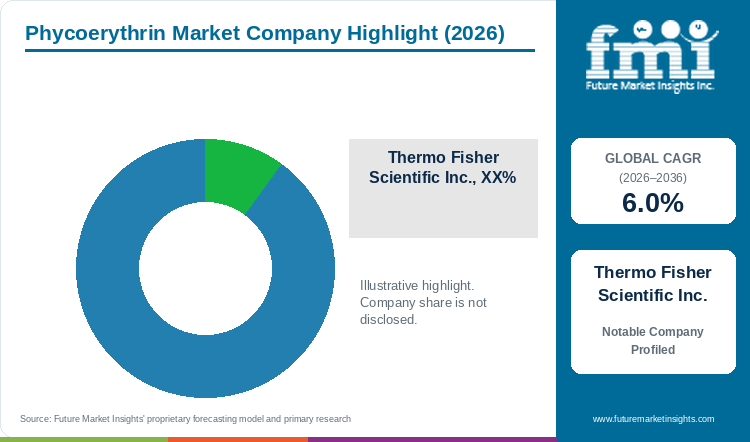
As per FMI analysts, competition in the phycoerythrin sector spans integrated flow-cytometry instrument and reagent makers plus specialized immunology antibody houses and upstream microalgae purifiers. Global life-science instrument leaders bundle spectral cytometers with pre-titrated R-PE and tandem antibody panels. Meanwhile, upstream algal specialists purify bulk ammonium-sulfate precipitates and DBCO-activated fluorophores or provide contract phycobiliprotein extraction for diagnostic kit makers.
- Integrated Cytometry & Life-Science Ecosystems: Thermo Fisher Scientific Inc. and Becton, Dickinson and Company along with Merck KGaA and Agilent Technologies, Inc. pair benchtop and spectral cytometers with broad R-PE antibody and streptavidin catalogs.
- Immunology & Clinical Cell-Analysis Specialists: BioLegend, Inc. (Revvity) and Miltenyi Biotec B.V. & Co. KG produce recombinant and monoclonal PE and PE-tandem conjugates for deep immunophenotyping and GMP cell therapy.
- Upstream Algal Cultivators & Fluorophore Purifiers: Columbia Biosciences Corporation purifies bulk unconjugated SureLight R-PE and B-PE fluorophores whilst Cyanotech Corporation provides upstream microalgae cultivation and contract phycobiliprotein extraction.
Competitive Benchmarking: Phycoerythrin Market
Table 8: Competitive Benchmarking for the Phycoerythrin Market (qualitative capability ratings), 2026
| Company | R-PE / B-PE & Tandem Portfolio | A565/A280 Purity & Calibration | Cytometry & IVD Channel Access | Geographic Reach |
|---|---|---|---|---|
| Thermo Fisher Scientific Inc. | High | High | High | High |
| Becton, Dickinson and Company | High | High | High | High |
| Merck KGaA | High | High | High | High |
| Agilent Technologies, Inc. | High | High | High | High |
| Columbia Biosciences Corporation | High | High | Medium | Medium |
| Cyanotech Corporation | Medium | Medium | Medium | High |
| BioLegend, Inc. | High | High | High | High |
| Miltenyi Biotec B.V. & Co. KG | High | High | High | High |
Scoring basis: Benchmark ratings reflect product coverage across native R-PE and B-PE plus streptavidin and tandem conjugates paired with A565/A280 purity above 5.0 and NIST bead calibration. Market access and regional scores measure clinical IVD and research core-laboratory distribution.
Key Developments in the Phycoerythrin Market
- Merck KGaA reported in March 2026 in its 2025 Annual Report that its Life Science business sector generated 42% of Group net revenue in fiscal 2025 while reorganizing into Process Solutions and Discovery Solutions plus Advanced Solutions units effective January 2026 [15].
- Revvity, Inc. (parent of BioLegend, Inc.) unveiled new automated cell-analysis workflows at SLAS 2025 in January 2025 and expanded its BioLegend PE/Fire tandem and Spark NIR anti-phycoerythrin flow cytometry antibody catalog across 2025 and 2026 [16].
- Miltenyi Biotec B.V. & Co. KG launched the MACSPlex EV Kit MSC human reagent system in January 2025 for flow-cytometry detection and characterization of mesenchymal stem-cell extracellular vesicles using phycoerythrin and APC antibody cocktails [17].
Key Players in the Phycoerythrin Market
Integrated Cytometry & Life-Science Ecosystems
- Thermo Fisher Scientific Inc.
- Becton, Dickinson and Company
- Merck KGaA
- Agilent Technologies, Inc.
Immunology & Clinical Cell-Analysis Specialists
- BioLegend, Inc.
- Miltenyi Biotec B.V. & Co. KG
Upstream Algal Cultivators & Fluorophore Purifiers
- Columbia Biosciences Corporation
- Cyanotech Corporation
Phycoerythrin Market - Report Scope
Table 9: Report Scope for the Phycoerythrin Market (coverage fields and definitions), 2026 to 2036
| Coverage field | Report scope |
|---|---|
| Market breakdown | Spectral Type; Purity Grade; Application; Conjugate Format; Region |
| Quantitative Units | USD Million |
| Market Definition | Includes commercial market value of purified R-phycoerythrin, B-phycoerythrin, phycoerythrin-allophycocyanin and cyanine tandem dyes, streptavidin and monoclonal antibody phycoerythrin conjugates, and food/nutraceutical-grade phycoerythrin extracts. Category Scope Note: Excludes flow-cytometer hardware instruments, unextracted raw seaweed biomass, and standalone blue C-phycocyanin extracts sold without phycoerythrin. |
| Regions Covered | North America; Latin America; Western Europe; Eastern Europe; East Asia; South Asia and Pacific; Middle East and Africa |
| Countries Covered | South Korea, Canada, USA, Germany, Japan, and additional countries in the full report |
| Key Companies Covered | Thermo Fisher Scientific Inc., Becton, Dickinson and Company, Merck KGaA, Agilent Technologies, Inc., Columbia Biosciences Corporation, Cyanotech Corporation, BioLegend, Inc., Miltenyi Biotec B.V. & Co. KG |
| Forecast Period | 2026 to 2036 |
| Approach | Primary and secondary research with top-down and bottom-up market triangulation. |
Phycoerythrin Market - Research Methodology
Table 10: Research Methodology for the Phycoerythrin Market (research methods and approach), 2026 edition
| Method | Approach |
|---|---|
| Primary Research | Structured interviews with flow-cytometry core facility directors, antibody conjugation chemists, photobioreactor algal bioprocessors, and IVD regulatory specialists to validate A565/A280 purity tiers and per-milligram pricing. |
| Secondary Research | Analysis of corporate annual filings, NIST Flow Cytometry Standards Consortium proceedings, Health Canada color additive registries, ISAC CYTO workshop reports, STAR Protocols and PLoS One spectral cytometry methods, and peer-reviewed marine biotechnology journals. |
| Market Sizing and Forecasting | Top-down life-science fluorophore and algal pigment valuation models reconciled against bottom-up cytometry core-facility reagent consumption and purified kilogram output from 2026 to 2036. |
| Country Forecasting Model | Econometric country projections weight installed spectral flow-cytometer bases, biopharma CDMO cell-therapy clinical trials, and marine red-algal photobioreactor capacity across five national markets. |
| Operational Benchmark Traceability | Purified kilogram output, per-gram wholesale realization, and laboratory valuation benchmarks in Tables 2, 3, and 4 trace to Marine Drugs photobioreactor yields, Columbia Biosciences and Thermo Fisher catalog pricing, and ISAC lab registries. |
| Data Triangulation and Validation | Market value estimates are cross-checked against commercial red-algal extraction yields and IVD antibody conjugation volumes without double counting cytometry analyzer hardware. |
Phycoerythrin Market by Segments
Phycoerythrin Market segmented by Spectral Type:
- R-Phycoerythrin
- B-Phycoerythrin
- Allophycocyanin & Tandem Dye Conjugates
Phycoerythrin Market segmented by Purity Grade:
- Diagnostic & Flow-Cytometry Grade
- Food & Nutraceutical Antioxidant Pigment Grade
Phycoerythrin Market segmented by Application:
- Flow Cytometry, Immunoassays & Fluorescence Microscopy
- Nutraceuticals & Natural Confectionery Colorants
Phycoerythrin Market segmented by Conjugate Format:
- Unconjugated Native Purified Phycobiliprotein
- Streptavidin & Secondary Antibody Conjugates
- Primary Monoclonal Antibody & Tandem Conjugates
Phycoerythrin Market by Region
- North America
- United States
- Canada
- Latin America
- Brazil
- Mexico
- Argentina
- Chile
- Western Europe
- Germany
- France
- United Kingdom
- Italy
- Spain
- Benelux
- Nordics
- Eastern Europe
- Poland
- Czech Republic
- Romania
- Hungary
- East Asia
- China
- Japan
- South Korea
- South Asia and Pacific
- India
- ASEAN
- Australia and New Zealand
- Middle East and Africa
- GCC Countries
- South Africa
- Turkiye
- Israel
Research Sources and Bibliography
- [1] Astakhova, E. A., Gubaeva, A. S., Naumova, D. A., Egorova, A. E., Maznina, A. A., Rybkina, I. G., et al. (2025, June 19). Spectral Flow Cytometry: The Current State and Future of the Technology. International Journal of Molecular Sciences, 26(12), 5911 (PubMed PMID 40565376).
- [2] Li, C., Wu, H., Wu, H., Xiang, W., Xu, J., & Li, T. (2025, September 19). Enhancing Phycoerythrin Production of Marine Red Microalga Porphyridium purpureum with Low Salinity and Semi-Continuous Culture Strategy. Marine Drugs, 23(9), 361 (PubMed PMID 41003330).
- [3] Bastos-Filho, A. J. U., Brito, A. A. M., Lopes, F. L. S., Lima, F. E. S., Araujo-Filho, A. A. L., et al. (2025, April 16). Extraction, purification, physicochemical properties, and spectroscopic stability of the R-Phycoerythrin from the seaweed Solieria filiformis cultivated in Ceara Coast/Brazil. International Journal of Biological Macromolecules, 310(Pt 3), 143035 (PubMed PMID 40250661).
- [4] Columbia Biosciences Corporation. (2026, January 15). SureLight R-Phycoerythrin - Columbia Biosciences. Columbia Biosciences Technical Product Catalog.
- [5] Becton, Dickinson and Company. (2025, May 13). BD Launches Landmark Cell Analyzer Featuring Breakthrough Spectral and Real-Time Cell Imaging Technologies. BD Newsroom.
- [6] Sound, J. K., Bianchini, G., Ashok, T. A., Rad-Menendez, C., Green, D. H., Sanchez-Baracaldo, P., & Leney, A. C. (2026, February 16). Mass spectrometry reveals the evolutionary conservation of phycobiliprotein complexes. Nature Communications, 17(1), 2834 (PubMed PMID 41698895).
- [7] Agilent Technologies, Inc. (2026, October 1). Agilent Introduces the NovoStation Sample Preparation System for Automated Flow Cytometry Workflows. Agilent Technologies Newsroom.
- [8] Cyanotech Corporation. (2025, November 10). Cyanotech Reports Financial Results for the Second Quarter of Fiscal 2026. Cyanotech Investor Relations.
- [9] Balasundaram, H., Seethapathy, P., Sankaralingam, S., Mahendran, S., Mareeswaran, M., et al. (2025, July 31). Isolation, characterization, and biomedical potential of phycoerythrin phycobiliprotein from Kappaphycus alvarezii (Doty) L. M. Liao: antimicrobial, antioxidant, and anticancer activities. Scientific Reports, 15(1), 27904 (PubMed PMID 40745260).
- [10] Song, H., Lim, Y., & Lim, J. (2026, July 20). An optimized three-laser 27-color spectral flow cytometry panel for multi-organ profiling in mice. PLoS One, 21(7), e0347810 (PubMed PMID 42475299, Seoul National University & LK Bioscience).
- [11] Agilent Technologies, Inc. (2025, January 29). Agilent NovoCyte Opteon Wins 'Best New Drug Discovery & Development Product of 2024' Award. Agilent Technologies Newsroom.
- [12] National Institute of Standards and Technology (NIST). (2025, July 11). AI and Flow Cytometry Workshop | NIST. U.S. Department of Commerce, NIST.
- [13] Wallace, P. K., Jellison, E. R., Thornton, S., Kluepfel, K., Back, J., et al. (2025, December 30). Cyt-Geist: Current and Future Challenges in Cytometry: Reports of the CYTO 2025 Conference Workshops. Cytometry Part A, 109(1), 5-41 (PubMed PMID 41472424).
- [14] Krause, C. J., Higuchi, A., Tashiro, S., Nakagawa, K., Otsuka, F., Yotoriyama, T., Futamura, K., & Furuki, M. (2026, March 20). Protocol for generating high-quality, 45-color spectral flow cytometry data for unsupervised clustering to investigate aging in human PBMCs. STAR Protocols, 7(1), 104380 (PubMed PMID 41719133).
- [15] Merck KGaA. (2026, March 5). Life Science - Merck Annual Report 2025. Merck KGaA Financial Publications.
- [16] Revvity, Inc. (2025, January 23). Revvity Ignites Scientific Breakthroughs at SLAS2025. Revvity Newsroom.
- [17] Miltenyi Biotec B.V. & Co. KG. (2025, January 1). Miltenyi Biotec Newsroom - Product news | Great Britain. Miltenyi Biotec Official Product Releases.
- [18] Thermo Fisher Scientific Inc. (2026, February 10). R-phycoerythrin (R-PE) | Thermo Fisher Scientific - US. Thermo Fisher Scientific Cell Analysis Fluorophores.
- [19] Becton, Dickinson and Company. (2026, March 12). PE Phycoerythrin Fluorescence Quantitation Kit - BD Biosciences. BD Biosciences Clinical Discovery Reagents.
This bibliography is provided for reader reference and is not exhaustive. The full report contains the complete reference list and detailed citations.
This Report Answers
- How large is the phycoerythrin market in 2026 and what is forecast for 2036?
- Which spectral cytometry and algal bioprocessing trends support phycoerythrin demand?
- Why does R-Phycoerythrin lead the spectral type category?
- Why does Diagnostic & Flow-Cytometry Grade lead the purity grade category globally?
- How do growth rates differ across South Korea, Canada, the USA, Germany, and Japan?
- Which leading companies purify and conjugate phycoerythrin reagents today?
- What limits adoption or supplier switching in the phycoerythrin market?
- What should laboratory directors evaluate before qualifying a phycoerythrin lot?
Table of Content
Table of Content
- Key Takeaways
- Market Size and CAGR
- Top Growth Driver
- Fastest Growing Segment
- Leading Region
- Key Companies
- Emerging Opportunities
- Executive Summary
- Global Market Outlook
- Demand-side Trends
- Supply-side Trends
- Technology Roadmap Analysis
- Analysis and Recommendations
- Analyst Perspective (What is happening? Why now? What should investors know?)
- Key Questions Answered
- How large is the market?
- What is the CAGR?
- What are key trends?
- Which region dominates?
- Who are the leaders?
Read More...
- Market Overview
- Market Coverage / Taxonomy
- Market Definition / Scope / Limitations
- Research Methodology
- Chapter Orientation
- Analytical Lens and Working Hypotheses
- Market Structure, Signals, and Trend Drivers
- Benchmarking and Cross-market Comparability
- Market Sizing, Forecasting, and Opportunity Mapping
- Research Design and Evidence Framework
- Desk Research Programme (Secondary Evidence)
- Expert Input and Fieldwork (Primary Evidence)
- Tooling, Models, and Reference Databases
- Data Engineering and Model Build
- Quality Assurance and Audit Trail
- Market Background
- Market Dynamics (Drivers, Restraints, Opportunity, Trends)
- Scenario Forecast (Optimistic, Likely, Conservative)
- Impact Analysis
- AI Impact
- Sustainability Impact
- Regulatory Impact
- Technology Impact
- Consumer / Buyer Analysis
- Purchase Drivers
- Adoption Barriers
- Buyer Journey
- Opportunity Map Analysis
- Product Life Cycle Analysis
- Supply Chain Analysis
- Investment Feasibility Matrix
- Value Chain Analysis
- PESTLE and Porter's Analysis
- Regulatory Landscape
- Regional Parent Market Outlook
- Production and Consumption Statistics
- Import and Export Statistics
- Global Market Analysis and Forecast, 2021 to 2036
- Historical Market Size Value (USD Million) Analysis, 2021 to 2025
- Current and Future Market Size Value (USD Million) Projections, 2026 to 2036
- Y-o-Y Growth Trend Analysis
- Absolute $ Opportunity Analysis
- Global Market Pricing Analysis, 2021 to 2036
- Global Market Analysis and Forecast, By Spectral Type, 2021 to 2036
- Introduction / Key Findings
- Historical Market Size Value (USD Million) Analysis By Spectral Type, 2021 to 2025
- Current and Future Market Size Value (USD Million) Analysis and Forecast By Spectral Type, 2026 to 2036
- R-Phycoerythrin
- B-Phycoerythrin
- Allophycocyanin & Tandem Dye Conjugates
- Y-o-Y Growth Trend Analysis By Spectral Type, 2021 to 2025
- Absolute $ Opportunity Analysis By Spectral Type, 2026 to 2036
- Global Market Analysis and Forecast, By Purity Grade, 2021 to 2036
- Introduction / Key Findings
- Historical Market Size Value (USD Million) Analysis By Purity Grade, 2021 to 2025
- Current and Future Market Size Value (USD Million) Analysis and Forecast By Purity Grade, 2026 to 2036
- Diagnostic & Flow-Cytometry Grade
- Food & Nutraceutical Antioxidant Pigment Grade
- Y-o-Y Growth Trend Analysis By Purity Grade, 2021 to 2025
- Absolute $ Opportunity Analysis By Purity Grade, 2026 to 2036
- Global Market Analysis and Forecast, By Application, 2021 to 2036
- Introduction / Key Findings
- Historical Market Size Value (USD Million) Analysis By Application, 2021 to 2025
- Current and Future Market Size Value (USD Million) Analysis and Forecast By Application, 2026 to 2036
- Flow Cytometry, Immunoassays & Fluorescence Microscopy
- Nutraceuticals & Natural Confectionery Colorants
- Y-o-Y Growth Trend Analysis By Application, 2021 to 2025
- Absolute $ Opportunity Analysis By Application, 2026 to 2036
- Global Market Analysis and Forecast, By Conjugate Format, 2021 to 2036
- Introduction / Key Findings
- Historical Market Size Value (USD Million) Analysis By Conjugate Format, 2021 to 2025
- Current and Future Market Size Value (USD Million) Analysis and Forecast By Conjugate Format, 2026 to 2036
- Unconjugated Native Purified Phycobiliprotein
- Streptavidin & Secondary Antibody Conjugates
- Primary Monoclonal Antibody & Tandem Conjugates
- Y-o-Y Growth Trend Analysis By Conjugate Format, 2021 to 2025
- Absolute $ Opportunity Analysis By Conjugate Format, 2026 to 2036
- Global Market Analysis and Forecast, By Region, 2021 to 2036
- Introduction
- Historical Market Size Value (USD Million) Analysis By Region, 2021 to 2025
- Current Market Size Value (USD Million) Analysis and Forecast By Region, 2026 to 2036
- North America
- Latin America
- Western Europe
- Eastern Europe
- East Asia
- South Asia and Pacific
- Middle East and Africa
- Market Attractiveness Analysis By Region
- North America Market Analysis and Forecast, By Country, 2021 to 2036
- Historical Market Size Value (USD Million) Trend Analysis By Market Taxonomy, 2021 to 2025
- Market Size Value (USD Million) Forecast By Market Taxonomy, 2026 to 2036
- By Country
- United States
- Canada
- By Spectral Type
- By Purity Grade
- By Application
- By Conjugate Format
- By Country
- Market Attractiveness Analysis
- By Country
- By Spectral Type
- By Purity Grade
- By Application
- By Conjugate Format
- Key Takeaways
- Latin America Market Analysis and Forecast, By Country
- Historical Market Size Value (USD Million) Trend Analysis By Market Taxonomy, 2021 to 2025
- Market Size Value (USD Million) Forecast By Market Taxonomy, 2026 to 2036
- By Country
- Brazil
- Mexico
- Argentina
- Chile
- By Spectral Type
- By Purity Grade
- By Application
- By Conjugate Format
- By Country
- Market Attractiveness Analysis
- By Country
- By Spectral Type
- By Purity Grade
- By Application
- By Conjugate Format
- Key Takeaways
- Western Europe Market Analysis and Forecast, By Country
- Historical Market Size Value (USD Million) Trend Analysis By Market Taxonomy, 2021 to 2025
- Market Size Value (USD Million) Forecast By Market Taxonomy, 2026 to 2036
- By Country
- Germany
- France
- United Kingdom
- Italy
- Spain
- Benelux
- Nordics
- By Spectral Type
- By Purity Grade
- By Application
- By Conjugate Format
- By Country
- Market Attractiveness Analysis
- By Country
- By Spectral Type
- By Purity Grade
- By Application
- By Conjugate Format
- Key Takeaways
- Eastern Europe Market Analysis and Forecast, By Country
- Historical Market Size Value (USD Million) Trend Analysis By Market Taxonomy, 2021 to 2025
- Market Size Value (USD Million) Forecast By Market Taxonomy, 2026 to 2036
- By Country
- Poland
- Czech Republic
- Romania
- Hungary
- By Spectral Type
- By Purity Grade
- By Application
- By Conjugate Format
- By Country
- Market Attractiveness Analysis
- By Country
- By Spectral Type
- By Purity Grade
- By Application
- By Conjugate Format
- Key Takeaways
- East Asia Market Analysis and Forecast, By Country
- Historical Market Size Value (USD Million) Trend Analysis By Market Taxonomy, 2021 to 2025
- Market Size Value (USD Million) Forecast By Market Taxonomy, 2026 to 2036
- By Country
- China
- Japan
- South Korea
- By Spectral Type
- By Purity Grade
- By Application
- By Conjugate Format
- By Country
- Market Attractiveness Analysis
- By Country
- By Spectral Type
- By Purity Grade
- By Application
- By Conjugate Format
- Key Takeaways
- South Asia and Pacific Market Analysis and Forecast, By Country
- Historical Market Size Value (USD Million) Trend Analysis By Market Taxonomy, 2021 to 2025
- Market Size Value (USD Million) Forecast By Market Taxonomy, 2026 to 2036
- By Country
- India
- ASEAN
- Australia and New Zealand
- By Spectral Type
- By Purity Grade
- By Application
- By Conjugate Format
- By Country
- Market Attractiveness Analysis
- By Country
- By Spectral Type
- By Purity Grade
- By Application
- By Conjugate Format
- Key Takeaways
- Middle East and Africa Market Analysis and Forecast, By Country
- Historical Market Size Value (USD Million) Trend Analysis By Market Taxonomy, 2021 to 2025
- Market Size Value (USD Million) Forecast By Market Taxonomy, 2026 to 2036
- By Country
- GCC Countries
- South Africa
- Turkiye
- Israel
- By Spectral Type
- By Purity Grade
- By Application
- By Conjugate Format
- By Country
- Market Attractiveness Analysis
- By Country
- By Spectral Type
- By Purity Grade
- By Application
- By Conjugate Format
- Key Takeaways
- Key Countries Market Analysis
- United States
- Pricing Analysis
- Market Share Analysis, 2025
- By Spectral Type
- By Purity Grade
- By Application
- By Conjugate Format
- Canada
- Pricing Analysis
- Market Share Analysis, 2025
- By Spectral Type
- By Purity Grade
- By Application
- By Conjugate Format
- Mexico
- Pricing Analysis
- Market Share Analysis, 2025
- By Spectral Type
- By Purity Grade
- By Application
- By Conjugate Format
- Brazil
- Pricing Analysis
- Market Share Analysis, 2025
- By Spectral Type
- By Purity Grade
- By Application
- By Conjugate Format
- Chile
- Pricing Analysis
- Market Share Analysis, 2025
- By Spectral Type
- By Purity Grade
- By Application
- By Conjugate Format
- Germany
- Pricing Analysis
- Market Share Analysis, 2025
- By Spectral Type
- By Purity Grade
- By Application
- By Conjugate Format
- United Kingdom
- Pricing Analysis
- Market Share Analysis, 2025
- By Spectral Type
- By Purity Grade
- By Application
- By Conjugate Format
- Italy
- Pricing Analysis
- Market Share Analysis, 2025
- By Spectral Type
- By Purity Grade
- By Application
- By Conjugate Format
- Spain
- Pricing Analysis
- Market Share Analysis, 2025
- By Spectral Type
- By Purity Grade
- By Application
- By Conjugate Format
- France
- Pricing Analysis
- Market Share Analysis, 2025
- By Spectral Type
- By Purity Grade
- By Application
- By Conjugate Format
- India
- Pricing Analysis
- Market Share Analysis, 2025
- By Spectral Type
- By Purity Grade
- By Application
- By Conjugate Format
- ASEAN
- Pricing Analysis
- Market Share Analysis, 2025
- By Spectral Type
- By Purity Grade
- By Application
- By Conjugate Format
- Australia and New Zealand
- Pricing Analysis
- Market Share Analysis, 2025
- By Spectral Type
- By Purity Grade
- By Application
- By Conjugate Format
- China
- Pricing Analysis
- Market Share Analysis, 2025
- By Spectral Type
- By Purity Grade
- By Application
- By Conjugate Format
- Japan
- Pricing Analysis
- Market Share Analysis, 2025
- By Spectral Type
- By Purity Grade
- By Application
- By Conjugate Format
- South Korea
- Pricing Analysis
- Market Share Analysis, 2025
- By Spectral Type
- By Purity Grade
- By Application
- By Conjugate Format
- Poland
- Pricing Analysis
- Market Share Analysis, 2025
- By Spectral Type
- By Purity Grade
- By Application
- By Conjugate Format
- Hungary
- Pricing Analysis
- Market Share Analysis, 2025
- By Spectral Type
- By Purity Grade
- By Application
- By Conjugate Format
- South Africa
- Pricing Analysis
- Market Share Analysis, 2025
- By Spectral Type
- By Purity Grade
- By Application
- By Conjugate Format
- United States
- Market Structure Analysis
- Competition Dashboard
- Competition Benchmarking
- Market Share Analysis of Top Players
- By Regional
- By Spectral Type
- By Purity Grade
- By Application
- By Conjugate Format
- Emerging Startups
- Innovation Benchmarking
- Competition Analysis
- Competition Deep Dive
- Thermo Fisher Scientific Inc.
- Overview
- Product Portfolio
- Profitability by Market Segments
- Sales Footprint
- Strategy Overview
- Marketing Strategy
- Product Strategy
- Channel Strategy
- Becton, Dickinson and Company
- Merck KGaA
- Agilent Technologies, Inc.
- Columbia Biosciences Corporation
- Cyanotech Corporation
- BioLegend, Inc.
- Miltenyi Biotec B.V. & Co. KG
- Thermo Fisher Scientific Inc.
- Case Studies
- Success Stories
- Recent Developments
- Competition Deep Dive
- Assumptions & Acronyms Used
List of Tables
- Table 1: Global Market Value (USD Million) Forecast by Region, 2021 to 2036
- Table 2: Global Market Value (USD Million) Forecast by Spectral Type, 2021 to 2036
- Table 3: Global Market Value (USD Million) Forecast by Purity Grade, 2021 to 2036
- Table 4: Global Market Value (USD Million) Forecast by Application, 2021 to 2036
- Table 5: Global Market Value (USD Million) Forecast by Conjugate Format, 2021 to 2036
- Table 6: North America Market Value (USD Million) Forecast by Country, 2021 to 2036
- Table 7: North America Market Value (USD Million) Forecast by Spectral Type, 2021 to 2036
- Table 8: North America Market Value (USD Million) Forecast by Purity Grade, 2021 to 2036
- Table 9: North America Market Value (USD Million) Forecast by Application, 2021 to 2036
- Table 10: North America Market Value (USD Million) Forecast by Conjugate Format, 2021 to 2036
- Table 11: Latin America Market Value (USD Million) Forecast by Country, 2021 to 2036
- Table 12: Latin America Market Value (USD Million) Forecast by Spectral Type, 2021 to 2036
- Table 13: Latin America Market Value (USD Million) Forecast by Purity Grade, 2021 to 2036
- Table 14: Latin America Market Value (USD Million) Forecast by Application, 2021 to 2036
- Table 15: Latin America Market Value (USD Million) Forecast by Conjugate Format, 2021 to 2036
- Table 16: Western Europe Market Value (USD Million) Forecast by Country, 2021 to 2036
- Table 17: Western Europe Market Value (USD Million) Forecast by Spectral Type, 2021 to 2036
- Table 18: Western Europe Market Value (USD Million) Forecast by Purity Grade, 2021 to 2036
- Table 19: Western Europe Market Value (USD Million) Forecast by Application, 2021 to 2036
- Table 20: Western Europe Market Value (USD Million) Forecast by Conjugate Format, 2021 to 2036
- Table 21: Eastern Europe Market Value (USD Million) Forecast by Country, 2021 to 2036
- Table 22: Eastern Europe Market Value (USD Million) Forecast by Spectral Type, 2021 to 2036
- Table 23: Eastern Europe Market Value (USD Million) Forecast by Purity Grade, 2021 to 2036
- Table 24: Eastern Europe Market Value (USD Million) Forecast by Application, 2021 to 2036
- Table 25: Eastern Europe Market Value (USD Million) Forecast by Conjugate Format, 2021 to 2036
- Table 26: East Asia Market Value (USD Million) Forecast by Country, 2021 to 2036
- Table 27: East Asia Market Value (USD Million) Forecast by Spectral Type, 2021 to 2036
- Table 28: East Asia Market Value (USD Million) Forecast by Purity Grade, 2021 to 2036
- Table 29: East Asia Market Value (USD Million) Forecast by Application, 2021 to 2036
- Table 30: East Asia Market Value (USD Million) Forecast by Conjugate Format, 2021 to 2036
- Table 31: South Asia and Pacific Market Value (USD Million) Forecast by Country, 2021 to 2036
- Table 32: South Asia and Pacific Market Value (USD Million) Forecast by Spectral Type, 2021 to 2036
- Table 33: South Asia and Pacific Market Value (USD Million) Forecast by Purity Grade, 2021 to 2036
- Table 34: South Asia and Pacific Market Value (USD Million) Forecast by Application, 2021 to 2036
- Table 35: South Asia and Pacific Market Value (USD Million) Forecast by Conjugate Format, 2021 to 2036
- Table 36: Middle East and Africa Market Value (USD Million) Forecast by Country, 2021 to 2036
- Table 37: Middle East and Africa Market Value (USD Million) Forecast by Spectral Type, 2021 to 2036
- Table 38: Middle East and Africa Market Value (USD Million) Forecast by Purity Grade, 2021 to 2036
- Table 39: Middle East and Africa Market Value (USD Million) Forecast by Application, 2021 to 2036
- Table 40: Middle East and Africa Market Value (USD Million) Forecast by Conjugate Format, 2021 to 2036
List of Figures
- Figure 1: Global Market Pricing Analysis
- Figure 2: Global Market Value (USD Million) Forecast 2021-2036
- Figure 3: Global Market Value Share and BPS Analysis by Spectral Type, 2026 and 2036
- Figure 4: Global Market Y-o-Y Growth Comparison by Spectral Type, 2026-2036
- Figure 5: Global Market Attractiveness Analysis by Spectral Type
- Figure 6: Global Market Value Share and BPS Analysis by Purity Grade, 2026 and 2036
- Figure 7: Global Market Y-o-Y Growth Comparison by Purity Grade, 2026-2036
- Figure 8: Global Market Attractiveness Analysis by Purity Grade
- Figure 9: Global Market Value Share and BPS Analysis by Application, 2026 and 2036
- Figure 10: Global Market Y-o-Y Growth Comparison by Application, 2026-2036
- Figure 11: Global Market Attractiveness Analysis by Application
- Figure 12: Global Market Value Share and BPS Analysis by Conjugate Format, 2026 and 2036
- Figure 13: Global Market Y-o-Y Growth Comparison by Conjugate Format, 2026-2036
- Figure 14: Global Market Attractiveness Analysis by Conjugate Format
- Figure 15: Global Market Value (USD Million) Share and BPS Analysis by Region, 2026 and 2036
- Figure 16: Global Market Y-o-Y Growth Comparison by Region, 2026-2036
- Figure 17: Global Market Attractiveness Analysis by Region
- Figure 18: North America Market Incremental Dollar Opportunity, 2026-2036
- Figure 19: Latin America Market Incremental Dollar Opportunity, 2026-2036
- Figure 20: Western Europe Market Incremental Dollar Opportunity, 2026-2036
- Figure 21: Eastern Europe Market Incremental Dollar Opportunity, 2026-2036
- Figure 22: East Asia Market Incremental Dollar Opportunity, 2026-2036
- Figure 23: South Asia and Pacific Market Incremental Dollar Opportunity, 2026-2036
- Figure 24: Middle East and Africa Market Incremental Dollar Opportunity, 2026-2036
- Figure 25: North America Market Value Share and BPS Analysis by Country, 2026 and 2036
- Figure 26: North America Market Value Share and BPS Analysis by Spectral Type, 2026 and 2036
- Figure 27: North America Market Y-o-Y Growth Comparison by Spectral Type, 2026-2036
- Figure 28: North America Market Attractiveness Analysis by Spectral Type
- Figure 29: North America Market Value Share and BPS Analysis by Purity Grade, 2026 and 2036
- Figure 30: North America Market Y-o-Y Growth Comparison by Purity Grade, 2026-2036
- Figure 31: North America Market Attractiveness Analysis by Purity Grade
- Figure 32: North America Market Value Share and BPS Analysis by Application, 2026 and 2036
- Figure 33: North America Market Y-o-Y Growth Comparison by Application, 2026-2036
- Figure 34: North America Market Attractiveness Analysis by Application
- Figure 35: North America Market Value Share and BPS Analysis by Conjugate Format, 2026 and 2036
- Figure 36: North America Market Y-o-Y Growth Comparison by Conjugate Format, 2026-2036
- Figure 37: North America Market Attractiveness Analysis by Conjugate Format
- Figure 38: Latin America Market Value Share and BPS Analysis by Country, 2026 and 2036
- Figure 39: Latin America Market Value Share and BPS Analysis by Spectral Type, 2026 and 2036
- Figure 40: Latin America Market Y-o-Y Growth Comparison by Spectral Type, 2026-2036
- Figure 41: Latin America Market Attractiveness Analysis by Spectral Type
- Figure 42: Latin America Market Value Share and BPS Analysis by Purity Grade, 2026 and 2036
- Figure 43: Latin America Market Y-o-Y Growth Comparison by Purity Grade, 2026-2036
- Figure 44: Latin America Market Attractiveness Analysis by Purity Grade
- Figure 45: Latin America Market Value Share and BPS Analysis by Application, 2026 and 2036
- Figure 46: Latin America Market Y-o-Y Growth Comparison by Application, 2026-2036
- Figure 47: Latin America Market Attractiveness Analysis by Application
- Figure 48: Latin America Market Value Share and BPS Analysis by Conjugate Format, 2026 and 2036
- Figure 49: Latin America Market Y-o-Y Growth Comparison by Conjugate Format, 2026-2036
- Figure 50: Latin America Market Attractiveness Analysis by Conjugate Format
- Figure 51: Western Europe Market Value Share and BPS Analysis by Country, 2026 and 2036
- Figure 52: Western Europe Market Value Share and BPS Analysis by Spectral Type, 2026 and 2036
- Figure 53: Western Europe Market Y-o-Y Growth Comparison by Spectral Type, 2026-2036
- Figure 54: Western Europe Market Attractiveness Analysis by Spectral Type
- Figure 55: Western Europe Market Value Share and BPS Analysis by Purity Grade, 2026 and 2036
- Figure 56: Western Europe Market Y-o-Y Growth Comparison by Purity Grade, 2026-2036
- Figure 57: Western Europe Market Attractiveness Analysis by Purity Grade
- Figure 58: Western Europe Market Value Share and BPS Analysis by Application, 2026 and 2036
- Figure 59: Western Europe Market Y-o-Y Growth Comparison by Application, 2026-2036
- Figure 60: Western Europe Market Attractiveness Analysis by Application
- Figure 61: Western Europe Market Value Share and BPS Analysis by Conjugate Format, 2026 and 2036
- Figure 62: Western Europe Market Y-o-Y Growth Comparison by Conjugate Format, 2026-2036
- Figure 63: Western Europe Market Attractiveness Analysis by Conjugate Format
- Figure 64: Eastern Europe Market Value Share and BPS Analysis by Country, 2026 and 2036
- Figure 65: Eastern Europe Market Value Share and BPS Analysis by Spectral Type, 2026 and 2036
- Figure 66: Eastern Europe Market Y-o-Y Growth Comparison by Spectral Type, 2026-2036
- Figure 67: Eastern Europe Market Attractiveness Analysis by Spectral Type
- Figure 68: Eastern Europe Market Value Share and BPS Analysis by Purity Grade, 2026 and 2036
- Figure 69: Eastern Europe Market Y-o-Y Growth Comparison by Purity Grade, 2026-2036
- Figure 70: Eastern Europe Market Attractiveness Analysis by Purity Grade
- Figure 71: Eastern Europe Market Value Share and BPS Analysis by Application, 2026 and 2036
- Figure 72: Eastern Europe Market Y-o-Y Growth Comparison by Application, 2026-2036
- Figure 73: Eastern Europe Market Attractiveness Analysis by Application
- Figure 74: Eastern Europe Market Value Share and BPS Analysis by Conjugate Format, 2026 and 2036
- Figure 75: Eastern Europe Market Y-o-Y Growth Comparison by Conjugate Format, 2026-2036
- Figure 76: Eastern Europe Market Attractiveness Analysis by Conjugate Format
- Figure 77: East Asia Market Value Share and BPS Analysis by Country, 2026 and 2036
- Figure 78: East Asia Market Value Share and BPS Analysis by Spectral Type, 2026 and 2036
- Figure 79: East Asia Market Y-o-Y Growth Comparison by Spectral Type, 2026-2036
- Figure 80: East Asia Market Attractiveness Analysis by Spectral Type
- Figure 81: East Asia Market Value Share and BPS Analysis by Purity Grade, 2026 and 2036
- Figure 82: East Asia Market Y-o-Y Growth Comparison by Purity Grade, 2026-2036
- Figure 83: East Asia Market Attractiveness Analysis by Purity Grade
- Figure 84: East Asia Market Value Share and BPS Analysis by Application, 2026 and 2036
- Figure 85: East Asia Market Y-o-Y Growth Comparison by Application, 2026-2036
- Figure 86: East Asia Market Attractiveness Analysis by Application
- Figure 87: East Asia Market Value Share and BPS Analysis by Conjugate Format, 2026 and 2036
- Figure 88: East Asia Market Y-o-Y Growth Comparison by Conjugate Format, 2026-2036
- Figure 89: East Asia Market Attractiveness Analysis by Conjugate Format
- Figure 90: South Asia and Pacific Market Value Share and BPS Analysis by Country, 2026 and 2036
- Figure 91: South Asia and Pacific Market Value Share and BPS Analysis by Spectral Type, 2026 and 2036
- Figure 92: South Asia and Pacific Market Y-o-Y Growth Comparison by Spectral Type, 2026-2036
- Figure 93: South Asia and Pacific Market Attractiveness Analysis by Spectral Type
- Figure 94: South Asia and Pacific Market Value Share and BPS Analysis by Purity Grade, 2026 and 2036
- Figure 95: South Asia and Pacific Market Y-o-Y Growth Comparison by Purity Grade, 2026-2036
- Figure 96: South Asia and Pacific Market Attractiveness Analysis by Purity Grade
- Figure 97: South Asia and Pacific Market Value Share and BPS Analysis by Application, 2026 and 2036
- Figure 98: South Asia and Pacific Market Y-o-Y Growth Comparison by Application, 2026-2036
- Figure 99: South Asia and Pacific Market Attractiveness Analysis by Application
- Figure 100: South Asia and Pacific Market Value Share and BPS Analysis by Conjugate Format, 2026 and 2036
- Figure 101: South Asia and Pacific Market Y-o-Y Growth Comparison by Conjugate Format, 2026-2036
- Figure 102: South Asia and Pacific Market Attractiveness Analysis by Conjugate Format
- Figure 103: Middle East and Africa Market Value Share and BPS Analysis by Country, 2026 and 2036
- Figure 104: Middle East and Africa Market Value Share and BPS Analysis by Spectral Type, 2026 and 2036
- Figure 105: Middle East and Africa Market Y-o-Y Growth Comparison by Spectral Type, 2026-2036
- Figure 106: Middle East and Africa Market Attractiveness Analysis by Spectral Type
- Figure 107: Middle East and Africa Market Value Share and BPS Analysis by Purity Grade, 2026 and 2036
- Figure 108: Middle East and Africa Market Y-o-Y Growth Comparison by Purity Grade, 2026-2036
- Figure 109: Middle East and Africa Market Attractiveness Analysis by Purity Grade
- Figure 110: Middle East and Africa Market Value Share and BPS Analysis by Application, 2026 and 2036
- Figure 111: Middle East and Africa Market Y-o-Y Growth Comparison by Application, 2026-2036
- Figure 112: Middle East and Africa Market Attractiveness Analysis by Application
- Figure 113: Middle East and Africa Market Value Share and BPS Analysis by Conjugate Format, 2026 and 2036
- Figure 114: Middle East and Africa Market Y-o-Y Growth Comparison by Conjugate Format, 2026-2036
- Figure 115: Middle East and Africa Market Attractiveness Analysis by Conjugate Format
- Figure 116: Global Market - Tier Structure Analysis
- Figure 117: Global Market - Company Share Analysis
Frequently Asked Questions
How big is the phycoerythrin market in 2026, and what is forecast for 2036?
Future Market Insights projects worldwide phycoerythrin market value at USD 68.4 million within 2026, compared with a sector valuation of USD 64.5 million across 2025. Total market size is slated to reach USD 122.5 million by 2036 as spectral flow cytometry expands.
What is the CAGR for the phycoerythrin market from 2026 to 2036?
Global phycoerythrin market value is forecast by Future Market Insights to grow 6.0% per year over the 2026 to 2036 period, creating USD 54.1 million in net new annual market value across cytometry and natural colorant applications.
Which spectral type segment leads the phycoerythrin market?
R-Phycoerythrin is slated to represent 66.1% of spectral type market value in 2026 because its three absorption peaks at 496 and 546 plus 565 nanometers support both blue and yellow-green cytometer lasers.
Which purity grade segment leads the phycoerythrin market?
Diagnostic & Flow-Cytometry Grade is projected to secure 63.9% of purity grade valuation in 2026 as monoclonal antibody conjugators require A565/A280 absorbance ratios above 5.0 and HPLC purity of at least 95%.
Which country has a notable growth outlook during the assessment period?
South Korea is projected to lead national market expansion at a 7.1% CAGR through 2036, supported by biopharma CDMO cell-therapy quality control and 27-color spectral cytometry research.
Who are the key players in the market?
Thermo Fisher Scientific Inc., Becton, Dickinson and Company, Merck KGaA, Agilent Technologies, Inc., Columbia Biosciences Corporation, Cyanotech Corporation, BioLegend, Inc., and Miltenyi Biotec B.V. & Co. KG lead commercial supply.
Preview the report firsthand - request a free sample
Get SampleGet the brochure for pricing and purchase details.
Get PDF
