Policosanol Market
Market Insights on Policosanol covering sales outlook, demand forecast & up-to-date key trends
Policosanol Market By Source (SugarcaneWax, Bees Wax, Rice Bran, Wheat Germ), Grade (0.90 Policosanol, 0.95Policosanol, 0.99Policosanol), Extraction Process (Solvent Extraction, Supercritical CO2 Extraction), Application (Food Processing, Personal Care & Cosmetics, Dietary Supplements, Nutrace utical, Animal Feed, Pet Food) & Region - Forecast to 2021 - 2031
About the Policosanols Market Report
Policosanols productsarein high demand due to various health benefits associated with them. Policosanol helps in decreasing the production of cholesterol in liver and increases the breakdown of low density lipoprotein cholesterol. It also helps in decreasing the stickiness of cells in blood. Rising health issues due to poor eating habits are driving the policosanol market.
Due to changing lifestyle and rising incidence ofhealth diseases, the demand for policosanols products is growing among health conscious consumers. Several countries are facing the rising incidence of lifestyle diseases in all age bracket,from youth to aged generation. Conditions such as diabetes, cholesterol, and arthritisare becoming widespread, which is in turn fuelling the demand for policosanols product.
Moreover, manufacturers are launching new products to meet the global demand for policosanols products.Additionally, consumer inclination towards natural products is fuelling the demand in the market. Natural supplements which are plant driven have more beneficial nutrients compared to synthetic supplements.
Policosanol is a natural supplement made from sugar cane and it is used to lower cholesterol levels and prevent blood clotting.For instance, in 2020 pharmaceutical manufacturer, Gold Coast launched a new product, Wigna policosanol that fights against heart disease, uses natural ingredient policosanol derived from sugarcane wax.Increase in population and per capita spending on healthy supplements are anticipated to drive the market over the forecast period.
In its new study, ESOMAR-certified market research and consulting firm Future Market Insights (FMI) offers insights about key factors driving demand for taurine. The report tracks the global sales of taurine in 20+ high-growth markets, along with analyzing the impact COVID-19 has had on the food and beverage industry in general, and taurine in particular.
Let us know your requirement to get
100% FREE customization
How Does Historical Policosanol Sales Compare with Future Outlook?
First policosanol supplements were produced in Cuba by Dalmer laboratories. Studies confirming the effectiveness of policosanol as a lipid lowering agent have been aiding the overall expansion of the market.Policosanolhas exhibited long term effectiveness in decreasing LDL cholesterol and increasing HDL cholesterol in older patients with hypertension.
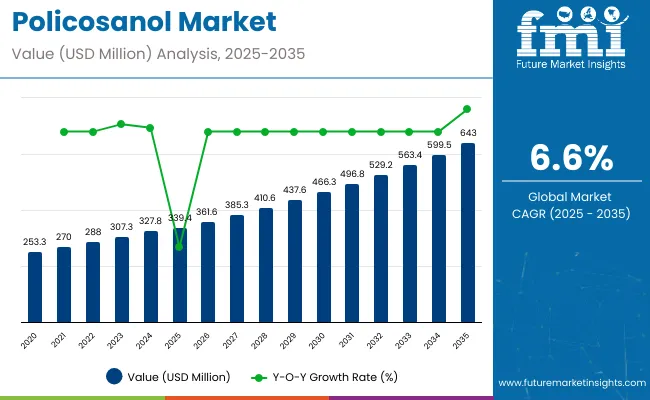
The consumption of policosanol for human is therefore considered safe and well tolerated.According to FMI’s analysis, policosanol sales have grown at 4.6% CAGR between 2016 and 2020.
Nowadays, an increase in shift towards healthy and nutritional food options is being witnessed.Consumers are becoming increasingly health conscious and are moving towards alternatives that are healthy. Moreover, natural ingredients are gaining in popularity among consumers, and the trend is entering into next phase.The increasing awareness about the various health benefits of natural ingredients will have a positive impact on policosanol sales. Owing to these factors, FMIhas forecastthe global policosanol market to grow at 5.4% CAGR through 2031.
How is Rising Health Consciousness in Consumers Affecting Policosanol Market?
Owing to changing lifestyle and increase in various diseases, consumer have become more conscious about their health. This has increased the demand for policosanol products. The multiple health benefits associated with policosanol such as its contribution in loweringbad cholesterol production in liver, increasing the breakdown of low- density lipoprotein or bad (LDL) cholesterol and helpinghigh- density lipoprotein or good (HDL) cholesterol to work better have been creating sales opportunities.
Furthermore, policosanols are helpful in controlling inflammation in body due to their anti-inflammatory properties. Another factor responsible for the increasing cases of lifestyle diseases is the oxidative stress levels in human body. Oxidative stress is present but it needs to be balanced out and policosanols have proven to be extremely effective in controlling the oxidative stress levels.
Policosanols also benefits elderly people who are suffering from hypertension. Spurred by these factors, the market will continue exhibiting strong growth through the course of the forecast period.
Find your sweet spots for generating winning opportunities in this market.
Talk to AnalystHow is Rising Demand for Natural Products Driving Policosanols Market?
Consumers are concerned about the side-effects caused by synthetic and chemicals additives used in food and beverage.This is increasing the concern surrounding the ill-effect of chemicals in human body. This in turn has been fueling the demand for natural alternatives.
Natural supplements that are plant driven have more beneficial nutrients compared to synthetic supplements. There are many health benefits associated with natural supplements which includes weight loss, no obesity, natural cures, healthy lifestyle, and weight control. The companies are focusing on introducing new dietary health supplements with enhanced benefits to expand its product portfolio and increase its customer base.
How Quality of the Product is Driving the sale of Policosanol?
Nowadays, consumers are concerned about the quality of products and are willing to pay more for products with quality assurance. Thus quality claims have become of utmost importance for any companyaiming at launches. These quality claims and certifications creates a sense of trust in consumer’s mind for the brand.
These certifications prove a supplier’s commitment to quality of product. They indicate that buyers and suppliers are dealing with a manufacturer who has reached the highest standards of product safety. Claims such as Halal and Kosher are considered to be the most premium when it comes to policosanols products. Companies that have received these certifications and quality claims have a credible name in the market.
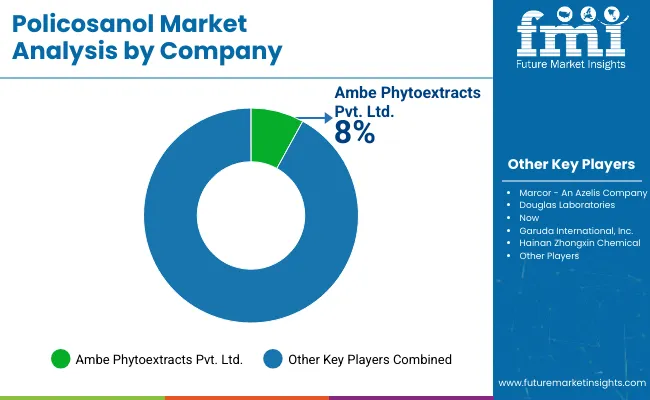
For Instance: A leading manufacturer in policosanols product called as AmbePhytoextractsPvt Ltd is FSSC 22000, HACCP, GMP, KOSHER, HALAL & ISO 9001:2015 Certified manufacturer of Herbal Extracts.
Additionally, the company HuzhouShengmaBiochem Co. Ltd. works in accordance with standards, both internal and external. This helps ensure the security of the products and business. The company can also meet the needs of customers whose definition of quality goes further, to include highly specific requirements such as Organic, non-GMO or Kosher because the company believe that quality should be measured by meeting standards, not just the company’s own.
With some of the leading organizations joining the bandwagon, focus on certifications is expected to surge. This will bode well for the market in the near future.

An unified Market Research Subscription Platform, built for today’s disparate research needs.
Country-wise Insights
Why is the Demand for Policosanol Rising in U.S Market?
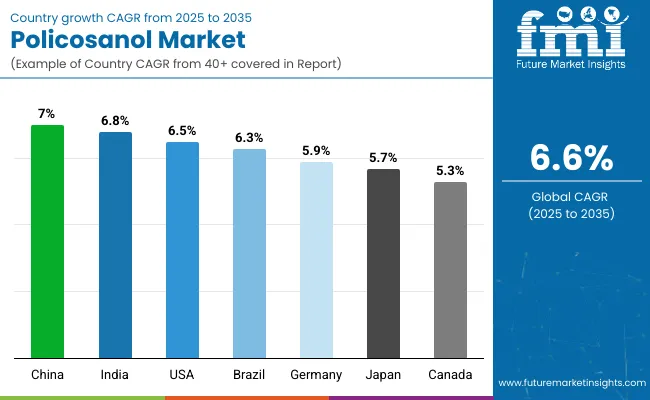
The U.S holds the dominant share of 84.1%in terms of value in the North America policosanol market. Owing to increase in usage of policosanol as a key ingredient in pharmaceuticals and nutraceutical formulation, the demand of policosanol products has surged in the U.S.
Rising incidence of concerns such as cardiovascular diseases have been fuelling the demand for effective treatment using natural ingredients. According to the Centers for Disease Control and Prevention (CDC), nearly 655,000 Americans die each year because of cardiovascular ailments. Besides this, the prevalence of diabetes is soaring in the country. To prevent such health concerns, pharmaceutical companies within the U.S. are investing in research of effective medication, which will create conducive environment for the market in the coming years.
Policosanols have proven to be extremely beneficial in maintaining a healthy lipid and triglycerides profile that eventually prevents heart attacks. Athletes specifically use Policosanol for leg pain during exercise as it helps in proper blood flow. Policosanols are very effective as an alternative treatment for arthritics and oxidative stress.
The pharmaceutical industry is capitalizing on this opportunity to formulate more capsules, chewable, and powder of policosanols to help people in blood purification as well. These benefits of policosanol utilized by the pharma industry is leading to growth of the market. Policosanol has proven to be medicinally very effective from young group segment to old age people. Thus, pharmaceutical formulations are the foremost driver for the Policosanol market growth during the forecast period.
How Big is the Opportunity in Brazil?
Brazil holds the largest market share of 39.8% in terms of value in the Latin America policosanol market. Owing to increase in consumption of plant based products, the demand for policosanol has risen. Consumers are becoming more conscious about the environment and animal welfare.
Policosanols are derived from plants, as compounds found in sugarcane and wheat. People are shifting towards healthier lifestyle and have started adopting vegetarian and vegan diets. This is expected to create sales opportunities within Brazil as well.
How is Increasing Incidence of Lifestyle Diseases Driving India Policosanol Market?
India holds the largest share in the South Asia Policosanol market. Lifestyle diseases such as cardiovascular problems, cholesterol issues, diabetes and several chronic diseases are immensely rising in country due to consumption of high calorie food and sedentary lifestyle.These factors are creating attractive opportunities for market participants.
How is Investment in R&D Fuelling Demand for Policosanols in Germany?
Germany is expected to showcase rising demand for policosanols over the forecast period. Owing to evolving consumers taste and preference, manufacturers have are focusing on improving their research and development (R&D) capacities to keep pace with dynamic market trends.
The pace at which new technologies are impacting the food sector is high, and it has become necessary for manufacturers to increase scale of their R&D efforts. As a result an increasing number of policosanol manufacturing companies in Germany are investing in research and development activities.
What Are the Factors Driving Policosanol Demand in Australia?
Australia holds the largest share in terms of value in the Oceania Policosanol market. Through the course of the forecast period, the Australia market is expected to register a steady growth, reaching a value of US$ 27.1 Mn in 2031.
Consumers have become very particularaboutchoosing products,also they have become more cautious about information available on the product. There is greater inclination towards brands offeringtransparent ingredients list. This also has to do with the rising cases of various chronic ailments in Australia, which will continue supporting the expansion of the market.
According to the Australian Institute of Health and Welfare, an estimated 1.2 million adults in Australia, aged 18 and more had one or more conditions related to heart disease in 2017-18. With the incidence predicted to rise further, consumers will show greater inclination for products containing natural ingredients. This will create a conducive environment for the expansion of the market in Australia.
Category-wise Insights
Why is Sugarcane Wax More Preferred Source of Policosanol?
Sugarcane wax currently leads the market as the leading segment in terms of source. It is more preferred than other sourcesbecause the policosanol found in sugarcane is very effective for combating cholesterol and heart attack. Apart from sugarcane wax,rice bran wax policosanol market is witnessing a high growth.
Why is Supercritical CO2 Sought-after as Preferred Extraction Process for Policosanol?
The supercritical CO2 segment leads the market in terms of extraction process. It is widely used, accounting for over 85% of policosanol extracted. Supercritical CO2 extraction process creates phase changes in carbon dioxide utilizing temperature and pressure. CO2 is known as a “tunable solvent” making it extremely versatile for creating a multitude of end products by controlling temperature and pressure.
Why is Policosanol Application High in Dietary Supplements?
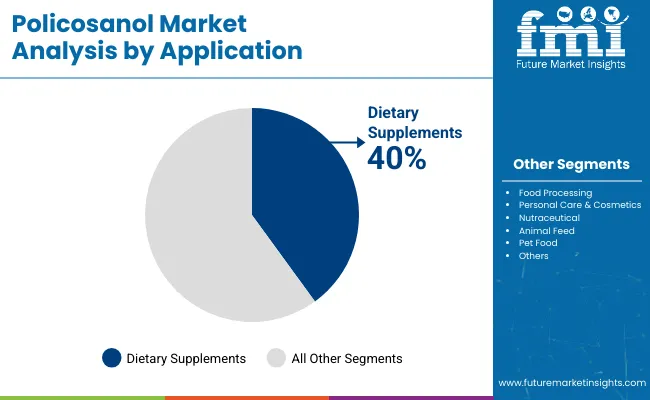
Dietary supplements hold the leading share in policosanol market. Owing to increasing awareness about various health concerns and health benefit associated with policosanol, its use in dietary supplements is increasing.
Competitive Landscape
Manufacturers of policosanol are focusing on increasing the product portfolio. They are amplifying the investment in R&D initiatives to improve their existing production capacity and expand their global presence.
For instance, in 2020 Now foods launched policosanol capsules called as ‘double strength policosanol’ which is rich in anti-oxidant that gives cholesterol support and a great source of immunity booster.
In 2020, Pahwa’s launched a refit animal care cattle feed concentrate pet health supplements. It is in a powdered form for cattle’s, poultry ad aquatic animals.
Some of the leading companies operating in the market are:
- AmbePhytoextracts
- Marcor- An Azelis Company
- Douglas Laboratories
- Now Foods
- Garuda International, Inc
- Hainan Zhongxin Chemical
- Herblink Biotech Corporation
- HuzhouShengmaBiochem Co. Ltd.
- India Glycols Ltd.
- Laboratories Dalmer S. A.
- Nutritopper Biotechnology
- Risun Bio-Tech Inc.
- Sami Labs Ltd. (Sabinsa Group)
*The list is not exhaustive, and only for representational purposes. Full competitive intelligence with SWOT analysis available in the report.
Scope of the Report
Attribute |
Details |
Forecast Period |
2021-2031 |
Historical Data Available for |
2016-2020 |
Market Analysis |
USD Million for value and MT for Volume |
Key Regions Covered |
North America, Latin America, Europe, East Asia, South Asia, Oceania Middle East & Africa |
Key Countries Covered |
US, Canada, Brazil, Mexico, Chile, Peru, Argentina, Rest of Latin America, Germany, France, Italy, U.K., Spain, BENELUX, Nordic, Poland, Russia, Rest of Europe, China, Japan, South Korea, India, Malaysia, Singapore, Indonesia, Thailand, Rest of South Asia, Australia, New Zealand, GCC Countries, South Africa, Turkey, North Africa, Central Africa, Rest of MEA |
Key Segments Covered |
Source, Grade, Extraction process and End Use Application |
Key Companies Profiled |
|
Report Coverage |
Market Forecast, brand share analysis, competition intelligence, DROT analysis, Market Dynamics and Challenges, Strategic Growth Initiatives |
Customization & Pricing |
Policosanol Market by Category
Source
- SugarcaneWax
- Bees Wax
- Rice Bran
- Wheat Germ
- Others(cereal grains, grasses etc.)
Grade
- 0.90 Policosanol
- 0.95Policosanol
- 0.99Policosanol
Extraction Process
- Solvent Extraction
- Supercritical CO2 Extraction
Application
- Food Processing
- Personal Care & Cosmetics
- Dietary Supplements
- Nutrace utical
- Animal Feed
- Pet Food
Region
- North America
- Latin America
- Europe
- East Asia
- South Asia
- Middle East and Africa (MEA)
- Oceania
Frequently Asked Questions
The U.S. presently leads the global market for policosanolbecause of the strong presence of key global players.
Sugarcane wax is the most widely used source for deriving policosanol because it is very effective for combating cholesterol and heart attack.
Dietary supplements segment has emerged as a leading end user of policosanols.
Some of the leading companies offering probiotic yogurt are AmbePhytoextracts, Marcor- An Azelis Company, Douglas Laboratories, Now, Garuda International, Inc, Hainan Zhongxin Chemical, Hainan Zhongxin Chemical, Herblink Biotech Corporation, HuzhouShengmaBiochem Co. Ltd. and others.
Supercritical CO2 is the preferred process for extraction of policosanol.
Table of Content
1. Market Overview
1.1. Global Market Outlook
1.2. Competition Blueprint
1.3. Demand-side Trends and Supply-side Trends
1.4. FMI Analysis and Recommendations
2. Scenario Assessment of the Impact of COVID-19 on Policosanol Market
2.1. Scenario Assessment of the Impact of COVID-19 on Policosanol Market
2.2. Scenario Assessment of the Impact of COVID-19 on Policosanol Market
2.3. Scenario Assessment of the Impact of COVID-19 on Policosanol Market
2.4. Market Scenario and the Forward Path
2.5. Global Policosanol Market Forecast Scenario Comparison of Annual Growth Rates for short Term (2020-2024)
2.6. Global Policosanol Market Forecast Scenario Comparison of Annual Growth Rates Long Term (2025-2030)
2.7. Policosanol Market Forecast Scenario Comparison of Annual Growth Rates
2.8. China Policosanol Market Value (US$ Mn) Scenario Forecast, 2020 & 2030
2.9. Policosanol Market Forecast Scenario Comparison of Annual Growth Rates
2.10. Europe Policosanol Market Value (US$ Mn) Scenario Forecast, 2020 & 2030
3. Key Market Trends
3.1. Key Trends Impacting the Market
3.2. Product Innovation / Development Trends/ Product launches
3.2.1. Shift Towords Natural Ingredients
3.2.2. Cultural Customization to Target Specific Populations and Ethnic Groups
3.2.3. Creating New Delivery Mechanisms
3.2.4. Preferential Inclination towords Non- Modified Convenience Ingredients
3.2.5. Packaging to Suit Customer Orientation
3.2.6. Brand Differentiation through Packaging
3.3. Policosanols Products Market Product Launch Track & Trends
3.4. Macro-Economic Factors - Relevance & Impact
3.5. Forecast Factors - Relevance & Impact
4. Value Chain Analysis and Operating Margins
4.1. Operating Margins
4.2. List of Key Manufacturers
5. Market Dynamics
5.1. Drivers
5.2. Restraints
5.3. Opportunity
6. Policy and Regulatory Landscape
6.1. Federal Food & Cosmetics Act
6.2. Europe Food & Safety Authority State
6.3. Food and Drug Administration (SFDA)
6.4. Foods for Specified Health Uses
6.5. FSSAI
6.6. Food Packaging Claims
6.7. Labelling and Claims
7. Global Policosanol Market Demand Analysis 2016-2020 and Forecast, 2021-2031
7.1. Historical Market Volume (Metric Tons) Analysis, 2016-2020
7.2. Current and Future Market Volume (Metric Tons) Projections, 2021-2031
7.2.1. Y-o-Y Growth Trend Analysis
7.2.2. Absolute $ Opportunity Analysis
8. Absolute $ Opportunity Analysis Price Point Assessment
8.1. Regional Pricing Analysis (US$/Metric Tons) By Source
8.2. Pricing Break-up by Region
8.2.1. Manufacturer Level Pricing
8.2.2. Distributor Level Pricing
8.3. Global Average Pricing Analysis Benchmark
8.4. Factors Influencing Pricing
9. Global Policosanol Market Demand (in Value or Size in US$ Mn) Analysis 2016-2020 and Forecast, 2021-2031
9.1. Historical Market Value (US$ Mn) Analysis, 2016-2020
9.2. Current and Future Market Value (US$ Mn) Projections, 2021-2031
9.2.1. Y-o-Y Growth Trend Analysis
9.2.2. Absolute $ Opportunity Analysis
10. Global Policosanol Market Analysis 2016-2020 and Forecast 2021-2031, By Source
10.1. Introduction / Key Findings
10.2. Historical Market Size (US$ Mn) and Volume Analysis By Grade, 2016- 2020
10.3. Current and Future Market Size (US$ Mn) and Volume Analysis and Forecast By Source, 2021 – 2031
10.3.1. Sugar Cane Wax
10.3.2. Beeswax
10.3.3. Rice Bran
10.3.4. Wheat Germ
10.3.5. Others (cereal grains, grasses, leaves, fruits, nuts, and seeds of many foods)
10.4. Market Attractiveness Analysis By Source
11. Global Policosanol Market Analysis 2016-2020 and Forecast 2021-2031, By Grade
11.1. Introduction / Key Findings
11.2. Historical Market Size (US$ Mn) and Volume Analysis By Grade, 2016- 2020
11.3. Current and Future Market Size (US$ Mn) and Volume Analysis and Forecast By Grade, 2021 – 2031
11.3.1. 90%
11.3.2. 95%
11.3.3. 99%
11.4. Market Attractiveness Analysis By Grade
12. Global Policosanol Market Analysis 2016-2020 and Forecast 2021-2031, By Extraction Process
12.1. Introduction / Key Findings
12.2. Historical Market Size (US$ Mn) and Volume Analysis By Extraction Process, 2016-2020
12.3. Current and Future Market Size (US$ Mn) and Volume Analysis and Forecast By Extraction Process, 2021-2031
12.3.1. Solvent Extraction
12.3.2. Supercritical CO2 Extraction
12.4. Market Attractiveness Analysis By Extraction Process
13. Global Policosanol Market Analysis 2016-2020 and Forecast 2021-2031, By End Use Application
13.1. Introduction / Key Findings
13.2. Historical Market Size (US$ Mn) and Volume Analysis By End Use Application, 2016 – 2020
13.3. Current and Future Market Size (US$ Mn) and Volume Analysis and Forecast By Application, 2021 – 2031
13.3.1. Food Processing
13.3.2. Personal Care and Cosmetics
13.3.3. Dietary Supplements
13.3.4. Nutraceuticals
13.3.5. Animal Feed
13.3.6. Pet Food
13.4. Market Attractiveness Analysis By End Use Application
14. Global Policosanol Market Analysis 2016-2020 and Forecast 2021-2031, By Region
14.1. Introduction
14.2. Historical Market Size (US$ Mn) and Volume Analysis By Region, 2016-2020
14.3. Current Market Size (US$ Mn) and Volume Analysis and Forecast By Region, 2021 - 2031
14.3.1. North America
14.3.2. Latin America
14.3.3. Europe
14.3.4. East Asia
14.3.5. South Asia
14.3.6. Oceania
14.3.7. Middle East and Africa (MEA)
15. North America Policosanol Market Analysis 2016-2020 and Forecast 2021-2031
15.1. Introduction
15.2. Historical Market Size (US$ Mn) and Volume Trend Analysis By Market Taxonomy, 2016-2020
15.3. Market Size (US$ Mn) and Volume Forecast By Market Taxonomy, 2021-2031
15.3.1. By Country
15.3.1.1. U.S
15.3.1.2. Canada
15.3.2. By Source
15.3.3. By Grade
15.3.4. By Extraction Process
15.3.5. By End Use Application
15.4. Market Attractiveness Analysis
15.4.1. By Country
15.4.2. By Source
15.4.3. By Grade
15.4.4. By Extraction Process
15.4.5. By End Use Application
15.5. Market Share (%) Analysis, 2020
15.5.1. U.S.
15.5.1.1. By Source
15.5.1.2. By Grade
15.5.1.3. By Extraction Process
15.5.1.4. By End Use Application
15.5.2. Canada
15.5.2.1. By Source
15.5.2.2. By Grade
15.5.2.3. By Extraction Process
15.5.2.4. By End Use Application
16. Latin America Policosanol Market Analysis 2016-2020 and Forecast 2021-2031
16.1. Introduction
16.2. Historical Market Size (US$ Mn) and Volume Trend Analysis By Market Taxonomy, 2016-2020
16.3. Market Size (US$ Mn) and Volume Forecast By Market Taxonomy, 2021-2031
16.3.1. By Country
16.3.1.1. Brazil
16.3.1.2. Mexico
16.3.1.3. Chile
16.3.1.4. Peru
16.3.1.5. Argentina
16.3.1.6. Rest of Latin America
16.3.2. By Source
16.3.3. By Grade
16.3.4. By Extraction Process
16.3.5. By End Use Application
16.4. Market Attractiveness Analysis
16.4.1. By Country
16.4.2. By Source
16.4.3. By Grade
16.4.4. By Extraction Process
16.4.5. By End Use Application
16.5. Market Share (%) Analysis, 2020
16.5.1. Brazil
16.5.1.1. By Source
16.5.1.2. By Grade
16.5.1.3. By Extraction Process
16.5.1.4. By End Use Application
16.5.2. Mexico
16.5.2.1. By Source
16.5.2.2. By Grade
16.5.2.3. By Extraction Process
16.5.2.4. By End Use Application
16.5.3. Chile
16.5.3.1. By Source
16.5.3.2. By Grade
16.5.3.3. By Extraction Process
16.5.3.4. By End Use Application
16.5.4. Peru
16.5.4.1. By Source
16.5.4.2. By Grade
16.5.4.3. By Extraction Process
16.5.4.4. By End Use Application
16.5.5. Argentina
16.5.5.1. By Source
16.5.5.2. By Grade
16.5.5.3. By Extraction Process
16.5.5.4. By End Use Application
16.5.6. Rest of Latin America
16.5.6.1. By Nutritional Class
16.5.6.2. By Function
16.5.6.3. By Age
16.5.6.4. By Distribution Channel
17. Europe Policosanol Market Analysis 2016-2020 and Forecast 2021-2031
17.1. Introduction
17.2. Historical Market Size (US$ Mn) and Volume Trend Analysis By Market Taxonomy, 2016-2020
17.3. Market Size (US$ Mn) and Volume Forecast By Market Taxonomy, 2021-2031
17.3.1. By Country
17.3.1.1. Germany
17.3.1.2. Italy
17.3.1.3. France
17.3.1.4. U.K
17.3.1.5. Spain
17.3.1.6. BENELUX
17.3.1.7. Russia
17.3.1.8. Poland
17.3.1.9. Rest of Europe
17.3.2. By Source
17.3.3. By Grade
17.3.4. By Extraction Process
17.3.5. By End Use Application
17.4. Market Attractiveness Analysis
17.4.1. By Country
17.4.2. By Source
17.4.3. By Grade
17.4.4. By Extraction Process
17.4.5. By End Use Application
17.5. Market Share (%) Analysis, 2020
17.5.1. Germany
17.5.1.1. By Source
17.5.1.2. By Grade
17.5.1.3. By Extraction Process
17.5.1.4. By End Use Application
17.5.2. Italy
17.5.2.1. By Source
17.5.2.2. By Grade
17.5.2.3. By Extraction Process
17.5.2.4. By End Use Application
17.5.3. France
17.5.3.1. By Source
17.5.3.2. By Grade
17.5.3.3. By Extraction Process
17.5.3.4. By End Use Application
17.5.4. U.K
17.5.4.1. By Source
17.5.4.2. By Grade
17.5.4.3. By Extraction Process
17.5.4.4. By End Use Application
17.5.5. Spain
17.5.5.1. By Source
17.5.5.2. By Grade
17.5.5.3. By Extraction Process
17.5.5.4. By End Use Application
17.5.6. Benelux
17.5.6.1. By Source
17.5.6.2. By Grade
17.5.6.3. By Extraction Process
17.5.6.4. By End Use Application
17.5.7. Russia
17.5.7.1. By Source
17.5.7.2. By Grade
17.5.7.3. By Extraction Process
17.5.7.4. By End Use Application
17.5.8. Poland
17.5.8.1. By Source
17.5.8.2. By Grade
17.5.8.3. By Extraction Process
17.5.8.4. By End Use Application
17.5.9. Rest of the Europe
17.5.9.1. By Source
17.5.9.2. By Grade
17.5.9.3. By Extraction Process
17.5.9.4. By End Use Application
17.6. South Asia Policosanol Market Analysis 2016-2020 and Forecast 2021-2031
17.7. Introduction
17.8. Historical Market Size (US$ Mn) and Volume Trend Analysis By Market Taxonomy, 2016-2020
17.9. Market Size (US$ Mn) and Volume Forecast By Market Taxonomy, 2021-2031
17.9.1. By Country
17.9.1.1. India
17.9.1.2. Thailand
17.9.1.3. Indonesia
17.9.1.4. Malaysia
17.9.1.5. Rest of South Asia
17.9.2. By Source
17.9.3. By Grade
17.9.4. By Extraction Process
17.9.5. By End Use Application
17.10. Market Attractiveness Analysis
17.10.1. By Country
17.10.2. By Source
17.10.3. By Grade
17.10.4. By Extraction Process
17.10.5. By End Use Application
17.11. Market Share (%) Analysis, 2020
17.11.1.1. India
17.11.1.1. By Source
17.11.1.2. By Grade
17.11.1.3. By Extraction Process
17.11.1.4. By End Use Application
17.11.1.5. Thailand
17.11.1.1. By Source
17.11.1.2. By Grade
17.11.1.3. By Extraction Process
17.11.1.4. By End Use Application
17.11.1.5. Indonesia
17.11.1.1. By Source
17.11.1.2. By Grade
17.11.1.3. By Extraction Process
17.11.1.4. By End Use Application
17.11.1.5. Malaysia
17.11.1.1. By Source
17.11.1.2. By Grade
17.11.1.3. By Extraction Process
17.11.1.4. By End Use Application
17.11.1.5. Rest of South Asia
17.11.1.1. By Source
17.11.1.2. By Grade
17.11.1.3. By Extraction Process
17.11.1.4. By End Use Application
18. East Asia Policosanol Market Analysis 2016-2020 and Forecast 2021-2031
18.1. Introduction
18.2. Historical Market Size (US$ Mn) and Volume Trend Analysis By Market Taxonomy, 2016-2020
18.3. Market Size (US$ Mn) and Volume Forecast By Market Taxonomy, 2021-2031
18.3.1. By Country
18.3.1.1. China
18.3.1.2. Japan
18.3.1.3. South Korea
18.3.2. By Source
18.3.3. By Grade
18.3.4. By Extraction Process
18.3.5. By End Use Application
18.4. Market Attractiveness Analysis
18.4.1. By Country
18.4.2. By Source
18.4.3. By Grade
18.4.4. By Extraction Process
18.4.5. By End Use Application
18.5. Market Share (%) Analysis, 2020
18.5.1. China
18.5.1.1. By Source
18.5.1.2. By Grade
18.5.1.3. By Extraction Process
18.5.1.4. By End Use Application
18.5.2. Japan
18.5.2.1. By Source
18.5.2.2. By Grade
18.5.2.3. By Extraction Process
18.5.2.4. By End Use Application
18.5.3. South Korea
18.5.3.1. By Source
18.5.3.2. By Grade
18.5.3.3. By Extraction Process
18.5.3.4. By End Use Application
19. Oceania Policosanol Market Analysis 2016-2020 and Forecast 2021-2031
19.1. Introduction
19.2. Historical Market Size (US$ Mn) and Volume Trend Analysis By Market Taxonomy, 2016-2020
19.3. Market Size (US$ Mn) and Volume Forecast By Market Taxonomy, 2021-2031
19.3.1. By Country
19.3.1.1. Australia
19.3.1.2. New Zealand
19.3.2. By Source
19.3.3. By Grade
19.3.4. By Extraction Process
19.3.5. By End Use Application
19.4. Market Attractiveness Analysis
19.4.1. By Country
19.4.2. By Source
19.4.3. By Grade
19.4.4. By Extraction Process
19.4.5. By End Use Application
19.5. Market Share (%) Analysis, 2021
19.5.1. Australia
19.5.1.1. By Source
19.5.1.2. By Grade
19.5.1.3. By Extraction Process
19.5.1.4. By End Use Application
19.5.2. New Zealand
19.5.2.1. By Source
19.5.2.2. By Grade
19.5.2.3. By Extraction Process
19.5.2.4. By End Use Application
20. Middle East and Africa PolicosanolMarket Analysis 2016-2020 and Forecast 2021-2031
20.1. Introduction
20.2. Historical Market Size (US$ Mn) and Volume Trend Analysis By Market Taxonomy, 2016-2020
20.3. Market Size (US$ Mn) and Volume Forecast By Market Taxonomy, 2021-2031
20.3.1. By Country
20.3.1.1. GCC Countries
20.3.1.2. Turkey
20.3.1.3. Northen Africa
20.3.1.4. South Africa
20.3.1.5. Rest of Middle East and Africa
20.3.2. By Source
20.3.3. By Grade
20.3.4. By Extraction Process
20.3.5. By End Use Application
20.4. Market Attractiveness Analysis
20.4.1. By Country
20.4.2. By Source
20.4.3. By Grade
20.4.4. By Extraction Process
20.4.5. By End Use Application
20.5. Market Share Analysis By Country, 2020
20.5.1. GCC Countries
20.5.1.1. By Source
20.5.1.2. By Grade
20.5.1.3. By Extraction Process
20.5.1.4. By End Use Application
20.5.2. Turkey
20.5.2.1. By Source
20.5.2.2. By Grade
20.5.2.3. By Extraction Process
20.5.2.4. By End Use Application
20.5.3. Northern Africa
20.5.3.1. By Source
20.5.3.2. By Grade
20.5.3.3. By Extraction Process
20.5.3.4. By End Use Application
20.5.4. South Africa
20.5.4.1. By Source
20.5.4.2. By Grade
20.5.4.3. By Extraction Process
20.5.4.4. By End Use Application
20.5.5. Rest of MEA
20.5.5.1. By Source
20.5.5.2. By Grade
20.5.5.3. By Extraction Process
20.5.5.4. By End Use Application
21. Emerging Countries Policosanol Market Analysis 2016-2020 and Forecast 2021-2031
21.1. Introduction
21.2. Historical Market Size (US$ Mn) and Volume Trend Analysis By Market Taxonomy, 2016-2020
21.3. Market Size (US$ Mn) and Volume Forecast By Market Taxonomy, 2021-2031
21.3.1. By Country
21.3.1.1. India
21.3.1.2. China
21.3.2. By Source
21.3.3. By Grade
21.3.4. By End Use Application
21.4. Market Attractiveness Analysis
21.4.1. By Country
21.4.2. By Source
21.4.3. By Grade
21.4.4. By End Use Application
21.5. Drivers and Restraints - Impact Analysis
22. Market Structure Analysis
22.1. Global Policosanol Market Competition - a Dashboard View
22.2. Global Policosanol Market Structure Analysis
22.3. Global Policosanol Market Company Share Analysis
22.3.1. Company Market Share Analysis of Top 10 Players, By Region
22.3.2. Company Market Share Analysis of Top 10 Players, By Product Type
22.4. Key Participants Market Presence (Intensity Mapping) by Region
23. Competition Analysis
23.1. Competition Dashboard
23.2. Competition Deep Dive
23.2.1. AMBE PHYTOEXTRACTS
23.2.1.1. Overview
23.2.1.2. Product Portfolio
23.2.1.3. Key Developments/Key Takeaways
23.2.1.4. Strategy Overview
23.2.1.5. Financial Overview
23.2.2. Marcor- An Azelis Company
23.2.2.1. Overview
23.2.2.2. Product Portfolio
23.2.2.3. Key Developments/Key Takeaways
23.2.2.4. Strategy Overview
23.2.2.5. Financial Overview
23.2.3. Douglas Laboratories
23.2.3.1. Overview
23.2.3.2. Product Portfolio
23.2.3.3. Key Developments/Key Takeaways
23.2.3.4. Strategy Overview
23.2.3.5. Financial Overview
23.2.4. Now
23.2.4.1. Overview
23.2.4.2. Product Portfolio
23.2.4.3. Key Developments/Key Takeaways
23.2.4.4. Strategy Overview
23.2.4.5. Financial Overview
23.2.5. Garuda International Inc
23.2.5.1. Overview
23.2.5.2. Product Portfolio
23.2.5.3. Key Developments/Key Takeaways
23.2.5.4. Strategy Overview
23.2.5.5. Financial Overview
23.2.6. Hainan Zhongxin Chemical
23.2.6.1. Overview
23.2.6.2. Product Portfolio
23.2.6.3. Key Developments/Key Takeaways
23.2.6.4. Strategy Overview
23.2.6.5. Financial Overview
23.2.7. Herblink Biotech
23.2.7.1. Overview
23.2.7.2. Product Portfolio
23.2.7.3. Key Developments/Key Takeaways
23.2.7.4. Strategy Overview
23.2.7.5. Financial Overview
23.2.8. HuzhouShengmaBiochem Co. Ltd.
23.2.8.1. Overview
23.2.8.2. Product Portfolio
23.2.8.3. Key Developments/Key Takeaways
23.2.8.4. Strategy Overview
23.2.8.5. Financial Overview
23.2.9. India Glycols Ltd.
23.2.9.1. Overview
23.2.9.2. Product Portfolio
23.2.9.3. Key Developments/Key Takeaways
23.2.9.4. Strategy Overview
23.2.9.5. Financial Overview
23.2.10. Laboratoiros Dalmer S. A
23.2.10.1. Overview
23.2.10.2. Product Portfolio
23.2.10.3. Key Developments/Key Takeaways
23.2.10.4. Strategy Overview
23.2.10.5. Financial Overview
23.2.11. Nutritopper biotechnology
23.2.11.1. Overview
23.2.11.2. Product Portfolio
23.2.11.3. Key Developments/Key Takeaways
23.2.11.4. Strategy Overview
23.2.11.5. Financial Overview
23.2.12. Oxynature Products Pvt. Ltd.
23.2.12.1. Overview
23.2.12.2. Product Portfolio
23.2.12.3. Key Developments/Key Takeaways
23.2.12.4. Strategy Overview
23.2.12.5. Financial Overview
23.2.13. Risun Bio-Tech Inc.
23.2.13.1. Overview
23.2.13.2. Product Portfolio
23.2.13.3. Key Developments/Key Takeaways
23.2.13.4. Strategy Overview
23.2.13.5. Financial Overview
23.2.14. Sami Labs Ltd. (Sabinsa Group)
23.2.14.1. Overview
23.2.14.2. Product Portfolio
23.2.14.3. Key Developments/Key Takeaways
23.2.14.4. Strategy Overview
23.2.14.5. Financial Overview
23.2.15. Shanghai Freemen
23.2.15.1. Overview
23.2.15.2. Product Portfolio
23.2.15.3. Key Developments/Key Takeaways
23.2.15.4. Strategy Overview
23.2.15.5. Financial Overview
23.2.16. Xi\'an Huilin Bio-Tech
23.2.16.1. Overview
23.2.16.2. Product Portfolio
23.2.16.3. Key Developments/Key Takeaways
23.2.16.4. Strategy Overview
23.2.16.5. Financial Overview
23.2.17. Xian Pincredit Bio-Tech
23.2.17.1. Overview
23.2.17.2. Product Portfolio
23.2.17.3. Key Developments/Key Takeaways
23.2.17.4. Strategy Overview
23.2.17.5. Financial Overview
23.2.18. BioActivesA
23.2.18.1. Overview
23.2.18.2. Product Portfolio
23.2.18.3. Key Developments/Key Takeaways
23.2.18.4. Strategy Overview
23.2.18.5. Financial Overview
24. ssumptions and Acronyms Used
25. Research Methodology
Let us know your requirement to get
100% FREE customization
List of Tables
Table 01: Global Policosanol Market Size, Market Volume (MT), 2016-2031
Table 02: Global Policosanol Market Size, Incremental $ Opportunity (US$ Mn) , 2016-2031
Table 03: Global Policosanol Market Share and BPS Analysis by Source – 2021 & 2031
Table 04: Global Policosanol Market Attractiveness Analysis by Source, 2021-2031
Table 05: Global Policosanol Market Sugarcane Wax Source Market Value (US$ Mn), Volume (MT) and Forecast, 2016-2031
Table 06: Global Policosanol Market Sugarcane Wax Source Incremental $ Opportunity, 2020-2031
Table 07: Global Policosanol Market Bees Wax Source Market Value (US$ Mn), Volume (MT) and Forecast, 2016-2031
Table 08: Global Policosanol Market Bees Wax Source Incremental $ Opportunity, 2020-2031
Table 09: Global Policosanol Market Rice Bran Wax Source Market Value (US$ Mn), Volume (MT) and Forecast, 2016-2031
Table 10: Global Policosanol Market Rice Bran Wax Source Incremental $ Opportunity, 2020-2031
Table 11: Global Policosanol Market Wheat Germ Wax Source Market Value (US$ Mn), Volume (MT) and Forecast, 2016-2031
Table 12: Global Policosanol Market Wheat Germ Wax Source Incremental $ Opportunity, 2020-2031
Table 13: Global Policosanol Market Others Source Market Value (US$ Mn), Volume (MT) and Forecast, 2016-2031
Table 14: Global Policosanol Market Others Source Incremental $ Opportunity, 2020-2031
Table 15: Global Policosanol Market Share and BPS Analysis by Grade– 2021 & 2031
Table 16: Global Policosanol Market Attractiveness Analysis by Grade, 2021-2031
Table 17: Global Policosanol Market 90% Grade Market Value (US$ Mn), Volume (MT) and Forecast, 2016-2031
Table 18: Global Policosanol Market 90% Grade Incremental $ Opportunity, 2020-2031
Table 19: Global Policosanol Market 95% Grade Market Value (US$ Mn), Volume (MT) and Forecast, 2016-2031
Table 20: Global Policosanol Market 95% Grade Incremental $ Opportunity, 2020-2031
Table 21: Global Policosanol Market 99% Grade Market Value (US$ Mn), Volume (MT) and Forecast, 2016-2031
Table 22: Global Policosanol Market 99% Grade Incremental $ Opportunity, 2020-2031
Table 23: Global Policosanol Market Share and BPS Analysis by Extraction Process– 2021 & 2031
Table 24: Global Policosanol Market Attractiveness Analysis by Extraction Process, 2021-2031
Table 25: Global Policosanol Market Solvent Extraction Market Value (US$ Mn), Volume (MT) and Forecast, 2016-2031
Table 26: Global Policosanol Market Solvent Extraction Incremental $ Opportunity, 2020-2031
Table 27: Global Policosanol Market Supercritical CO2 Extraction Market Value (US$ Mn), Volume (MT) and Forecast, 2016-2031
Table 28: Global Policosanol Market Supercritical CO2 Extraction Incremental $ Opportunity, 2020-2031
Table 29: Global Policosanol Market Share and BPS Analysis by End Use Application– 2021 & 2031
Table 30: Global Policosanol Market Attractiveness Analysis by End Use Application, 2021-2031
Table 31: Global Policosanol Market Food Processing Market Value (US$ Mn), Volume (MT) and Forecast, 2016-2031
Table 32: Global Policosanol Market Food Processing Incremental $ Opportunity, 2020-2031
Table 33: Global Policosanol Market Personal Care & Cosmetics Market Value (US$ Mn), Volume (MT) and Forecast, 2016-2031
Table 34: Global Policosanol Market Personal Care & Cosmetics Incremental $ Opportunity, 2020-2031
Table 35: Global Policosanol Market Dietary Supplements Market Value (US$ Mn), Volume (MT) and Forecast, 2016-2031
Table 36: Global Policosanol Market Dietary Supplements Incremental $ Opportunity, 2020-2031
Table 37: Global Policosanol Market Nutraceuticals Market Value (US$ Mn), Volume (MT) and Forecast, 2016-2031
Table 38: Global Policosanol Market Nutraceuticals Incremental $ Opportunity, 2020-2031
Table 39: Global Policosanol Market Animal Feed Market Value (US$ Mn), Volume (MT) and Forecast, 2016-2031
Table 40: Global Policosanol Market Animal Feed Incremental $ Opportunity, 2020-2031
Table 41: Global Policosanol Market Pet Food Market Value (US$ Mn), Volume (MT) and Forecast, 2016-2031
Table 42: Global Policosanol Market Pet Food Incremental $ Opportunity, 2020-2031
Table 43: Global Policosanol Market Value Share (%) and BPS Analysis by Region, 2016, 2021 & 2031
Table 44: Global Policosanol Market Y-o-Y Growth (%) Projections by Segment, 2021-2031
Table 45: North America Policosanol Absolute $ Opportunity Analysis, 2021-2031
Table 46: Latin America Policosanol Absolute $ Opportunity Analysis, 2021-2031
Table 47: Europe Policosanol Absolute $ Opportunity Analysis, 2021-2031
Table 48: South Asia Policosanol Absolute $ Opportunity Analysis, 2021-2031
Table 49: East Asia Policosanol Absolute $ Opportunity Analysis, 2021-2031
Table 50: Oceania Policosanol Absolute $ Opportunity Analysis, 2021-2031
Table 51: Middle East & Africa Policosanol Absolute $ Opportunity Analysis, 2021-2031
Table 52: Global Policosanol Market Attractiveness Analysis, 2021-2031
Table 53: North America Policosanol Market Value (US$ Mn), Volume (MT) Forecast and Analysis, 2021-2031
Table 54: U.S. Policosanol Market Incremental $ Opportunity, 2021-2031
Table 55: Canada Policosanol Market Incremental $ Opportunity, 2021-2031
Table 56: North America Policosanol Market Share and BPS Analysis by Source – 2021 & 2031
Table 57: North America Policosanol Market Attractiveness Analysis by Source, 2021-2031
Table 58: North America Policosanol Market Share and BPS Analysis by Grade– 2021 & 2031
Table 59: North America Policosanol Market Attractiveness Analysis by Grade, 2021-2031
Table 60: North America Policosanol Market Share and BPS Analysis by Extraction Process– 2021 & 2031
Table 61: North America Policosanol Market Attractiveness Analysis by Extraction Process, 2021-2031
Table 62: North America Policosanol Market Share and BPS Analysis by End Use Application– 2021 & 2031
Table 63: North America Policosanol Market Attractiveness Analysis by End Use Application, 2021-2031
Table 64: U.S. Market Value Share Analysis by Source, 2021
Table 65: U.S. Market Value Share Analysis by Extraction Process, 2021
Table 66: U.S. Market Value Share Analysis by End Use Application, 2021
Table 67: U.S. Market Value Share Analysis by Grade, 2021
Table 68: Canada Market Value Share Analysis by Source, 2021
Table 69: Canada Market Value Share Analysis by Extraction Process, 2021
Table 70: Canada Market Value Share Analysis by End Use Application, 2021
Table 71: Canada Market Value Share Analysis by Grade, 2021
Table 72: Latin America Policosanol Market Value (US$ Mn), Volume (MT) Forecast and Analysis, 2021-2031
Table 73: Brazil Policosanol Market Incremental $ Opportunity, 2021-2031
Table 74: Mexico Policosanol Market Incremental $ Opportunity, 2021-2031
Table 75: Chile Policosanol Market Incremental $ Opportunity, 2021-2031
Table 76: Peru Policosanol Market Incremental $ Opportunity, 2021-2031
Table 77: Argentina Policosanol Market Incremental $ Opportunity, 2021-2031
Table 78: Rest of Latin America Policosanol Market Incremental $ Opportunity, 2021-2031
Table 79: Latin America Policosanol Market Share and BPS Analysis by Source – 2021 & 2031
Table 80: Latin America Policosanol Market Attractiveness Analysis by Source, 2021-2031
Table 81: Latin America Policosanol Market Share and BPS Analysis by Grade– 2021 & 2031
Table 82: Latin America Policosanol Market Attractiveness Analysis by Grade, 2021-2031
Table 83: Latin America Policosanol Market Share and BPS Analysis by Extraction Process– 2021 & 2031
Table 84: Latin America Policosanol Market Attractiveness Analysis by Extraction Process, 2021-2031
Table 85: Latin America Policosanol Market Share and BPS Analysis by End Use Application– 2021 & 2031
Table 86: Latin America Policosanol Market Attractiveness Analysis by End Use Application, 2021-2031
Table 87: Brazil Market Value Share Analysis by Source, 2021
Table 88: Brazil Market Value Share Analysis by Extraction Process, 2021
Table 89: Brazil Market Value Share Analysis by End Use Application, 2021
Table 90: Brazil Market Value Share Analysis by Grade, 2021
Table 91: Mexico Market Value Share Analysis by Source, 2021
Table 92: Mexico Market Value Share Analysis by Extraction Process, 2021
Table 93: Mexico Market Value Share Analysis by End Use Application, 2021
Table 94: Mexico Market Value Share Analysis by Grade, 2021
Table 95: Chile Market Value Share Analysis by Source, 2021
Table 96: Chile Market Value Share Analysis by Extraction Process, 2021
Table 97: Chile Market Value Share Analysis by End Use Application, 2021
Table 98: Chile Market Value Share Analysis by Grade, 2021
Table 99: Peru Market Value Share Analysis by Source, 2021
Table 100: Peru Market Value Share Analysis by Extraction Process, 2021
Table 101: Peru Market Value Share Analysis by End Use Application, 2021
Table 102: Peru Market Value Share Analysis by Grade, 2021
Table 103: Argentina Market Value Share Analysis by Source, 2021
Table 104: Argentina Market Value Share Analysis by Extraction Process, 2021
Table 105: Argentina Market Value Share Analysis by End Use Application, 2021
Table 106: Argentina Market Value Share Analysis by Grade, 2021
Table 107: Rest of Latin America Market Value Share Analysis by Source, 2021
Table 108: Rest of Latin America Market Value Share Analysis by Extraction Process, 2021
Table 109: Rest of Latin America Market Value Share Analysis by End Use Application, 2021
Table 110: Rest of Latin America Market Value Share Analysis by Grade, 2021
Table 111: Europe Policosanol Market Value (US$ Mn), Volume (MT) Forecast and Analysis, 2021-2031
Table 112: Germany Policosanol Market Incremental $ Opportunity, 2021-2031
Table 113: Italy Policosanol Market Incremental $ Opportunity, 2021-2031
Table 114: France Policosanol Market Incremental $ Opportunity, 2021-2031
Table 115: U.K. Policosanol Market Incremental $ Opportunity, 2021-2031
Table 116: Spain Policosanol Market Incremental $ Opportunity, 2021-2031
Table 117: BENELUX Policosanol Market Incremental $ Opportunity, 2021-2031
Table 118: Nordic Policosanol Market Incremental $ Opportunity, 2021-2031
Table 119: Russia Policosanol Market Incremental $ Opportunity, 2021-2031
Table 120: Poland Policosanol Market Incremental $ Opportunity, 2021-2031
Table 121: Rest of Europe Policosanol Market Incremental $ Opportunity, 2021-2031
Table 122: Europe Policosanol Market Share and BPS Analysis by Source – 2021 & 2031
Table 123: Europe Policosanol Market Attractiveness Analysis by Source, 2021-2031
Table 124: Europe Policosanol Market Share and BPS Analysis by Grade– 2021 & 2031
Table 125: Europe Policosanol Market Attractiveness Analysis by Grade, 2021-2031
Table 126: Europe Policosanol Market Share and BPS Analysis by Extraction Process– 2021 & 2031
Table 127: Europe Policosanol Market Attractiveness Analysis by Extraction Process, 2021-2031
Table 128: Europe Policosanol Market Share and BPS Analysis by End Use Application– 2021 & 2031
Table 129: Europe Policosanol Market Attractiveness Analysis by End Use Application, 2021-2031
Table 130: Germany Market Value Share Analysis by Source, 2021
Table 131: Germany Market Value Share Analysis by Extraction Process, 2021
Table 132: Germany Market Value Share Analysis by End Use Application, 2021
Table 133: Germany Market Value Share Analysis by Grade, 2021
Table 134: Italy Market Value Share Analysis by Source, 2021
Table 135: Italy Market Value Share Analysis by Extraction Process, 2021
Table 136: Italy Market Value Share Analysis by End Use Application, 2021
Table 137: Italy Market Value Share Analysis by Grade, 2021
Table 138: France Market Value Share Analysis by Source, 2021
Table 139: France Market Value Share Analysis by Extraction Process, 2021
Table 140: France Market Value Share Analysis by End Use Application, 2021
Table 141: France Market Value Share Analysis by Grade, 2021
Table 142: U.K. Market Value Share Analysis by Source, 2021
Table 143: U.K. Market Value Share Analysis by Extraction Process, 2021
Table 144: U.K. Market Value Share Analysis by End Use Application, 2021
Table 145: U.K. Market Value Share Analysis by Grade, 2021
Table 146: Spain Market Value Share Analysis by Source, 2021
Table 147: Spain Market Value Share Analysis by Extraction Process, 2021
Table 148: Spain Market Value Share Analysis by End Use Application, 2021
Table 149: Spain Market Value Share Analysis by Grade, 2021
Table 150: BENELUX Market Value Share Analysis by Source, 2021
Table 151: BENELUX Market Value Share Analysis by Extraction Process, 2021
Table 152: BENELUX Market Value Share Analysis by End Use Application, 2021
Table 153: BENELUX Market Value Share Analysis by Grade, 2021
Table 154: Nordic Market Value Share Analysis by Source, 2021
Table 155: Nordic Market Value Share Analysis by Extraction Process, 2021
Table 156: Nordic Market Value Share Analysis by End Use Application, 2021
Table 157: Nordic Market Value Share Analysis by Grade, 2021
Table 158: Russia Market Value Share Analysis by Source, 2021
Table 159: Russia Market Value Share Analysis by Extraction Process, 2021
Table 160: Russia Market Value Share Analysis by End Use Application, 2021
Table 161: Russia Market Value Share Analysis by Grade, 2021
Table 162: Poland Market Value Share Analysis by Source, 2021
Table 163: Poland Market Value Share Analysis by Extraction Process, 2021
Table 164: Poland Market Value Share Analysis by End Use Application, 2021
Table 165: Poland Market Value Share Analysis by Grade, 2021
Table 166: Rest of Europe Market Value Share Analysis by Source, 2021
Table 167: Rest of Europe Market Value Share Analysis by Extraction Process, 2021
Table 168: Rest of Europe Market Value Share Analysis by End Use Application, 2021
Table 169: Rest of Europe Market Value Share Analysis by Grade, 2021
Table 170: South Asia Policosanol Market Value (US$ Mn), Volume (MT) Forecast and Analysis, 2021-2031
Table 171: India Policosanol Market Incremental $ Opportunity, 2021-2031
Table 172: Thailand Policosanol Market Incremental $ Opportunity, 2021-2031
Table 173: Indonesia Policosanol Market Incremental $ Opportunity, 2021-2031
Table 174: Malaysia Policosanol Market Incremental $ Opportunity, 2021-2031
Table 175: Rest of South Asia Policosanol Market Incremental $ Opportunity, 2021-2031
Table 176: South Asia Policosanol Market Share and BPS Analysis by Source – 2021 & 2031
Table 177: South Asia Policosanol Market Attractiveness Analysis by Source, 2021-2031
Table 178: South Asia Policosanol Market Share and BPS Analysis by Grade– 2021 & 2031
Table 179: South Asia Policosanol Market Attractiveness Analysis by Grade, 2021-2031
Table 180: South Asia Policosanol Market Share and BPS Analysis by Extraction Process– 2021 & 2031
Table 181: South Asia Policosanol Market Attractiveness Analysis by Extraction Process, 2021-2031
Table 182: South Asia Policosanol Market Share and BPS Analysis by End Use Application– 2021 & 2031
Table 183: South Asia Policosanol Market Attractiveness Analysis by End Use Application, 2021-2031
Table 184: India Market Value Share Analysis by Source, 2021
Table 185: India Market Value Share Analysis by Extraction Process, 2021
Table 186: India Market Value Share Analysis by End Use Application, 2021
Table 187: India Market Value Share Analysis by Grade, 2021
Table 188: Thailand Market Value Share Analysis by Source, 2021
Table 189: Thailand Market Value Share Analysis by Extraction Process, 2021
Table 190: Thailand Market Value Share Analysis by End Use Application, 2021
Table 191: Thailand Market Value Share Analysis by Grade, 2021
Table 192: Indonesia Market Value Share Analysis by Source, 2021
Table 193: Indonesia Market Value Share Analysis by Extraction Process, 2021
Table 194: Indonesia Market Value Share Analysis by End Use Application, 2021
Table 195: Indonesia Market Value Share Analysis by Grade, 2021
Table 196: Malaysia Market Value Share Analysis by Source, 2021
Table 197: Malaysia Market Value Share Analysis by Extraction Process, 2021
Table 198: Malaysia Market Value Share Analysis by End Use Application, 2021
Table 199: Malaysia Market Value Share Analysis by Grade, 2021
Table 200: Rest of South Asia Market Value Share Analysis by Source, 2021
Table 201: Rest of South Asia Market Value Share Analysis by Extraction Process, 2021
Table 202: Rest of South Asia Market Value Share Analysis by End Use Application, 2021
Table 203: Rest of South Asia Market Value Share Analysis by Grade, 2021
Table 204: East Asia Policosanol Market Value (US$ Mn), Volume (MT) Forecast and Analysis, 2021-2031
Table 205: China Policosanol Market Incremental $ Opportunity, 2021-2031
Table 206: Japan Policosanol Market Incremental $ Opportunity, 2021-2031
Table 207: South Korea Policosanol Market Incremental $ Opportunity, 2021-2031
Table 208: East Asia Policosanol Market Share and BPS Analysis by Source – 2021 & 2031
Table 209: East Asia Policosanol Market Attractiveness Analysis by Source, 2021-2031
Table 210: East Asia Policosanol Market Share and BPS Analysis by Grade– 2021 & 2031
Table 211: East Asia Policosanol Market Attractiveness Analysis by Grade, 2021-2031
Table 212: East Asia Policosanol Market Share and BPS Analysis by Extraction Process– 2021 & 2031
Table 213: East Asia Policosanol Market Attractiveness Analysis by Extraction Process, 2021-2031
Table 214: East Asia Policosanol Market Share and BPS Analysis by End Use Application– 2021 & 2031
Table 215: East Asia Policosanol Market Attractiveness Analysis by End Use Application, 2021-2031
Table 216: China Market Value Share Analysis by Source, 2021
Table 217: China Market Value Share Analysis by Extraction Process, 2021
Table 218: China Market Value Share Analysis by End Use Application, 2021
Table 219: China Market Value Share Analysis by Grade, 2021
Table 220: Japan Market Value Share Analysis by Source, 2021
Table 221: Japan Market Value Share Analysis by Extraction Process, 2021
Table 222: Japan Market Value Share Analysis by End Use Application, 2021
Table 223: Japan Market Value Share Analysis by Grade, 2021
Table 224: South Korea Market Value Share Analysis by Source, 2021
Table 225: South Korea Market Value Share Analysis by Extraction Process, 2021
Table 226: South Korea Market Value Share Analysis by End Use Application, 2021
Table 227: South Korea Market Value Share Analysis by Grade, 2021
Table 228: Oceania Policosanol Market Value (US$ Mn), Volume (MT) Forecast and Analysis, 2021-2031
Table 229: Australia Policosanol Market Incremental $ Opportunity, 2021-2031
Table 230: New Zealand Policosanol Market Incremental $ Opportunity, 2021-2031
Table 231: Oceania Policosanol Market Share and BPS Analysis by Source – 2021 & 2031
Table 232: Oceania Policosanol Market Attractiveness Analysis by Source, 2021-2031
Table 233: Oceania Policosanol Market Share and BPS Analysis by Grade– 2021 & 2031
Table 234: Oceania Policosanol Market Attractiveness Analysis by Grade, 2021-2031
Table 235: Oceania Policosanol Market Share and BPS Analysis by Extraction Process– 2021 & 2031
Table 236: Oceania Policosanol Market Attractiveness Analysis by Extraction Process, 2021-2031
Table 237: Oceania Policosanol Market Share and BPS Analysis by End Use Application– 2021 & 2031
Table 238: Oceania Policosanol Market Attractiveness Analysis by End Use Application, 2021-2031
Table 239: Australia Market Value Share Analysis by Source, 2021
Table 240: Australia Market Value Share Analysis by Extraction Process, 2021
Table 241: Australia Market Value Share Analysis by End Use Application, 2021
Table 242: Australia Market Value Share Analysis by Grade, 2021
Table 243: New Zealand Market Value Share Analysis by Source, 2021
Table 244: New Zealand Market Value Share Analysis by Extraction Process, 2021
Table 245: New Zealand Market Value Share Analysis by End Use Application, 2021
Table 246: New Zealand Market Value Share Analysis by Grade, 2021
Table 247: Middle East & Africa Policosanol Market Value (US$ Mn), Volume (MT) Forecast and Analysis, 2021-2031
Table 248: GCC Countries Policosanol Market Incremental $ Opportunity, 2021-2031
Table 249: North Africa Policosanol Market Incremental $ Opportunity, 2021-2031
Table 250: South Africa Policosanol Market Incremental $ Opportunity, 2021-2031
Table 251: Rest of Middle East & Africa Policosanol Market Incremental $ Opportunity, 2021-2031
Table 252: Middle East & Africa Policosanol Market Share and BPS Analysis by Source – 2021 & 2031
Table 253: Middle East & Africa Policosanol Market Attractiveness Analysis by Source, 2021-2031
Table 254: Middle East & Africa Policosanol Market Share and BPS Analysis by Grade– 2021 & 2031
Table 255: Middle East & Africa Policosanol Market Attractiveness Analysis by Grade, 2021-2031
Table 256: Middle East & Africa Policosanol Market Share and BPS Analysis by Extraction Process– 2021 & 2031
Table 257: Middle East & Africa Policosanol Market Attractiveness Analysis by Extraction Process, 2021-2031
Table 258: Middle East & Africa Policosanol Market Share and BPS Analysis by End Use Application– 2021 & 2031
Table 259: Middle East & Africa Policosanol Market Attractiveness Analysis by End Use Application, 2021-2031
Table 260: GCC Countries Market Value Share Analysis by Source, 2021
Table 261: GCC Countries Market Value Share Analysis by Extraction Process, 2021
Table 262: GCC Countries Market Value Share Analysis by End Use Application, 2021
Table 263: GCC Countries Market Value Share Analysis by Grade, 2021
Table 264: North Africa Market Value Share Analysis by Source, 2021
Table 265: North Africa Market Value Share Analysis by Extraction Process, 2021
Table 266: North Africa Market Value Share Analysis by End Use Application, 2021
Table 267: North Africa Market Value Share Analysis by Grade, 2021
Table 268: South Africa Market Value Share Analysis by Source, 2021
Table 269: South Africa Market Value Share Analysis by Extraction Process, 2021
Table 270: South Africa Market Value Share Analysis by End Use Application, 2021
Table 271: South Africa Market Value Share Analysis by Grade, 2021
Table 272: Rest of Middle East & Africa Market Value Share Analysis by Source, 2021
Table 273: Rest of Middle East & Africa Market Value Share Analysis by Extraction Process, 2021
Table 274: Rest of Middle East & Africa Market Value Share Analysis by End Use Application, 2021
Table 275: Rest of Middle East & Africa Market Value Share Analysis by Grade, 2021
Table 276: China Policosanol Market Y-o-Y Growth Analysis, 2021 to 2031
Table 277: China Policosanol Market Incremental Value (US$ Mn), 2021 to 2031
Table 278: China Policosanol Market Value and Volume Analysis, 2016 -2031
Table 279: China Policosanol Market Incremental Volume (Metric Tons), 2021 to 2031
Table 280: India Policosanol Market Y-o-Y Growth Analysis, 2021 to 2031
Table 281: India Policosanol Market Incremental Value (US$ Mn), 2021 to 2031
Table 282: India Policosanol Market Value and Volume Analysis, 2016 -2031
Table 283: India Policosanol Market Incremental Volume (Metric Tons), 2021 to 2031
Find your sweet spots for generating winning opportunities in this market.
Talk to AnalystList of Charts
Figure 01: Global Policosanol Market Size, Market Volume (MT), 2016-2031
Figure 02: Global Policosanol Market Size, Incremental $ Opportunity (US$ Mn) , 2016-2031
Figure 03: Global Policosanol Market Share and BPS Analysis by Source – 2021 & 2031
Figure 04: Global Policosanol Market Attractiveness Analysis by Source, 2021-2031
Figure 05: Global Policosanol Market Sugarcane Wax Source Market Value (US$ Mn), Volume (MT) and Forecast, 2016-2031
Figure 06: Global Policosanol Market Sugarcane Wax Source Incremental $ Opportunity, 2020-2031
Figure 07: Global Policosanol Market Bees Wax Source Market Value (US$ Mn), Volume (MT) and Forecast, 2016-2031
Figure 08: Global Policosanol Market Bees Wax Source Incremental $ Opportunity, 2020-2031
Figure 09: Global Policosanol Market Rice Bran Wax Source Market Value (US$ Mn), Volume (MT) and Forecast, 2016-2031
Figure 10: Global Policosanol Market Rice Bran Wax Source Incremental $ Opportunity, 2020-2031
Figure 11: Global Policosanol Market Wheat Germ Wax Source Market Value (US$ Mn), Volume (MT) and Forecast, 2016-2031
Figure 12: Global Policosanol Market Wheat Germ Wax Source Incremental $ Opportunity, 2020-2031
Figure 13: Global Policosanol Market Others Source Market Value (US$ Mn), Volume (MT) and Forecast, 2016-2031
Figure 14: Global Policosanol Market Others Source Incremental $ Opportunity, 2020-2031
Figure 15: Global Policosanol Market Share and BPS Analysis by Grade– 2021 & 2031
Figure 16: Global Policosanol Market Attractiveness Analysis by Grade, 2021-2031
Figure 17: Global Policosanol Market 90% Grade Market Value (US$ Mn), Volume (MT) and Forecast, 2016-2031
Figure 18: Global Policosanol Market 90% Grade Incremental $ Opportunity, 2020-2031
Figure 19: Global Policosanol Market 95% Grade Market Value (US$ Mn), Volume (MT) and Forecast, 2016-2031
Figure 20: Global Policosanol Market 95% Grade Incremental $ Opportunity, 2020-2031
Figure 21: Global Policosanol Market 99% Grade Market Value (US$ Mn), Volume (MT) and Forecast, 2016-2031
Figure 22: Global Policosanol Market 99% Grade Incremental $ Opportunity, 2020-2031
Figure 23: Global Policosanol Market Share and BPS Analysis by Extraction Process– 2021 & 2031
Figure 24: Global Policosanol Market Attractiveness Analysis by Extraction Process, 2021-2031
Figure 25: Global Policosanol Market Solvent Extraction Market Value (US$ Mn), Volume (MT) and Forecast, 2016-2031
Figure 26: Global Policosanol Market Solvent Extraction Incremental $ Opportunity, 2020-2031
Figure 27: Global Policosanol Market Supercritical CO2 Extraction Market Value (US$ Mn), Volume (MT) and Forecast, 2016-2031
Figure 28: Global Policosanol Market Supercritical CO2 Extraction Incremental $ Opportunity, 2020-2031
Figure 29: Global Policosanol Market Share and BPS Analysis by End Use Application– 2021 & 2031
Figure 30: Global Policosanol Market Attractiveness Analysis by End Use Application, 2021-2031
Figure 31: Global Policosanol Market Food Processing Market Value (US$ Mn), Volume (MT) and Forecast, 2016-2031
Figure 32: Global Policosanol Market Food Processing Incremental $ Opportunity, 2020-2031
Figure 33: Global Policosanol Market Personal Care & Cosmetics Market Value (US$ Mn), Volume (MT) and Forecast, 2016-2031
Figure 34: Global Policosanol Market Personal Care & Cosmetics Incremental $ Opportunity, 2020-2031
Figure 35: Global Policosanol Market Dietary Supplements Market Value (US$ Mn), Volume (MT) and Forecast, 2016-2031
Figure 36: Global Policosanol Market Dietary Supplements Incremental $ Opportunity, 2020-2031
Figure 37: Global Policosanol Market Nutraceuticals Market Value (US$ Mn), Volume (MT) and Forecast, 2016-2031
Figure 38: Global Policosanol Market Nutraceuticals Incremental $ Opportunity, 2020-2031
Figure 39: Global Policosanol Market Animal Feed Market Value (US$ Mn), Volume (MT) and Forecast, 2016-2031
Figure 40: Global Policosanol Market Animal Feed Incremental $ Opportunity, 2020-2031
Figure 41: Global Policosanol Market Pet Food Market Value (US$ Mn), Volume (MT) and Forecast, 2016-2031
Figure 42: Global Policosanol Market Pet Food Incremental $ Opportunity, 2020-2031
Figure 43: Global Policosanol Market Value Share (%) and BPS Analysis by Region, 2016, 2021 & 2031
Figure 44: Global Policosanol Market Y-o-Y Growth (%) Projections by Segment, 2021-2031
Figure 45: North America Policosanol Absolute $ Opportunity Analysis, 2021-2031
Figure 46: Latin America Policosanol Absolute $ Opportunity Analysis, 2021-2031
Figure 47: Europe Policosanol Absolute $ Opportunity Analysis, 2021-2031
Figure 48: South Asia Policosanol Absolute $ Opportunity Analysis, 2021-2031
Figure 49: East Asia Policosanol Absolute $ Opportunity Analysis, 2021-2031
Figure 50: Oceania Policosanol Absolute $ Opportunity Analysis, 2021-2031
Figure 51: Middle East & Africa Policosanol Absolute $ Opportunity Analysis, 2021-2031
Figure 52: Global Policosanol Market Attractiveness Analysis, 2021-2031
Figure 53: North America Policosanol Market Value (US$ Mn), Volume (MT) Forecast and Analysis, 2021-2031
Figure 54: U.S. Policosanol Market Incremental $ Opportunity, 2021-2031
Figure 55: Canada Policosanol Market Incremental $ Opportunity, 2021-2031
Figure 56: North America Policosanol Market Share and BPS Analysis by Source – 2021 & 2031
Figure 57: North America Policosanol Market Attractiveness Analysis by Source, 2021-2031
Figure 58: North America Policosanol Market Share and BPS Analysis by Grade– 2021 & 2031
Figure 59: North America Policosanol Market Attractiveness Analysis by Grade, 2021-2031
Figure 60: North America Policosanol Market Share and BPS Analysis by Extraction Process– 2021 & 2031
Figure 61: North America Policosanol Market Attractiveness Analysis by Extraction Process, 2021-2031
Figure 62: North America Policosanol Market Share and BPS Analysis by End Use Application– 2021 & 2031
Figure 63: North America Policosanol Market Attractiveness Analysis by End Use Application, 2021-2031
Figure 64: U.S. Market Value Share Analysis by Source, 2021
Figure 65: U.S. Market Value Share Analysis by Extraction Process, 2021
Figure 66: U.S. Market Value Share Analysis by End Use Application, 2021
Figure 67: U.S. Market Value Share Analysis by Grade, 2021
Figure 68: Canada Market Value Share Analysis by Source, 2021
Figure 69: Canada Market Value Share Analysis by Extraction Process, 2021
Figure 70: Canada Market Value Share Analysis by End Use Application, 2021
Figure 71: Canada Market Value Share Analysis by Grade, 2021
Figure 72: Latin America Policosanol Market Value (US$ Mn), Volume (MT) Forecast and Analysis, 2021-2031
Figure 73: Brazil Policosanol Market Incremental $ Opportunity, 2021-2031
Figure 74: Mexico Policosanol Market Incremental $ Opportunity, 2021-2031
Figure 75: Chile Policosanol Market Incremental $ Opportunity, 2021-2031
Figure 76: Peru Policosanol Market Incremental $ Opportunity, 2021-2031
Figure 77: Argentina Policosanol Market Incremental $ Opportunity, 2021-2031
Figure 78: Rest of Latin America Policosanol Market Incremental $ Opportunity, 2021-2031
Figure 79: Latin America Policosanol Market Share and BPS Analysis by Source – 2021 & 2031
Figure 80: Latin America Policosanol Market Attractiveness Analysis by Source, 2021-2031
Figure 81: Latin America Policosanol Market Share and BPS Analysis by Grade– 2021 & 2031
Figure 82: Latin America Policosanol Market Attractiveness Analysis by Grade, 2021-2031
Figure 83: Latin America Policosanol Market Share and BPS Analysis by Extraction Process– 2021 & 2031
Figure 84: Latin America Policosanol Market Attractiveness Analysis by Extraction Process, 2021-2031
Figure 85: Latin America Policosanol Market Share and BPS Analysis by End Use Application– 2021 & 2031
Figure 86: Latin America Policosanol Market Attractiveness Analysis by End Use Application, 2021-2031
Figure 87: Brazil Market Value Share Analysis by Source, 2021
Figure 88: Brazil Market Value Share Analysis by Extraction Process, 2021
Figure 89: Brazil Market Value Share Analysis by End Use Application, 2021
Figure 90: Brazil Market Value Share Analysis by Grade, 2021
Figure 91: Mexico Market Value Share Analysis by Source, 2021
Figure 92: Mexico Market Value Share Analysis by Extraction Process, 2021
Figure 93: Mexico Market Value Share Analysis by End Use Application, 2021
Figure 94: Mexico Market Value Share Analysis by Grade, 2021
Figure 95: Chile Market Value Share Analysis by Source, 2021
Figure 96: Chile Market Value Share Analysis by Extraction Process, 2021
Figure 97: Chile Market Value Share Analysis by End Use Application, 2021
Figure 98: Chile Market Value Share Analysis by Grade, 2021
Figure 99: Peru Market Value Share Analysis by Source, 2021
Figure 100: Peru Market Value Share Analysis by Extraction Process, 2021
Figure 101: Peru Market Value Share Analysis by End Use Application, 2021
Figure 102: Peru Market Value Share Analysis by Grade, 2021
Figure 103: Argentina Market Value Share Analysis by Source, 2021
Figure 104: Argentina Market Value Share Analysis by Extraction Process, 2021
Figure 105: Argentina Market Value Share Analysis by End Use Application, 2021
Figure 106: Argentina Market Value Share Analysis by Grade, 2021
Figure 107: Rest of Latin America Market Value Share Analysis by Source, 2021
Figure 108: Rest of Latin America Market Value Share Analysis by Extraction Process, 2021
Figure 109: Rest of Latin America Market Value Share Analysis by End Use Application, 2021
Figure 110: Rest of Latin America Market Value Share Analysis by Grade, 2021
Figure 111: Europe Policosanol Market Value (US$ Mn), Volume (MT) Forecast and Analysis, 2021-2031
Figure 112: Germany Policosanol Market Incremental $ Opportunity, 2021-2031
Figure 113: Italy Policosanol Market Incremental $ Opportunity, 2021-2031
Figure 114: France Policosanol Market Incremental $ Opportunity, 2021-2031
Figure 115: U.K. Policosanol Market Incremental $ Opportunity, 2021-2031
Figure 116: Spain Policosanol Market Incremental $ Opportunity, 2021-2031
Figure 117: BENELUX Policosanol Market Incremental $ Opportunity, 2021-2031
Figure 118: Nordic Policosanol Market Incremental $ Opportunity, 2021-2031
Figure 119: Russia Policosanol Market Incremental $ Opportunity, 2021-2031
Figure 120: Poland Policosanol Market Incremental $ Opportunity, 2021-2031
Figure 121: Rest of Europe Policosanol Market Incremental $ Opportunity, 2021-2031
Figure 122: Europe Policosanol Market Share and BPS Analysis by Source – 2021 & 2031
Figure 123: Europe Policosanol Market Attractiveness Analysis by Source, 2021-2031
Figure 124: Europe Policosanol Market Share and BPS Analysis by Grade– 2021 & 2031
Figure 125: Europe Policosanol Market Attractiveness Analysis by Grade, 2021-2031
Figure 126: Europe Policosanol Market Share and BPS Analysis by Extraction Process– 2021 & 2031
Figure 127: Europe Policosanol Market Attractiveness Analysis by Extraction Process, 2021-2031
Figure 128: Europe Policosanol Market Share and BPS Analysis by End Use Application– 2021 & 2031
Figure 129: Europe Policosanol Market Attractiveness Analysis by End Use Application, 2021-2031
Figure 130: Germany Market Value Share Analysis by Source, 2021
Figure 131: Germany Market Value Share Analysis by Extraction Process, 2021
Figure 132: Germany Market Value Share Analysis by End Use Application, 2021
Figure 133: Germany Market Value Share Analysis by Grade, 2021
Figure 134: Italy Market Value Share Analysis by Source, 2021
Figure 135: Italy Market Value Share Analysis by Extraction Process, 2021
Figure 136: Italy Market Value Share Analysis by End Use Application, 2021
Figure 137: Italy Market Value Share Analysis by Grade, 2021
Figure 138: France Market Value Share Analysis by Source, 2021
Figure 139: France Market Value Share Analysis by Extraction Process, 2021
Figure 140: France Market Value Share Analysis by End Use Application, 2021
Figure 141: France Market Value Share Analysis by Grade, 2021
Figure 142: U.K. Market Value Share Analysis by Source, 2021
Figure 143: U.K. Market Value Share Analysis by Extraction Process, 2021
Figure 144: U.K. Market Value Share Analysis by End Use Application, 2021
Figure 145: U.K. Market Value Share Analysis by Grade, 2021
Figure 146: Spain Market Value Share Analysis by Source, 2021
Figure 147: Spain Market Value Share Analysis by Extraction Process, 2021
Figure 148: Spain Market Value Share Analysis by End Use Application, 2021
Figure 149: Spain Market Value Share Analysis by Grade, 2021
Figure 150: BENELUX Market Value Share Analysis by Source, 2021
Figure 151: BENELUX Market Value Share Analysis by Extraction Process, 2021
Figure 152: BENELUX Market Value Share Analysis by End Use Application, 2021
Figure 153: BENELUX Market Value Share Analysis by Grade, 2021
Figure 154: Nordic Market Value Share Analysis by Source, 2021
Figure 155: Nordic Market Value Share Analysis by Extraction Process, 2021
Figure 156: Nordic Market Value Share Analysis by End Use Application, 2021
Figure 157: Nordic Market Value Share Analysis by Grade, 2021
Figure 158: Russia Market Value Share Analysis by Source, 2021
Figure 159: Russia Market Value Share Analysis by Extraction Process, 2021
Figure 160: Russia Market Value Share Analysis by End Use Application, 2021
Figure 161: Russia Market Value Share Analysis by Grade, 2021
Figure 162: Poland Market Value Share Analysis by Source, 2021
Figure 163: Poland Market Value Share Analysis by Extraction Process, 2021
Figure 164: Poland Market Value Share Analysis by End Use Application, 2021
Figure 165: Poland Market Value Share Analysis by Grade, 2021
Figure 166: Rest of Europe Market Value Share Analysis by Source, 2021
Figure 167: Rest of Europe Market Value Share Analysis by Extraction Process, 2021
Figure 168: Rest of Europe Market Value Share Analysis by End Use Application, 2021
Figure 169: Rest of Europe Market Value Share Analysis by Grade, 2021
Figure 170: South Asia Policosanol Market Value (US$ Mn), Volume (MT) Forecast and Analysis, 2021-2031
Figure 171: India Policosanol Market Incremental $ Opportunity, 2021-2031
Figure 172: Thailand Policosanol Market Incremental $ Opportunity, 2021-2031
Figure 173: Indonesia Policosanol Market Incremental $ Opportunity, 2021-2031
Figure 174: Malaysia Policosanol Market Incremental $ Opportunity, 2021-2031
Figure 175: Rest of South Asia Policosanol Market Incremental $ Opportunity, 2021-2031
Figure 176: South Asia Policosanol Market Share and BPS Analysis by Source – 2021 & 2031
Figure 177: South Asia Policosanol Market Attractiveness Analysis by Source, 2021-2031
Figure 178: South Asia Policosanol Market Share and BPS Analysis by Grade– 2021 & 2031
Figure 179: South Asia Policosanol Market Attractiveness Analysis by Grade, 2021-2031
Figure 180: South Asia Policosanol Market Share and BPS Analysis by Extraction Process– 2021 & 2031
Figure 181: South Asia Policosanol Market Attractiveness Analysis by Extraction Process, 2021-2031
Figure 182: South Asia Policosanol Market Share and BPS Analysis by End Use Application– 2021 & 2031
Figure 183: South Asia Policosanol Market Attractiveness Analysis by End Use Application, 2021-2031
Figure 184: India Market Value Share Analysis by Source, 2021
Figure 185: India Market Value Share Analysis by Extraction Process, 2021
Figure 186: India Market Value Share Analysis by End Use Application, 2021
Figure 187: India Market Value Share Analysis by Grade, 2021
Figure 188: Thailand Market Value Share Analysis by Source, 2021
Figure 189: Thailand Market Value Share Analysis by Extraction Process, 2021
Figure 190: Thailand Market Value Share Analysis by End Use Application, 2021
Figure 191: Thailand Market Value Share Analysis by Grade, 2021
Figure 192: Indonesia Market Value Share Analysis by Source, 2021
Figure 193: Indonesia Market Value Share Analysis by Extraction Process, 2021
Figure 194: Indonesia Market Value Share Analysis by End Use Application, 2021
Figure 195: Indonesia Market Value Share Analysis by Grade, 2021
Figure 196: Malaysia Market Value Share Analysis by Source, 2021
Figure 197: Malaysia Market Value Share Analysis by Extraction Process, 2021
Figure 198: Malaysia Market Value Share Analysis by End Use Application, 2021
Figure 199: Malaysia Market Value Share Analysis by Grade, 2021
Figure 200: Rest of South Asia Market Value Share Analysis by Source, 2021
Figure 201: Rest of South Asia Market Value Share Analysis by Extraction Process, 2021
Figure 202: Rest of South Asia Market Value Share Analysis by End Use Application, 2021
Figure 203: Rest of South Asia Market Value Share Analysis by Grade, 2021
Figure 204: East Asia Policosanol Market Value (US$ Mn), Volume (MT) Forecast and Analysis, 2021-2031
Figure 205: China Policosanol Market Incremental $ Opportunity, 2021-2031
Figure 206: Japan Policosanol Market Incremental $ Opportunity, 2021-2031
Figure 207: South Korea Policosanol Market Incremental $ Opportunity, 2021-2031
Figure 208: East Asia Policosanol Market Share and BPS Analysis by Source – 2021 & 2031
Figure 209: East Asia Policosanol Market Attractiveness Analysis by Source, 2021-2031
Figure 210: East Asia Policosanol Market Share and BPS Analysis by Grade– 2021 & 2031
Figure 211: East Asia Policosanol Market Attractiveness Analysis by Grade, 2021-2031
Figure 212: East Asia Policosanol Market Share and BPS Analysis by Extraction Process– 2021 & 2031
Figure 213: East Asia Policosanol Market Attractiveness Analysis by Extraction Process, 2021-2031
Figure 214: East Asia Policosanol Market Share and BPS Analysis by End Use Application– 2021 & 2031
Figure 215: East Asia Policosanol Market Attractiveness Analysis by End Use Application, 2021-2031
Figure 216: China Market Value Share Analysis by Source, 2021
Figure 217: China Market Value Share Analysis by Extraction Process, 2021
Figure 218: China Market Value Share Analysis by End Use Application, 2021
Figure 219: China Market Value Share Analysis by Grade, 2021
Figure 220: Japan Market Value Share Analysis by Source, 2021
Figure 221: Japan Market Value Share Analysis by Extraction Process, 2021
Figure 222: Japan Market Value Share Analysis by End Use Application, 2021
Figure 223: Japan Market Value Share Analysis by Grade, 2021
Figure 224: South Korea Market Value Share Analysis by Source, 2021
Figure 225: South Korea Market Value Share Analysis by Extraction Process, 2021
Figure 226: South Korea Market Value Share Analysis by End Use Application, 2021
Figure 227: South Korea Market Value Share Analysis by Grade, 2021
Figure 228: Oceania Policosanol Market Value (US$ Mn), Volume (MT) Forecast and Analysis, 2021-2031
Figure 229: Australia Policosanol Market Incremental $ Opportunity, 2021-2031
Figure 230: New Zealand Policosanol Market Incremental $ Opportunity, 2021-2031
Figure 231: Oceania Policosanol Market Share and BPS Analysis by Source – 2021 & 2031
Figure 232: Oceania Policosanol Market Attractiveness Analysis by Source, 2021-2031
Figure 233: Oceania Policosanol Market Share and BPS Analysis by Grade– 2021 & 2031
Figure 234: Oceania Policosanol Market Attractiveness Analysis by Grade, 2021-2031
Figure 235: Oceania Policosanol Market Share and BPS Analysis by Extraction Process– 2021 & 2031
Figure 236: Oceania Policosanol Market Attractiveness Analysis by Extraction Process, 2021-2031
Figure 237: Oceania Policosanol Market Share and BPS Analysis by End Use Application– 2021 & 2031
Figure 238: Oceania Policosanol Market Attractiveness Analysis by End Use Application, 2021-2031
Figure 239: Australia Market Value Share Analysis by Source, 2021
Figure 240: Australia Market Value Share Analysis by Extraction Process, 2021
Figure 241: Australia Market Value Share Analysis by End Use Application, 2021
Figure 242: Australia Market Value Share Analysis by Grade, 2021
Figure 243: New Zealand Market Value Share Analysis by Source, 2021
Figure 244: New Zealand Market Value Share Analysis by Extraction Process, 2021
Figure 245: New Zealand Market Value Share Analysis by End Use Application, 2021
Figure 246: New Zealand Market Value Share Analysis by Grade, 2021
Figure 247: Middle East & Africa Policosanol Market Value (US$ Mn), Volume (MT) Forecast and Analysis, 2021-2031
Figure 248: GCC Countries Policosanol Market Incremental $ Opportunity, 2021-2031
Figure 249: North Africa Policosanol Market Incremental $ Opportunity, 2021-2031
Figure 250: South Africa Policosanol Market Incremental $ Opportunity, 2021-2031
Figure 251: Rest of Middle East & Africa Policosanol Market Incremental $ Opportunity, 2021-2031
Figure 252: Middle East & Africa Policosanol Market Share and BPS Analysis by Source – 2021 & 2031
Figure 253: Middle East & Africa Policosanol Market Attractiveness Analysis by Source, 2021-2031
Figure 254: Middle East & Africa Policosanol Market Share and BPS Analysis by Grade– 2021 & 2031
Figure 255: Middle East & Africa Policosanol Market Attractiveness Analysis by Grade, 2021-2031
Figure 256: Middle East & Africa Policosanol Market Share and BPS Analysis by Extraction Process– 2021 & 2031
Figure 257: Middle East & Africa Policosanol Market Attractiveness Analysis by Extraction Process, 2021-2031
Figure 258: Middle East & Africa Policosanol Market Share and BPS Analysis by End Use Application– 2021 & 2031
Figure 259: Middle East & Africa Policosanol Market Attractiveness Analysis by End Use Application, 2021-2031
Figure 260: GCC Countries Market Value Share Analysis by Source, 2021
Figure 261: GCC Countries Market Value Share Analysis by Extraction Process, 2021
Figure 262: GCC Countries Market Value Share Analysis by End Use Application, 2021
Figure 263: GCC Countries Market Value Share Analysis by Grade, 2021
Figure 264: North Africa Market Value Share Analysis by Source, 2021
Figure 265: North Africa Market Value Share Analysis by Extraction Process, 2021
Figure 266: North Africa Market Value Share Analysis by End Use Application, 2021
Figure 267: North Africa Market Value Share Analysis by Grade, 2021
Figure 268: South Africa Market Value Share Analysis by Source, 2021
Figure 269: South Africa Market Value Share Analysis by Extraction Process, 2021
Figure 270: South Africa Market Value Share Analysis by End Use Application, 2021
Figure 271: South Africa Market Value Share Analysis by Grade, 2021
Figure 272: Rest of Middle East & Africa Market Value Share Analysis by Source, 2021
Figure 273: Rest of Middle East & Africa Market Value Share Analysis by Extraction Process, 2021
Figure 274: Rest of Middle East & Africa Market Value Share Analysis by End Use Application, 2021
Figure 275: Rest of Middle East & Africa Market Value Share Analysis by Grade, 2021
Figure 276: China Policosanol Market Y-o-Y Growth Analysis, 2021 to 2031
Figure 277: China Policosanol Market Incremental Value (US$ Mn), 2021 to 2031
Figure 278: China Policosanol Market Value and Volume Analysis, 2016 -2031
Figure 279: China Policosanol Market Incremental Volume (Metric Tons), 2021 to 2031
Figure 280: India Policosanol Market Y-o-Y Growth Analysis, 2021 to 2031
Figure 281: India Policosanol Market Incremental Value (US$ Mn), 2021 to 2031
Figure 282: India Policosanol Market Value and Volume Analysis, 2016 -2031
Figure 283: India Policosanol Market Incremental Volume (Metric Tons), 2021 to 2031
Need specific information?
Request CustomizationExplore Food and Beverage Insights
View Reports