Polydimethylsiloxane Market
Versatility and Non-Reactivity top factors enhancing uptake of Polydimethylsiloxane across major End-Use Industries
Polydimethylsiloxane Market by Type, Application & Region | Forecast 2022 to 2032.
Polydimethylsiloxane Market Outlook (2022 to 2032)
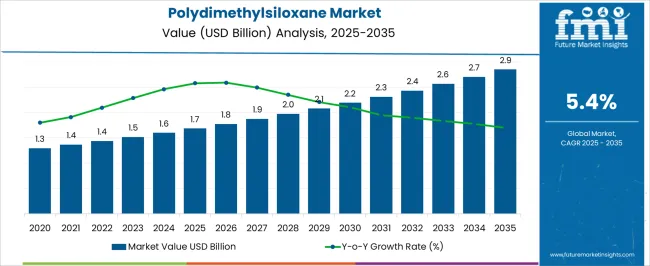
The global polydimethylsiloxane market is expected to secure US$ 2,644.7 Million in 2032 while expanding at a CAGR of 5.6%. The market is likely to hold a value of US$ 1,533.7 Million in 2022. Modern medical advances drive the demand for sophisticated polydimethylsiloxane systems. The demand for cosmetic and personal care products is also driving growth in the polydimethylsiloxane market. To meet the exploding demand for self-healing composites from end-use industries, polydimethylsiloxane producers have expanded production facilities and further develop new products in the market.
Polydimethylsiloxane (PDMS) is a silicon-based organic polymer that is inert, nonflammable, and nontoxic. The compound is generally known as dimethicone.Polydimethylsiloxane is an optically clear and viscous substance. In addition to its water repellency, anti-foaming, low vapor pressure, low surface tension, oxidation resistance, heat, heat stability, resistance, good dielectric properties, and others make PDMS an excellent material for a variety of industrial uses.
Polydimethylsiloxane has a diverse set of properties that make it useful in a variety of applications, including surfactants, cosmetics, medicines, anti-foaming agents, hydraulic fluids, coatings, and household products. Due to its versatility, the material has gained popularity in constructing devices that can be used to study the behavior of neural stem cells. In addition to having a low-cost and simple fabrication process, PDMS microchannels are among the most widely prototyped polymeric devices. These devices are much more affordable than the ones made of silicon and glass.
Due to its numerous advantages over other fabrication materials, polydimethylsiloxane (PDMS) silicone elastomers have received much attention for the development of substrate platforms in mechanobiology and microfluidic applications. As an elastomer with tunable properties, PDMS has many distinct characteristics that make it attractive for a wider range of applications, including its low cost, permeability to gases, transparency, low autofluorescence, and high moldability.
Data Points |
Key Statistics |
Expected Base Year Value (2022) |
US$ 1,533.7 Million |
Anticipated Forecast Value (2032) |
US$ 2,644.7 Million |
Estimated Growth (2022 to 2032) |
5.6% CAGR |
Don't pay for what you don't need
Customize your report by selecting specific countries or regions and save 30%!
How has the Market for Polydimethylsiloxane Evolved?
Many sectors, like cosmetics and medicine, rely on the chemical and physical properties of PDMS. According to forecasts, the cosmetic industry generated US$ 265 Billion by 2017 and contributed significantly to polydimethylsiloxane demand. As developing economies grow, there will be an increase in the demand for PDMS in lubricators, hydraulic fluids, and coatings in the market.
Polydimethylsiloxane is a liquid chemical used primarily in the production of adhesives, sealants, and coatings. Additionally, it has the unique advantage of being economically and environmentally friendly, which makes it an ideal material that can be produced using polymer-based siloxane. Rapid development and investments in infrastructure have fueled the global construction industry's growth, particularly in the commercial sector. This is likely to propel the growth of the polydimethylsiloxane market since industry-specific adhesives and sealants are in high demand.
PDMS has been proven to be an extremely versatile material used in a variety of biomedical and medical applications including pediatrics, orthopedics, sensors, implants, catheters, punctual plugs, valves, electromechanical devices, and surgical instruments. Furthermore, it is permeable to gaseous elements and compounds, including nitrogen, oxygen, hydrogen, and carbon dioxide, while providing a barrier to liquids, such as water, blood, and urine. Consequently, polydimethylsiloxane market revenues are expected to grow significantly during the current year.
Restrictive factors for the Polydimethylsiloxane Market
There are many advantages regarding the bulk properties of PDMS, but there are also challenges with regard to its surface properties, especially when interacting with liquids and proteins. When used for long-term research, PDMS can present several challenges. Many studies have identified PDMS' high surface hydrophobicity as the primary factor responsible for poor cell adhesion, resulting in the dissolution of aggregated cells. To facilitate long-term cell studies, PDMS' surface biocompatibility must be improved.
A proper disposal technique may result in an increase in the cost composition due to the fact that PDMS is not a biodegradable material. Some researchers have raised concerns about the possible dangers of polydimethylsiloxane when absorbed into the skin, even though it is generally considered safe when applied to surfaces. Therefore, it might have an impact on consumer perception if not clarified or investigated further.
Find your sweet spots for generating winning opportunities in this market.
Talk to AnalystCountry-wise Insights
How does North America lead the Market in Polydimethylsiloxane Sales?
Polydimethylsiloxane is expected to continue to be in high demand in North America. The region is projected to hold approximately 26.5% of the global market share by 2022. Market dominance is likely to be facilitated by the presence of key players in the region and the growing demand for healthy food products.
Due to the growing demand for confectionery products in these regions, polydimethylsiloxane has experienced significant growth in the USA market. A growing economy and an increase in medical Research and Development funding have boosted the growth of polydimethylsiloxane in this region.
There are many applications of polydimethylsiloxane that are used widely in recreational products, confectionery, and edible oil industries to combat caking and foaming. All of these factors contribute to the growth of the polydimethylsiloxane market.
What is the Growth rate of European Demand for Polydimethylsiloxane?
The European region dominates the polydimethylsiloxane market and is expected to do so for many years to come. A market share of 22.7% is expected to be reached by polydimethylsiloxane in Europe in 2022. Increasing demand for cosmetics and the rising number of cosmetic manufacturers in this region are driving the market growth of polydimethylsiloxane. The European food additive number E900 represents dimethylpolysiloxane (PDMS), a form of silicone that is used in the food industry exclusively to counteract foaming. As a result of its good defoaming ability at high temperatures, this ingredient is commonly used in frying oils.
Germany has an increasing demand for PDMS in skincare and cosmetics, making polydimethylsiloxane an increasingly popular ingredient in the market. Globalization and demographic changes are forcing the country to invest in mobile healthcare facilities, which will enable the German healthcare sector to continue to expand. Precision dental instruments, diagnostic imaging, and optical technologies are among the instruments produced by Germany that have a long history of producing high-quality medical equipment. These factors have all contributed to the growth of the industry.
What makes the Asia Pacific a Lucrative Market for Polydimethylsiloxane?
The Asia-Pacific region holds a large share of the global market for polydimethylsiloxane and is expected to maintain this position in the near future. Various medical devices are currently being developed with polydimethylsiloxane as one of the components, including biological machines, platforms for 3D tissue culture, and organs-on-a-chip devices. This will further increase the market for polydimethylsiloxane.
As the economy grows, the demand for polydimethylsiloxane in China will also increase. PDMS fluid-based products are becoming increasingly popular over hydrocarbon-based products, as well as elastomers in this region which increase demand for high-molecular-weight PDMS. As a result of the expanding electronics manufacturing industry as well as the increasing sales of cosmetics and sanitary products, the market is expected to witness significant growth in the upcoming years.
Category-wise Insights
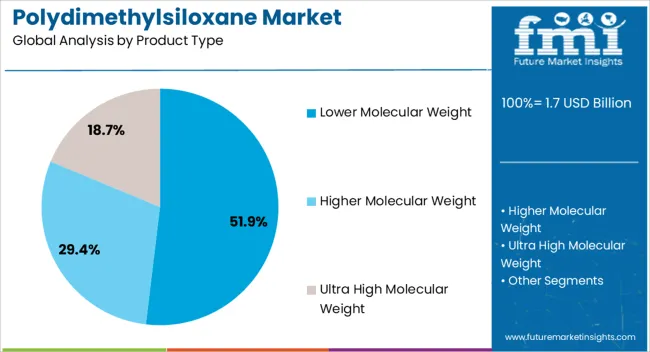
Why are Low-Molecular Weight Polydimethylsiloxane Sales Rising?
According to the analysis, polydimethylsiloxane's low-molecular weight is expected to increase the market growth. Besides being widely used in laboratories to make heat transfer fluids, bath fluids, hydraulic fluids with low viscosity, damping fluids with low viscosity, and other fluids, it is also used in many other applications in the market. Due to the growing building and construction industries and the automotive industry in developing countries, the market for PDMs should experience a steady increase in demand.
An ultra-thin polydimethylsiloxane layer with low molecular weight (LMW) is used as an agent to enhance ITO thin film conductivity, transmissibility, and anti-fogging ability. In the healthcare sector, low molecular weight PDMS is used to make breast implants, as well as for other uses, such as in hydraulic fluids, anti-foamers, and lubricating products. PDMS also finds applications in the aerospace industry.
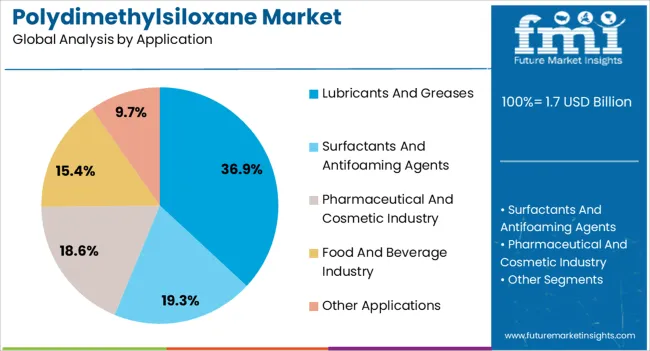
Which Application drives the global Polydimethylsiloxane Market?
Controlled drug delivery systems in the pharmaceutical industry extensively use PDMS derivatives as coatings. These materials provide the opportunity to adjust the speed and pattern of drug release, improve film formation, and enhance storage stability. With the growing demand for cosmetics and their skin-friendly nature, the use of PDMS in the market is expected to grow in the market.
In the chemical world, polydimethylsiloxane is classified as a polymeric organosilicon compound, which is commonly referred to as silicone. Aside from being freely available, it is commonly used as an over-the-counter treatment for the treatment of flatulence since there are no addictive properties. By working as an antifoaming agent, it helps to expel the gas from the body as well as aids in the release of water. Infants have been prescribed this medication to relieve the discomfort associated with swallowing air or eating certain foods that may cause discomfort.
Antiperspirants and deodorants as well as color cosmetics and shaving preparations contain this ingredient in addition to its use for skin and hair care. Because of its high coefficient of spreading and low surface energy, dimethicone can provide effective wetting and adhesion to the skin and hair of the user. All these factors have propelled the market growth of PDMS in the pharmaceutical and cosmetic industries.
Get the data you need at a Fraction of the cost
Personalize your report by choosing insights you need
and save 40%!
What Role Do Start-ups Play in the Polydimethylsiloxane Manufacturing Industry?
The increasing popularity of polydimethylsiloxane products in various applications has prompted many start-ups to introduce polydimethylsiloxane products. Startups are not only engaged in producing low molecular weight polydimethylsiloxane but they are also involved in all aspects of distribution and production. A majority of lower molecular weight polydimethylsiloxanes are used in pharmaceutical and personal care products due to the widespread application of polydimethylsiloxanes for chronic disease treatment.
- SphereVis was founded in 2014 in Philadelphia, USA. Polydimethylsiloxane (PDMS) is one of the elastomers used by SphereVis to create a cover slide consisting of arrays of high-index microspheres. This company claims to be able to provide spatial resolutions two- to three-fold greater than those of microscopes by utilizing optical super-resolution.
- Xona Microfluidics was founded in 2008 in Temecula, USA. A microfluidic platform based on polydimethylsiloxane (PDMS) is being developed by Xona Microfluidics for advancements in neurobiological research. Two chambers with microgroove barriers separate the axon from the cell body in the company's neuron device. Using 600 microliters of total volume allows less consumption of expensive reagents since the hydrostatic pressure in the chambers is different, and the difference in hydrostatic pressure in the chambers facilitates separation. As well as the ability to cut axons with the device and observe their regeneration, the device also allows vacuum aspiration of axons.
- Microsurfaces was founded in 2011, in Melbourne, Australia. Microsurfaces make microstructured surfaces for immunology, drug discovery, and screening that enable high-resolution imaging and analysis of live cells. PDMS is a biocompatible non-toxic polymer material used for microfluidics and cell culture in microcell arrays. A custom-designed microarray is also available through the company.
Competition Analysis
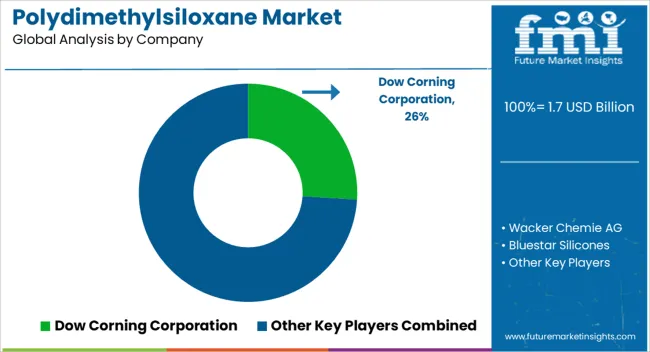
Key players in the global Polydimethylsiloxane market include Dow Corning Corporation, Wacker Chemie AG, Bluestar Silicones, Hubei Xin Sihai Chemical Co., Momentive, Shin-Etsu Chemical Co. Alfa Aesar GmbH & Co. KG, Sigma Aldrich Corp., Jinan Haohua Industry Co. Ltd., TCI Tokyo Chemical Industry Co., Fisher Scientific International Inc., Microsurfaces, Xona Microfluidics, and SphereVis.
- In October 2022, new underwater sensors will allow swimmers and divers to be tracked, their movements’ monitored, and potential drownings detected by on-shore teams. One of the first waterproof, conductive, breathable, and easy-to-wear devices has been created by a team at Fuzhou University in China. Currently, the wearables are cumbersome and uncomfortable due to thick safety insulation. This amphibious tracker was created by covering a fabric sensor with a thin coating of polydimethylsiloxane (PDMS) and testing its water-repelling properties.
Report Scope
Report Attribute |
Details |
Growth Rate |
CAGR of 5.6% from 2022 to 2032 |
Market Value in 2022 |
US$ 1,533.7 Million |
Market Value in 2032 |
US$ 2,644.7Million |
Base Year for Estimation |
2021 |
Historical Data |
2016 to 2021 |
Forecast Period |
2022 to 2032 |
Quantitative Units |
Revenue in US$ Million and CAGR from 2022 to 2032 |
Report Coverage |
Revenue Forecast, Company Ranking, Competitive Landscape, Growth Factors, Trends, and Pricing Analysis |
Segments Covered |
|
Regions Covered |
|
Key Countries Profiled |
|
Key Companies Profiled |
|
Customization |
Available Upon Request |
Key Segments Profiled in the Global Polydimethylsiloxane Market
Polydimethylsiloxane Market by Type:
- Lower Molecular Weight Polydimethylsiloxane
- Higher Molecular Weight Polydimethylsiloxane
- Ultra High Molecular Weight Polydimethylsiloxane
Polydimethylsiloxane Market by Application:
- Polydimethylsiloxane for Lubricants and Greases
- Polydimethylsiloxane for Surfactants and Antifoaming Agents
- Polydimethylsiloxane for the Pharmaceutical and Cosmetic Industry
- Polydimethylsiloxane for Food & Beverage Industry
- Polydimethylsiloxane for Other Applications
Polydimethylsiloxane Market by Region:
- North America Polydimethylsiloxane Market
- Latin America Polydimethylsiloxane Market
- Europe Polydimethylsiloxane Market
- Asia Pacific Polydimethylsiloxane Market
- Middle East & Africa Polydimethylsiloxane Market
Frequently Asked Questions
What is the anticipated growth of the polydimethylsiloxane market until 2032?
FMI projects the global polydimethylsiloxane market to expand at a 5.6% value CAGR by 2032.
Which region is forecast to be the most lucrative for polydimethylsiloxane market growth?
North America is expected to be the most opportunistic polydimethylsiloxane market, accumulating 26.5% revenue in 2022.
Which are some prominent polydimethylsiloxane manufacturers?
Dow Corning Corporation, Wacker Chemie AG, Bluestar Silicones, Hubei Xin Sihai Chemical Co., Momentive, Shin-Etsu Chemical Co. Alfa Aesar GmbH & Co. KG are some of the prominent players in the market.
Table of Content
1. Executive Summary | Polydimethylsiloxane Market 1.1. Global Market Outlook 1.2. Demand-side Trends 1.3. Supply-side Trends 1.4. Technology Roadmap Analysis 1.5. Analysis and Recommendations 2. Market Overview 2.1. Market Coverage / Taxonomy 2.2. Market Definition / Scope / Limitations 3. Market Background 3.1. Market Dynamics 3.1.1. Drivers 3.1.2. Restraints 3.1.3. Opportunity 3.1.4. Trends 3.2. Scenario Forecast 3.2.1. Demand in Optimistic Scenario 3.2.2. Demand in Likely Scenario 3.2.3. Demand in Conservative Scenario 3.3. Opportunity Map Analysis 3.4. Product Life Cycle Analysis 3.5. Supply Chain Analysis 3.5.1. Supply Side Participants and their Roles 3.5.1.1. Producers 3.5.1.2. Mid-Level Participants (Traders/ Agents/ Brokers) 3.5.1.3. Wholesalers and Distributors 3.5.2. Value Added and Value Created at Node in the Supply Chain 3.5.3. List of Raw Material Suppliers 3.5.4. List of Existing and Potential Buyers 3.6. Investment Feasibility Matrix 3.7. Value Chain Analysis 3.7.1. Profit Margin Analysis 3.7.2. Wholesalers and Distributors 3.7.3. Retailers 3.8. PESTLE and Porter’s Analysis 3.9. Regulatory Landscape 3.9.1. By Key Regions 3.9.2. By Key Countries 3.10. Regional Parent Market Outlook 3.11. Production and Consumption Statistics 3.12. Import and Export Statistics 4. Global Market Analysis 2016 to 2021 and Forecast, 2022 to 2032 4.1. Historical Market Size Value (US$ Million) & Volume (Tonnes) Analysis, 2016 to 2021 4.2. Current and Future Market Size Value (US$ Million) & Volume (Tonnes) Projections, 2022 to 2032 4.2.1. Y-o-Y Growth Trend Analysis 4.2.2. Absolute $ Opportunity Analysis 5. Global Market Analysis 2016 to 2021 and Forecast 2022 to 2032, By Types 5.1. Introduction / Key Findings 5.2. Historical Market Size Value (US$ Million) & Volume (Tonnes) Analysis By Types, 2016 to 2021 5.3. Current and Future Market Size Value (US$ Million) & Volume (Tonnes) Analysis and Forecast By Types, 2022 to 2032 5.3.1. Lower Molecular Weight 5.3.2. Higher Molecular Weight 5.3.3. Ultra-High Molecular Weight 5.4. Y-o-Y Growth Trend Analysis By Types, 2016 to 2021 5.5. Absolute $ Opportunity Analysis By Types, 2022 to 2032 6. Global Market Analysis 2016 to 2021 and Forecast 2022 to 2032, By Application 6.1. Introduction / Key Findings 6.2. Historical Market Size Value (US$ Million) & Volume (Tonnes) Analysis By Application, 2016 to 2021 6.3. Current and Future Market Size Value (US$ Million) & Volume (Tonnes) Analysis and Forecast By Application, 2022 to 2032 6.3.1. Lubricants and Greases 6.3.2. Surfactants and Antifoaming Agents 6.3.3. Pharmaceutical and Cosmetic Industry 6.3.4. Food & Beverages industry 6.3.5. Others 6.4. Y-o-Y Growth Trend Analysis By Application, 2016 to 2021 6.5. Absolute $ Opportunity Analysis By Application, 2022 to 2032 7. Global Market Analysis 2016 to 2021 and Forecast 2022 to 2032, By Region 7.1. Introduction 7.2. Historical Market Size Value (US$ Million) & Volume (Tonnes) Analysis By Region, 2016 to 2021 7.3. Current Market Size Value (US$ Million) & Volume (Tonnes) Analysis and Forecast By Region, 2022 to 2032 7.3.1. North America 7.3.2. Latin America 7.3.3. Europe 7.3.4. Asia Pacific 7.3.5. Middle East and Africa 7.4. Market Attractiveness Analysis By Region 8. North America Market Analysis 2016 to 2021 and Forecast 2022 to 2032, By Country 8.1. Historical Market Size Value (US$ Million) & Volume (Tonnes) Trend Analysis By Market Taxonomy, 2016 to 2021 8.2. Market Size Value (US$ Million) & Volume (Tonnes) Forecast By Market Taxonomy, 2022 to 2032 8.2.1. By Country 8.2.1.1. USA 8.2.1.2. Canada 8.2.2. By Types 8.2.3. By Application 8.3. Market Attractiveness Analysis 8.3.1. By Country 8.3.2. By Types 8.3.3. By Application 8.4. Key Takeaways 9. Latin America Market Analysis 2016 to 2021 and Forecast 2022 to 2032, By Country 9.1. Historical Market Size Value (US$ Million) & Volume (Tonnes) Trend Analysis By Market Taxonomy, 2016 to 2021 9.2. Market Size Value (US$ Million) & Volume (Tonnes) Forecast By Market Taxonomy, 2022 to 2032 9.2.1. By Country 9.2.1.1. Brazil 9.2.1.2. Mexico 9.2.1.3. Rest of Latin America 9.2.2. By Types 9.2.3. By Application 9.3. Market Attractiveness Analysis 9.3.1. By Country 9.3.2. By Types 9.3.3. By Application 9.4. Key Takeaways 10. Europe Market Analysis 2016 to 2021 and Forecast 2022 to 2032, By Country 10.1. Historical Market Size Value (US$ Million) & Volume (Tonnes) Trend Analysis By Market Taxonomy, 2016 to 2021 10.2. Market Size Value (US$ Million) & Volume (Tonnes) Forecast By Market Taxonomy, 2022 to 2032 10.2.1. By Country 10.2.1.1. Germany 10.2.1.2. United Kingdom 10.2.1.3. France 10.2.1.4. Spain 10.2.1.5. Italy 10.2.1.6. Rest of Europe 10.2.2. By Types 10.2.3. By Application 10.3. Market Attractiveness Analysis 10.3.1. By Country 10.3.2. By Types 10.3.3. By Application 10.4. Key Takeaways 11. Asia Pacific Market Analysis 2016 to 2021 and Forecast 2022 to 2032, By Country 11.1. Historical Market Size Value (US$ Million) & Volume (Tonnes) Trend Analysis By Market Taxonomy, 2016 to 2021 11.2. Market Size Value (US$ Million) & Volume (Tonnes) Forecast By Market Taxonomy, 2022 to 2032 11.2.1. By Country 11.2.1.1. China 11.2.1.2. Japan 11.2.1.3. South Korea 11.2.1.4. Singapore 11.2.1.5. Thailand 11.2.1.6. Indonesia 11.2.1.7. Australia 11.2.1.8. New Zealand 11.2.1.9. Rest of Asia Pacific 11.2.2. By Types 11.2.3. By Application 11.3. Market Attractiveness Analysis 11.3.1. By Country 11.3.2. By Types 11.3.3. By Application 11.4. Key Takeaways 12. Middle East and Africa Market Analysis 2016 to 2021 and Forecast 2022 to 2032, By Country 12.1. Historical Market Size Value (US$ Million) & Volume (Tonnes) Trend Analysis By Market Taxonomy, 2016 to 2021 12.2. Market Size Value (US$ Million) & Volume (Tonnes) Forecast By Market Taxonomy, 2022 to 2032 12.2.1. By Country 12.2.1.1. GCC Countries 12.2.1.2. South Africa 12.2.1.3. Israel 12.2.1.4. Rest of Middle East and Africa 12.2.2. By Types 12.2.3. By Application 12.3. Market Attractiveness Analysis 12.3.1. By Country 12.3.2. By Types 12.3.3. By Application 12.4. Key Takeaways 13. Key Countries Market Analysis 13.1. USA 13.1.1. Pricing Analysis 13.1.2. Market Share Analysis, 2021 13.1.2.1. By Types 13.1.2.2. By Application 13.2. Canada 13.2.1. Pricing Analysis 13.2.2. Market Share Analysis, 2021 13.2.2.1. By Types 13.2.2.2. By Application 13.3. Brazil 13.3.1. Pricing Analysis 13.3.2. Market Share Analysis, 2021 13.3.2.1. By Types 13.3.2.2. By Application 13.4. Mexico 13.4.1. Pricing Analysis 13.4.2. Market Share Analysis, 2021 13.4.2.1. By Types 13.4.2.2. By Application 13.5. Germany 13.5.1. Pricing Analysis 13.5.2. Market Share Analysis, 2021 13.5.2.1. By Types 13.5.2.2. By Application 13.6. United Kingdom 13.6.1. Pricing Analysis 13.6.2. Market Share Analysis, 2021 13.6.2.1. By Types 13.6.2.2. By Application 13.7. France 13.7.1. Pricing Analysis 13.7.2. Market Share Analysis, 2021 13.7.2.1. By Types 13.7.2.2. By Application 13.8. Spain 13.8.1. Pricing Analysis 13.8.2. Market Share Analysis, 2021 13.8.2.1. By Types 13.8.2.2. By Application 13.9. Italy 13.9.1. Pricing Analysis 13.9.2. Market Share Analysis, 2021 13.9.2.1. By Types 13.9.2.2. By Application 13.10. China 13.10.1. Pricing Analysis 13.10.2. Market Share Analysis, 2021 13.10.2.1. By Types 13.10.2.2. By Application 13.11. Japan 13.11.1. Pricing Analysis 13.11.2. Market Share Analysis, 2021 13.11.2.1. By Types 13.11.2.2. By Application 13.12. South Korea 13.12.1. Pricing Analysis 13.12.2. Market Share Analysis, 2021 13.12.2.1. By Types 13.12.2.2. By Application 13.13. Singapore 13.13.1. Pricing Analysis 13.13.2. Market Share Analysis, 2021 13.13.2.1. By Types 13.13.2.2. By Application 13.14. Thailand 13.14.1. Pricing Analysis 13.14.2. Market Share Analysis, 2021 13.14.2.1. By Types 13.14.2.2. By Application 13.15. Indonesia 13.15.1. Pricing Analysis 13.15.2. Market Share Analysis, 2021 13.15.2.1. By Types 13.15.2.2. By Application 13.16. Australia 13.16.1. Pricing Analysis 13.16.2. Market Share Analysis, 2021 13.16.2.1. By Types 13.16.2.2. By Application 13.17. New Zealand 13.17.1. Pricing Analysis 13.17.2. Market Share Analysis, 2021 13.17.2.1. By Types 13.17.2.2. By Application 13.18. GCC Countries 13.18.1. Pricing Analysis 13.18.2. Market Share Analysis, 2021 13.18.2.1. By Types 13.18.2.2. By Application 13.19. South Africa 13.19.1. Pricing Analysis 13.19.2. Market Share Analysis, 2021 13.19.2.1. By Types 13.19.2.2. By Application 13.20. Israel 13.20.1. Pricing Analysis 13.20.2. Market Share Analysis, 2021 13.20.2.1. By Types 13.20.2.2. By Application 14. Market Structure Analysis 14.1. Competition Dashboard 14.2. Competition Benchmarking 14.3. Market Share Analysis of Top Players 14.3.1. By Regional 14.3.2. By Types 14.3.3. By Application 15. Competition Analysis 15.1. Competition Deep Dive 15.1.1. Dow Corning Corporation 15.1.1.1. Overview 15.1.1.2. Product Portfolio 15.1.1.3. Profitability by Market Segments 15.1.1.4. Sales Footprint 15.1.1.5. Strategy Overview 15.1.1.5.1. Marketing Strategy 15.1.1.5.2. Product Strategy 15.1.1.5.3. Channel Strategy 15.1.2. Wacker Chemie AG 15.1.2.1. Overview 15.1.2.2. Product Portfolio 15.1.2.3. Profitability by Market Segments 15.1.2.4. Sales Footprint 15.1.2.5. Strategy Overview 15.1.2.5.1. Marketing Strategy 15.1.2.5.2. Product Strategy 15.1.2.5.3. Channel Strategy 15.1.3. Bluestar Silicones 15.1.3.1. Overview 15.1.3.2. Product Portfolio 15.1.3.3. Profitability by Market Segments 15.1.3.4. Sales Footprint 15.1.3.5. Strategy Overview 15.1.3.5.1. Marketing Strategy 15.1.3.5.2. Product Strategy 15.1.3.5.3. Channel Strategy 15.1.4. Hubei Xin Sihai Chemical Co. 15.1.4.1. Overview 15.1.4.2. Product Portfolio 15.1.4.3. Profitability by Market Segments 15.1.4.4. Sales Footprint 15.1.4.5. Strategy Overview 15.1.4.5.1. Marketing Strategy 15.1.4.5.2. Product Strategy 15.1.4.5.3. Channel Strategy 15.1.5. Momentive 15.1.5.1. Overview 15.1.5.2. Product Portfolio 15.1.5.3. Profitability by Market Segments 15.1.5.4. Sales Footprint 15.1.5.5. Strategy Overview 15.1.5.5.1. Marketing Strategy 15.1.5.5.2. Product Strategy 15.1.5.5.3. Channel Strategy 15.1.6. Shin-Etsu Chemical Co. 15.1.6.1. Overview 15.1.6.2. Product Portfolio 15.1.6.3. Profitability by Market Segments 15.1.6.4. Sales Footprint 15.1.6.5. Strategy Overview 15.1.6.5.1. Marketing Strategy 15.1.6.5.2. Product Strategy 15.1.6.5.3. Channel Strategy 15.1.7. Alfa Aesar GmbH & Co. KG 15.1.7.1. Overview 15.1.7.2. Product Portfolio 15.1.7.3. Profitability by Market Segments 15.1.7.4. Sales Footprint 15.1.7.5. Strategy Overview 15.1.7.5.1. Marketing Strategy 15.1.7.5.2. Product Strategy 15.1.7.5.3. Channel Strategy 15.1.8. Sigma Aldrich Corp. 15.1.8.1. Overview 15.1.8.2. Product Portfolio 15.1.8.3. Profitability by Market Segments 15.1.8.4. Sales Footprint 15.1.8.5. Strategy Overview 15.1.8.5.1. Marketing Strategy 15.1.8.5.2. Product Strategy 15.1.8.5.3. Channel Strategy 15.1.9. Jinan Haohua Industry Co. Ltd. 15.1.9.1. Overview 15.1.9.2. Product Portfolio 15.1.9.3. Profitability by Market Segments 15.1.9.4. Sales Footprint 15.1.9.5. Strategy Overview 15.1.9.5.1. Marketing Strategy 15.1.9.5.2. Product Strategy 15.1.9.5.3. Channel Strategy 15.1.10. TCI Tokyo Chemical Industry Co. 15.1.10.1. Overview 15.1.10.2. Product Portfolio 15.1.10.3. Profitability by Market Segments 15.1.10.4. Sales Footprint 15.1.10.5. Strategy Overview 15.1.10.5.1. Marketing Strategy 15.1.10.5.2. Product Strategy 15.1.10.5.3. Channel Strategy 15.1.11. Fisher Scientific International Inc. 15.1.11.1. Overview 15.1.11.2. Product Portfolio 15.1.11.3. Profitability by Market Segments 15.1.11.4. Sales Footprint 15.1.11.5. Strategy Overview 15.1.11.5.1. Marketing Strategy 15.1.11.5.2. Product Strategy 15.1.11.5.3. Channel Strategy 15.1.12. Microsurfaces. 15.1.12.1. Overview 15.1.12.2. Product Portfolio 15.1.12.3. Profitability by Market Segments 15.1.12.4. Sales Footprint 15.1.12.5. Strategy Overview 15.1.12.5.1. Marketing Strategy 15.1.12.5.2. Product Strategy 15.1.12.5.3. Channel Strategy 15.1.13. Xona Microfluidics 15.1.13.1. Overview 15.1.13.2. Product Portfolio 15.1.13.3. Profitability by Market Segments 15.1.13.4. Sales Footprint 15.1.13.5. Strategy Overview 15.1.13.5.1. Marketing Strategy 15.1.13.5.2. Product Strategy 15.1.13.5.3. Channel Strategy 15.1.14. SphereVis 15.1.14.1. Overview 15.1.14.2. Product Portfolio 15.1.14.3. Profitability by Market Segments 15.1.14.4. Sales Footprint 15.1.14.5. Strategy Overview 15.1.14.5.1. Marketing Strategy 15.1.14.5.2. Product Strategy 15.1.14.5.3. Channel Strategy 16. Assumptions & Acronyms Used 17. Research Methodology
Don't pay for what you don't need
Customize your report by selecting specific countries or regions and save 30%!
List of Tables
Table 1: Global Market Value (US$ Million) Forecast by Region, 2016 to 2032 Table 2: Global Market Volume (Tonnes) Forecast by Region, 2016 to 2032 Table 3: Global Market Value (US$ Million) Forecast by Types, 2016 to 2032 Table 4: Global Market Volume (Tonnes) Forecast by Types, 2016 to 2032 Table 5: Global Market Value (US$ Million) Forecast by Application, 2016 to 2032 Table 6: Global Market Volume (Tonnes) Forecast by Application, 2016 to 2032 Table 7: North America Market Value (US$ Million) Forecast by Country, 2016 to 2032 Table 8: North America Market Volume (Tonnes) Forecast by Country, 2016 to 2032 Table 9: North America Market Value (US$ Million) Forecast by Types, 2016 to 2032 Table 10: North America Market Volume (Tonnes) Forecast by Types, 2016 to 2032 Table 11: North America Market Value (US$ Million) Forecast by Application, 2016 to 2032 Table 12: North America Market Volume (Tonnes) Forecast by Application, 2016 to 2032 Table 13: Latin America Market Value (US$ Million) Forecast by Country, 2016 to 2032 Table 14: Latin America Market Volume (Tonnes) Forecast by Country, 2016 to 2032 Table 15: Latin America Market Value (US$ Million) Forecast by Types, 2016 to 2032 Table 16: Latin America Market Volume (Tonnes) Forecast by Types, 2016 to 2032 Table 17: Latin America Market Value (US$ Million) Forecast by Application, 2016 to 2032 Table 18: Latin America Market Volume (Tonnes) Forecast by Application, 2016 to 2032 Table 19: Europe Market Value (US$ Million) Forecast by Country, 2016 to 2032 Table 20: Europe Market Volume (Tonnes) Forecast by Country, 2016 to 2032 Table 21: Europe Market Value (US$ Million) Forecast by Types, 2016 to 2032 Table 22: Europe Market Volume (Tonnes) Forecast by Types, 2016 to 2032 Table 23: Europe Market Value (US$ Million) Forecast by Application, 2016 to 2032 Table 24: Europe Market Volume (Tonnes) Forecast by Application, 2016 to 2032 Table 25: Asia Pacific Market Value (US$ Million) Forecast by Country, 2016 to 2032 Table 26: Asia Pacific Market Volume (Tonnes) Forecast by Country, 2016 to 2032 Table 27: Asia Pacific Market Value (US$ Million) Forecast by Types, 2016 to 2032 Table 28: Asia Pacific Market Volume (Tonnes) Forecast by Types, 2016 to 2032 Table 29: Asia Pacific Market Value (US$ Million) Forecast by Application, 2016 to 2032 Table 30: Asia Pacific Market Volume (Tonnes) Forecast by Application, 2016 to 2032 Table 31: Middle East and Africa Market Value (US$ Million) Forecast by Country, 2016 to 2032 Table 32: Middle East and Africa Market Volume (Tonnes) Forecast by Country, 2016 to 2032 Table 33: Middle East and Africa Market Value (US$ Million) Forecast by Types, 2016 to 2032 Table 34: Middle East and Africa Market Volume (Tonnes) Forecast by Types, 2016 to 2032 Table 35: Middle East and Africa Market Value (US$ Million) Forecast by Application, 2016 to 2032 Table 36: Middle East and Africa Market Volume (Tonnes) Forecast by Application, 2016 to 2032
Find your sweet spots for generating winning opportunities in this market.
Talk to AnalystList of Charts
Figure 1: Global Market Value (US$ Million) by Types, 2022 to 2032 Figure 2: Global Market Value (US$ Million) by Application, 2022 to 2032 Figure 3: Global Market Value (US$ Million) by Region, 2022 to 2032 Figure 4: Global Market Value (US$ Million) Analysis by Region, 2016 to 2032 Figure 5: Global Market Volume (Tonnes) Analysis by Region, 2016 to 2032 Figure 6: Global Market Value Share (%) and BPS Analysis by Region, 2022 to 2032 Figure 7: Global Market Y-o-Y Growth (%) Projections by Region, 2022 to 2032 Figure 8: Global Market Value (US$ Million) Analysis by Types, 2016 to 2032 Figure 9: Global Market Volume (Tonnes) Analysis by Types, 2016 to 2032 Figure 10: Global Market Value Share (%) and BPS Analysis by Types, 2022 to 2032 Figure 11: Global Market Y-o-Y Growth (%) Projections by Types, 2022 to 2032 Figure 12: Global Market Value (US$ Million) Analysis by Application, 2016 to 2032 Figure 13: Global Market Volume (Tonnes) Analysis by Application, 2016 to 2032 Figure 14: Global Market Value Share (%) and BPS Analysis by Application, 2022 to 2032 Figure 15: Global Market Y-o-Y Growth (%) Projections by Application, 2022 to 2032 Figure 16: Global Market Attractiveness by Types, 2022 to 2032 Figure 17: Global Market Attractiveness by Application, 2022 to 2032 Figure 18: Global Market Attractiveness by Region, 2022 to 2032 Figure 19: North America Market Value (US$ Million) by Types, 2022 to 2032 Figure 20: North America Market Value (US$ Million) by Application, 2022 to 2032 Figure 21: North America Market Value (US$ Million) by Country, 2022 to 2032 Figure 22: North America Market Value (US$ Million) Analysis by Country, 2016 to 2032 Figure 23: North America Market Volume (Tonnes) Analysis by Country, 2016 to 2032 Figure 24: North America Market Value Share (%) and BPS Analysis by Country, 2022 to 2032 Figure 25: North America Market Y-o-Y Growth (%) Projections by Country, 2022 to 2032 Figure 26: North America Market Value (US$ Million) Analysis by Types, 2016 to 2032 Figure 27: North America Market Volume (Tonnes) Analysis by Types, 2016 to 2032 Figure 28: North America Market Value Share (%) and BPS Analysis by Types, 2022 to 2032 Figure 29: North America Market Y-o-Y Growth (%) Projections by Types, 2022 to 2032 Figure 30: North America Market Value (US$ Million) Analysis by Application, 2016 to 2032 Figure 31: North America Market Volume (Tonnes) Analysis by Application, 2016 to 2032 Figure 32: North America Market Value Share (%) and BPS Analysis by Application, 2022 to 2032 Figure 33: North America Market Y-o-Y Growth (%) Projections by Application, 2022 to 2032 Figure 34: North America Market Attractiveness by Types, 2022 to 2032 Figure 35: North America Market Attractiveness by Application, 2022 to 2032 Figure 36: North America Market Attractiveness by Country, 2022 to 2032 Figure 37: Latin America Market Value (US$ Million) by Types, 2022 to 2032 Figure 38: Latin America Market Value (US$ Million) by Application, 2022 to 2032 Figure 39: Latin America Market Value (US$ Million) by Country, 2022 to 2032 Figure 40: Latin America Market Value (US$ Million) Analysis by Country, 2016 to 2032 Figure 41: Latin America Market Volume (Tonnes) Analysis by Country, 2016 to 2032 Figure 42: Latin America Market Value Share (%) and BPS Analysis by Country, 2022 to 2032 Figure 43: Latin America Market Y-o-Y Growth (%) Projections by Country, 2022 to 2032 Figure 44: Latin America Market Value (US$ Million) Analysis by Types, 2016 to 2032 Figure 45: Latin America Market Volume (Tonnes) Analysis by Types, 2016 to 2032 Figure 46: Latin America Market Value Share (%) and BPS Analysis by Types, 2022 to 2032 Figure 47: Latin America Market Y-o-Y Growth (%) Projections by Types, 2022 to 2032 Figure 48: Latin America Market Value (US$ Million) Analysis by Application, 2016 to 2032 Figure 49: Latin America Market Volume (Tonnes) Analysis by Application, 2016 to 2032 Figure 50: Latin America Market Value Share (%) and BPS Analysis by Application, 2022 to 2032 Figure 51: Latin America Market Y-o-Y Growth (%) Projections by Application, 2022 to 2032 Figure 52: Latin America Market Attractiveness by Types, 2022 to 2032 Figure 53: Latin America Market Attractiveness by Application, 2022 to 2032 Figure 54: Latin America Market Attractiveness by Country, 2022 to 2032 Figure 55: Europe Market Value (US$ Million) by Types, 2022 to 2032 Figure 56: Europe Market Value (US$ Million) by Application, 2022 to 2032 Figure 57: Europe Market Value (US$ Million) by Country, 2022 to 2032 Figure 58: Europe Market Value (US$ Million) Analysis by Country, 2016 to 2032 Figure 59: Europe Market Volume (Tonnes) Analysis by Country, 2016 to 2032 Figure 60: Europe Market Value Share (%) and BPS Analysis by Country, 2022 to 2032 Figure 61: Europe Market Y-o-Y Growth (%) Projections by Country, 2022 to 2032 Figure 62: Europe Market Value (US$ Million) Analysis by Types, 2016 to 2032 Figure 63: Europe Market Volume (Tonnes) Analysis by Types, 2016 to 2032 Figure 64: Europe Market Value Share (%) and BPS Analysis by Types, 2022 to 2032 Figure 65: Europe Market Y-o-Y Growth (%) Projections by Types, 2022 to 2032 Figure 66: Europe Market Value (US$ Million) Analysis by Application, 2016 to 2032 Figure 67: Europe Market Volume (Tonnes) Analysis by Application, 2016 to 2032 Figure 68: Europe Market Value Share (%) and BPS Analysis by Application, 2022 to 2032 Figure 69: Europe Market Y-o-Y Growth (%) Projections by Application, 2022 to 2032 Figure 70: Europe Market Attractiveness by Types, 2022 to 2032 Figure 71: Europe Market Attractiveness by Application, 2022 to 2032 Figure 72: Europe Market Attractiveness by Country, 2022 to 2032 Figure 73: Asia Pacific Market Value (US$ Million) by Types, 2022 to 2032 Figure 74: Asia Pacific Market Value (US$ Million) by Application, 2022 to 2032 Figure 75: Asia Pacific Market Value (US$ Million) by Country, 2022 to 2032 Figure 76: Asia Pacific Market Value (US$ Million) Analysis by Country, 2016 to 2032 Figure 77: Asia Pacific Market Volume (Tonnes) Analysis by Country, 2016 to 2032 Figure 78: Asia Pacific Market Value Share (%) and BPS Analysis by Country, 2022 to 2032 Figure 79: Asia Pacific Market Y-o-Y Growth (%) Projections by Country, 2022 to 2032 Figure 80: Asia Pacific Market Value (US$ Million) Analysis by Types, 2016 to 2032 Figure 81: Asia Pacific Market Volume (Tonnes) Analysis by Types, 2016 to 2032 Figure 82: Asia Pacific Market Value Share (%) and BPS Analysis by Types, 2022 to 2032 Figure 83: Asia Pacific Market Y-o-Y Growth (%) Projections by Types, 2022 to 2032 Figure 84: Asia Pacific Market Value (US$ Million) Analysis by Application, 2016 to 2032 Figure 85: Asia Pacific Market Volume (Tonnes) Analysis by Application, 2016 to 2032 Figure 86: Asia Pacific Market Value Share (%) and BPS Analysis by Application, 2022 to 2032 Figure 87: Asia Pacific Market Y-o-Y Growth (%) Projections by Application, 2022 to 2032 Figure 88: Asia Pacific Market Attractiveness by Types, 2022 to 2032 Figure 89: Asia Pacific Market Attractiveness by Application, 2022 to 2032 Figure 90: Asia Pacific Market Attractiveness by Country, 2022 to 2032 Figure 91: Middle East and Africa Market Value (US$ Million) by Types, 2022 to 2032 Figure 92: Middle East and Africa Market Value (US$ Million) by Application, 2022 to 2032 Figure 93: Middle East and Africa Market Value (US$ Million) by Country, 2022 to 2032 Figure 94: Middle East and Africa Market Value (US$ Million) Analysis by Country, 2016 to 2032 Figure 95: Middle East and Africa Market Volume (Tonnes) Analysis by Country, 2016 to 2032 Figure 96: Middle East and Africa Market Value Share (%) and BPS Analysis by Country, 2022 to 2032 Figure 97: Middle East and Africa Market Y-o-Y Growth (%) Projections by Country, 2022 to 2032 Figure 98: Middle East and Africa Market Value (US$ Million) Analysis by Types, 2016 to 2032 Figure 99: Middle East and Africa Market Volume (Tonnes) Analysis by Types, 2016 to 2032 Figure 100: Middle East and Africa Market Value Share (%) and BPS Analysis by Types, 2022 to 2032 Figure 101: Middle East and Africa Market Y-o-Y Growth (%) Projections by Types, 2022 to 2032 Figure 102: Middle East and Africa Market Value (US$ Million) Analysis by Application, 2016 to 2032 Figure 103: Middle East and Africa Market Volume (Tonnes) Analysis by Application, 2016 to 2032 Figure 104: Middle East and Africa Market Value Share (%) and BPS Analysis by Application, 2022 to 2032 Figure 105: Middle East and Africa Market Y-o-Y Growth (%) Projections by Application, 2022 to 2032 Figure 106: Middle East and Africa Market Attractiveness by Types, 2022 to 2032 Figure 107: Middle East and Africa Market Attractiveness by Application, 2022 to 2032 Figure 108: Middle East and Africa Market Attractiveness by Country, 2022 to 2032
Recommendations
Explore Chemicals & Materials Insights
View Reports