Reports

- Global Locations -

Headquarters

Future Market Insights, Inc.

Christiana Corporate, 200
Continental Drive, Suite 401,
Newark, Delaware - 19713,
United States

T: +1-845-579-5705

Americas

Future Market Insights, Inc.

616 Corporate Way, Suite 2-9018,
Valley Cottage, NY 10989, United States

T: +1-347-918-3531

MEA

Future Market Insights

1602-6 Jumeirah Bay X2 Tower, Plot No: JLT-PH2-X2A,
Jumeirah Lakes Towers, Dubai,
United Arab Emirates

Europe

Future Market Insights

3rd Floor, 207 Regent Street,
W1B 3HH London
United Kingdom

T: + 44 (0) 20 8123 9659
D: +44 (0) 20 3287 4268

Asia Pacific

Future Market Insights

IndiaLand Global Tech Park, Unit UG-1, Behind Grand HighStreet, Phase 1, Hinjawadi, MH, Pune – 411057, India

Polymerization Initiators Market Outlook (2022 to 2032)

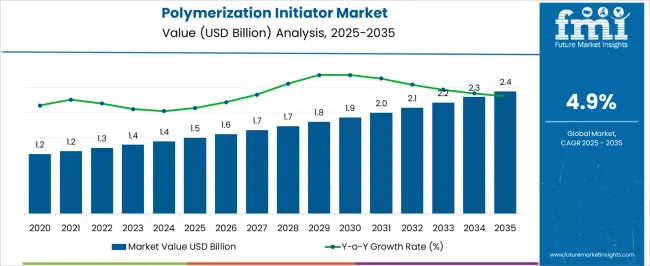
[205 Pages Report] The global polymerization initiators market is forecast to top US$ 1.3 Billion in 2022. Polymerization initiator sales are projected to increase at a healthy CAGR of 4.9%, totaling US$ 2.1 Billion by 2032. Growing demand for polymerization initiators in plastics production, which are widely used in various end-use industries, is expected to boost demand for polymerization initiators.

Attributes Details
Polymerization Initiators Market Value (2021A) US$ 1.2 Billion
Polymerization Initiators Sales (2022E) US$ 1.3 Billion
Polymerization Initiators Market Forecast (2032F) US$ 2.1 Billion
Polymerization Initiators Market Value-based CAGR (2022 to 2032) 4.9%
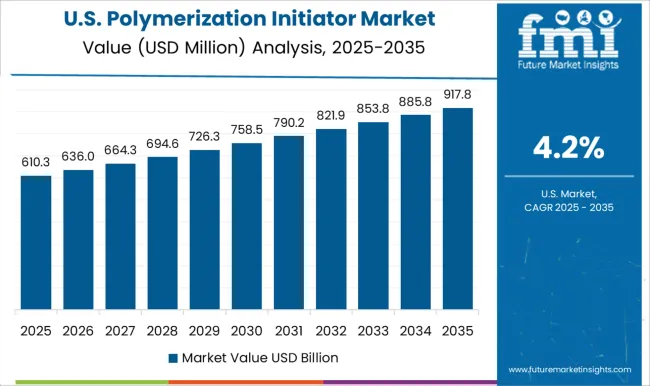
Polymerization Initiators Market Collective Value Share: Top 3 Countries (2022E) 50.6%

The polymerization initiators market is projected to register year-on-year growth of 4.2% in 2022. Increasing consumption of polymerization initiators in the manufacturing of various polymers which are utilized in the production of automotive parts, electronic components, packaging, and paints & coatings expected to fuel sales of polymerization initiators.

Don't pay for what you don't need

Customize your report by selecting specific countries or regions and save 30%!

2017 to 2021 Polymerization Initiators Market Historic Outlook Compared to 2022 to 2032 Forecast

The demand for polymerization initiators grew at 2.1% CAGR between 2017 and 2021. During the forecast period, sales of polymerization initiations are projected to grow at a 4.9% CAGR.

There are various types of initiators available in the market, which are used for the manufacturing of various types of polymers. Growing applications of polymers in various end-use industries like automotive, healthcare, consumer applications, electronics, and packaging, are estimated to boost the demand for polymerization initiators in the forthcoming years.

Polymerization Initiators Market

What Are the Prospects of Polymerization Initiators in Polyethylene & Polypropylene Applications?

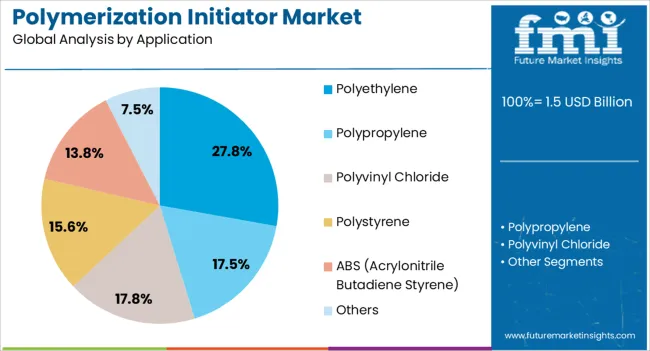
Polyethylene, as the name implies, is a polymer formed by the polymerization of ethylene monomers. Ethylene is polymerized by a radical mechanism where high temperature & pressure is maintained, and organic peroxide initiators are added to initiate the process. One of the most common applications of organic peroxides is monomer polymerization.

In radical polymerization, a wide variety of azo initiators and organic peroxides are used, where they easily form free radicals. They can be used to make low-density polyethylene, styrene, and other polymers.

Polypropylene is expected to be the second-largest application segment owing to its consumption in the manufacturing of pipes, packaging, healthcare, and electrical products. Polypropylene offers chemical resistance and is flexible, transparent & has a good appearance, which are required in certain end-use industries.

Due to the increasing demand for polypropylene from end-use industries, sales of polymerization initiators are expected to grow over the forecast period. Both polyethylene and propylene are expected to collectively hold 52% of the total market share in 2022.

Nikhil Kaitwade
Nikhil Kaitwade

Principal Consultant

Talk to Analyst

Find your sweet spots for generating winning opportunities in this market.

What Are the Opportunities in the Polymerization Initiators?

Polymerization initiators, such as, azo initiators, are used as an intermediate in the production of pharmaceutical drugs such as Resveratrol. Resveratrol and its analogs are types of antioxidants and have anti-inflammatory properties. These initiators are also used in the study of drug oxidation.

With growing health awareness and concerns about well-being, the medical industry is going through a transformation. Photo-polymerization with peroxides and other initiators is being used in biomedical applications such as 3D hydrogel structures and drug delivery systems.

Benzyl peroxide, a type of organic peroxide, is gaining popularity due to its various emerging applications along with conventional applications. This is used in the plastics industry, along with beauty products such as creams for acne treatment.

Some versions of BPO are used in antibiotics & generic medication, along with usage in teeth whitening & bleaching of hair. It is also listed on the WHO List of Essential Medicines. This is expected to create opportunities for growth over the forecast period.

Country-wise Insights

What Will Be the Demand Outlook of the India Polymerization Initiators Market?

Surging Demand for Polymerization Initiators in Plastic Manufacturing Will Fuel Growth

Polymerization initiators are being utilized in the production of various polymers, which are further used in automotive, building & construction, paints & coatings, and other industries. The ongoing expansion of the automotive and packaging industries in India is anticipated to push sales of polymerization initiators over the forecast period.

Growing investments in research and development to improve polymer production and polymerization processes will create demand in the market. Furthermore, the growing usage of polymerization initiators in various industries, as well as their use in chain-growth polymerization such as radical polymerization for controlling initiation via heat or light, will drive sales in the market.

Further surging demand for polymers such as PE, PP, and PVC in the automotive, plastics, and healthcare sectors will boost sales of polymerization initiators at a CAGR of 5.9% over the forecast period.

What is Driving the China Polymerization Initiators Market?

Increasing Applications of Polymers in the Automotive Sector to Boost Sales of Polymerization Initiators

China is expected to remain a key producer and consumer of polymerization initiators, accounting for approximately 77% of the total polymerization initiator consumption in East Asia in 2022. Growing demand from the construction and automotive industries is driving sales of polymers.

Rapid growth in the manufacturing sector in China is spurring demand for composites and plastics, hence, driving polymerization initiators' demand. China is one of the key producers of PE, PP, PVC & other plastics, which are the building blocks for the various end-use industries.

The market is expected to be driven by the expansion of the automobile, construction, and building industries, which consume these plastics at various stages.

Get the data you need at a Fraction of the cost

Personalize your report by choosing insights you need
and save 40%!

Category-wise Insights

Why is the Demand for Persulfate Polymerization Initiators Rising?

Sales of Persulfate Polymerization Initiators to Gain Traction

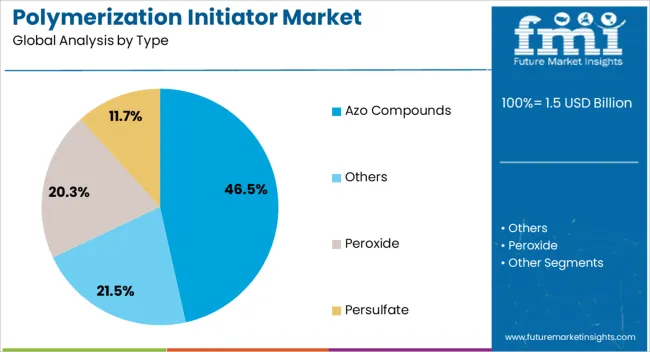
Based on type, the demand for persulfate polymerization initiators is projected to gain momentum at a 5% CAGR over the forecast period. Increasing usage in the production of polymers in different end-use industries such as automotive, construction & building, and packaging will boost sales in this segment.

Mainly there are three persulfates, which are utilized as initiators in process of polymerization. These are sodium, potassium & ammonium persulfates. Persulfates are usually termed alkali metal salts, which are produced by an electrochemical process.

These persulfates are used in the manufacturing of latex polymers for tires and paint & coatings. Sodium persulfate acts as a polymerization initiator, as well as a cleaner and an etchant in the production of printed circuit boards.

In the production of styrene-butadiene, vinyl, acrylic, styrene, and other resins, potassium persulfate is used as an initiator for emulsion polymerization processes. Ammonium persulfate is used as a polymerization initiator in cosmetics as a stimulant in hair bleaching formulations, and in the oil & gas industry as a gel breaker.

Competitive Landscape

Key polymerization initiator manufacturers are aiming to increase their production capacities to cater to the growing demand. Some key manufacturers, on the other hand, are concentrating their efforts on acquisitions. The acquisition of small-scale players will help to strengthen the company's market position and product portfolio. For instance:

  • In 2020, Nouryon completed its expansion of the organic peroxide facility in Brazil. This expansion will add capacity for products such as dibenzoyl peroxide (BPO) & methyl ethyl ketone peroxide.

Scope of Report

Attributes Details
Forecast Period 2022 to 2032
Historical Data Available for 2017 to 2021
Market Analysis US$ Billion for Value and Tons for Volume
Key Countries Covered The USA, Canada, Brazil, Mexico, Germany, Italy, France, The UK, Spain, BENELUX, Russia, China, Japan, South Korea, India, ASEAN, Australia and New Zealand, GCC Countries, Turkey, South Africa
Key Segments Covered Type, Application, and Region
Key Companies Profiled
  • Arkema
  • United Initiators
  • Nouryon
  • LANXESS
  • Adeka Corporation
  • Fujifilm Wako Pure Chemicals Corporation
  • Chemorous
  • Otsuka Chemical Co Ltd
  • PAT Impex India
  • Jinan Qinmu Fine Chemical Co., Ltd.
Report Coverage
  • Market Forecast, Company Share Analysis, Competition Intelligence, Drivers, Restraints, Opportunities and Threats Analysis, Market Dynamics and Challenges, and Strategic Growth Initiatives
Customization & Pricing Available upon Request

Polymerization Initiators Market by Category

By Type:

  • Peroxide
  • Persulfate
  • Azo Compounds
  • Others

By Application:

  • Polyethylene
  • Polypropylene
  • PVC
  • Polystyrene
  • ABS
  • Others

By Region:

  • North America
  • Latin America
  • Europe
  • East Asia
  • South Asia & Pacific
  • Middle East & Africa

Frequently Asked Questions

What is the current global polymerization initiators market value?

The global polymerization initiator market is anticipated to reach a valuation of US$ 1.3 Billion in 2022.

What is the demand outlook for polymerization initiators?

The global polymerization initiators market is anticipated to witness a growth at a 4.9% CAGR over the forecast period in terms of value.

At what rate did the global polymerization initiators market grow between 2017 and 2021?

The global polymerization initiators market witnessed a growth at a 2.1% CAGR between 2017 and 2021.

Who are the key players in the global polymerization initiators market?

Arkema, Nouryon, LANXESS, United Initiators, Adeka Corporation, Fujifilm Wako Pure Chemicals Corporation, Chemorous, Otsuka Chemical Co Ltd, and others are the key players in the global polymerization initiators market.

What is the market share of leading players in the global polymerization initiators market?

Key players in the global polymerization initiators market are expected to count for around 55-60% of the total market share.

Which are the key countries driving the global polymerization initiators market demand?

The key countries driving the global polymerization initiator demand are China, the USA., and India.

Table of Content

1. Executive Summary | Polymerization Initiators Market

    1.1. Global Market Outlook

    1.2. Demand Side Trends

    1.3. Supply Side Trends

    1.4. Analysis and Recommendations

2. Market Overview

    2.1. Market Coverage / Taxonomy

    2.2. Market Definition / Scope / Limitations

3. Key Market Trends

    3.1. Key Trends Impacting the Market

    3.2. Innovation / Development Trends

4. Key Success Factors

    4.1. Product Adoption / Usage Analysis

    4.2. Product Innovation & Diversification

    4.3. Marketing and Brand Management

    4.4. Supply Chain Management

5. Global Market Demand Analysis 2017 to 2021 and Forecast, 2022 to 2032

    5.1. Historical Market Volume (Tons) Analysis, 2017 to 2021

    5.2. Current and Future Market Volume (Tons) Projections, 2022 to 2032

    5.3. Y-o-Y Growth Trend Analysis

6. Global Market - Pricing Analysis

    6.1. Regional Pricing Analysis

    6.2. Pricing Analysis by Regions

7. Global Market Demand (in Value or Size in US$ Billion ) Analysis 2017 to 2021 and Forecast, 2022 to 2032

    7.1. Historical Market Value (US$ Billion ) Analysis, 2017 to 2021

    7.2. Current and Future Market Value (US$ Billion ) Projections, 2022 to 2032

        7.2.1. Y-o-Y Growth Trend Analysis

        7.2.2. Absolute $ Opportunity Analysis

8. Market Background

    8.1. Macro-Economic Factors

        8.1.1. Global Economic Outlook

        8.1.2. Global Chemical Industry Overview

        8.1.3. Global Specialty Chemicals Market Outlook

        8.1.4. Global Polymer and Plastic Industry Overview

        8.1.5. Global Manufacturing Value Added

        8.1.6. Other Macro-Economic Factors

    8.2. Forecast Factors - Relevance & Impact

        8.2.1. GDP Growth Outlook

        8.2.2. Manufacturing Industry Growth Outlook

        8.2.3. Impact of Pricing

        8.2.4. Plastic Industry Growth Forecast

        8.2.5. Growing Demand for Initiators

        8.2.6. Other Forecast Factors

    8.3. Supply-Demand Analysis

    8.4. Value Chain Analysis

        8.4.1. List of Manufacturers

        8.4.2. List of Distributors

        8.4.3. Probable List of End Users

    8.5. Production Process Overview

    8.6. Market Dynamics

    8.7. Impact of COVID-19 Crisis

9. Global Market Analysis 2017 to 2021 and Forecast 2022 to 2032, by Type

    9.1. Introduction / Key Findings

    9.2. Historical Market Size (US$ Billion ) and Volume Analysis By Type, 2017 to 2021

    9.3. Current and Future Market Size (US$ Billion ) and Volume Analysis and Forecast By Type, 2022 to 2032

        9.3.1. Peroxide

        9.3.2. Persulfate

        9.3.3. Azo Compounds

        9.3.4. Others

    9.4. Market Attractiveness Analyses, By Type

10. Global Market Analysis 2017 to 2021 and Forecast 2022 to 2032, By Application 

    10.1. Introduction / Key Findings

    10.2. Historical Market Size (US$ Billion ) and Volume Analysis By Application, 2017 to 2021

    10.3. Current and Future Market Size (US$ Billion ) and Volume Analysis and Forecast By Application, 2022 to 2032

        10.3.1. Polyethylene

        10.3.2. Polypropylene

        10.3.3. PVC

        10.3.4. Polystyrene

        10.3.5. ABS

        10.3.6. Others

    10.4. Market Attractiveness Analysis By Application

11. Global Market Analysis 2017 to 2021 and Forecast 2022 to 2032, by Region

    11.1. Introduction

    11.2. Historical Market Size (US$ Billion ) and Volume Analysis By Region, 2017 to 2021

    11.3. Current Market Size (US$ Billion ) and Volume Analysis and Forecast By Region, 2022 to 2032

        11.3.1. North America

        11.3.2. Latin America

        11.3.3. Europe

        11.3.4. East Asia

        11.3.5. South Asia & Pacific

        11.3.6. Middle East & Africa

    11.4. Market Attractiveness Analysis By Region

12. North America Market Analysis 2017 to 2021 and Forecast 2022 to 2032

    12.1. Introduction

    12.2. Pricing Analysis

    12.3. Historical Market Size (US$ Billion ) and Volume Trend Analysis By Market Taxonomy, 2017 to 2021

    12.4. Market Size (US$ Billion ) and Volume Forecast By Market Taxonomy, 2022 to 2032

        12.4.1. By Type

        12.4.2. By Application

        12.4.3. By Country

            12.4.3.1. United States of America

            12.4.3.2. Canada

    12.5. Market Attractiveness Analysis

        12.5.1. By Type

        12.5.2. By Application

        12.5.3. By Country

    12.6. Market Trends

    12.7. Drivers and Restraints Impact Analysis

13. Latin America Market Analysis 2017 to 2021 and Forecast 2022 to 2032

    13.1. Introduction

    13.2. Pricing Analysis

    13.3. Historical Market Size (US$ Billion ) and Volume Trend Analysis By Market Taxonomy, 2017 to 2021

    13.4. Market Size (US$ Billion ) and Volume Forecast By Market Taxonomy, 2022 to 2032

        13.4.1. By Type

        13.4.2. By Application

        13.4.3. By Country

            13.4.3.1. Brazil

            13.4.3.2. Mexico

            13.4.3.3. Rest of Latin America

    13.5. Market Attractiveness Analysis

        13.5.1. By Type

        13.5.2. By Application

        13.5.3. By Country

    13.6. Market Trends

    13.7. Drivers and Restraints Impact Analysis

14. Europe Market Analysis 2017 to 2021 and Forecast 2022 to 2032

    14.1. Introduction

    14.2. Pricing Analysis

    14.3. Historical Market Size (US$ Billion ) and Volume Trend Analysis By Market Taxonomy, 2017 to 2021

    14.4. Market Size (US$ Billion ) and Volume Forecast By Market Taxonomy, 2022 to 2032

        14.4.1. By Type

        14.4.2. By Application

        14.4.3. By Country

            14.4.3.1. Germany

            14.4.3.2. Italy

            14.4.3.3. France

            14.4.3.4. United Kingdom

            14.4.3.5. Spain

            14.4.3.6. BENELUX

            14.4.3.7. Russia

            14.4.3.8. Rest of Europe

    14.5. Market Attractiveness Analysis

        14.5.1. By Type

        14.5.2. By Application

        14.5.3. By Country

    14.6. Market Trends

    14.7. Drivers and Restraints Impact Analysis

15. East Asia Market Analysis 2017 to 2021 and Forecast 2022 to 2032

    15.1. Introduction

    15.2. Pricing Analysis

    15.3. Historical Market Size (US$ Billion ) and Volume Trend Analysis By Market Taxonomy, 2017 to 2021

    15.4. Market Size (US$ Billion ) and Volume Forecast By Market Taxonomy, 2022 to 2032

        15.4.1. By Type

        15.4.2. By Application

        15.4.3. By Country

            15.4.3.1. China

            15.4.3.2. Japan

            15.4.3.3. South Korea

    15.5. Market Attractiveness Analysis

        15.5.1. By Type

        15.5.2. By Application

        15.5.3. By Country

    15.6. Market Trends

    15.7. Drivers and Restraints Impact Analysis

16. South Asia & Pacific Market Analysis 2017 to 2021 and Forecast 2022 to 2032

    16.1. Introduction

    16.2. Pricing Analysis

    16.3. Historical Market Size (US$ Billion ) and Volume Trend Analysis By Market Taxonomy, 2017 to 2021

    16.4. Market Size (US$ Billion ) and Volume Forecast By Market Taxonomy, 2022 to 2032

        16.4.1. By Type

        16.4.2. By Application

        16.4.3. By Country

            16.4.3.1. India

            16.4.3.2. ASEAN

            16.4.3.3. Australia and New Zealand

            16.4.3.4. Rest of South Asia & Pacific

    16.5. Market Attractiveness Analysis

        16.5.1. By Type

        16.5.2. By Application

        16.5.3. By Country

    16.6. Market Trends

    16.7. Drivers and Restraints Impact Analysis

17. Middle East and Africa Market Analysis 2017 to 2021 and Forecast 2022 to 2032

    17.1. Introduction

    17.2. Pricing Analysis

    17.3. Historical Market Size (US$ Billion ) and Volume Trend Analysis By Market Taxonomy, 2017 to 2021

    17.4. Market Size (US$ Billion ) and Volume Forecast By Market Taxonomy, 2022 to 2032

        17.4.1. By Type

        17.4.2. By Application

        17.4.3. By Country

            17.4.3.1. GCC Countries

            17.4.3.2. Turkey

            17.4.3.3. Northern Africa

            17.4.3.4. South Africa

            17.4.3.5. Rest of Middle East and Africa

    17.5. Market Attractiveness Analysis

        17.5.1. By Type

        17.5.2. By Application

        17.5.3. By Country

    17.6. Market Trends

    17.7. Drivers and Restraints Impact Analysis

18. Key and Emerging Countries Market Analysis 

    18.1. USA Market Analysis

        18.1.1. By Type

        18.1.2. By Application

    18.2. Canada Market Analysis

        18.2.1. By Type

        18.2.2. By Application

    18.3. Mexico Market Analysis

        18.3.1. By Type

        18.3.2. By Application

    18.4. Brazil Market Analysis

        18.4.1. By Type

        18.4.2. By Application

    18.5. Germany Market Analysis

        18.5.1. By Type

        18.5.2. By Application

    18.6. Italy Market Analysis

        18.6.1. By Type

        18.6.2. By Application

    18.7. France Market Analysis

        18.7.1. By Type

        18.7.2. By Application

    18.8. UK Market Analysis

        18.8.1. By Type

        18.8.2. By Application

    18.9. Spain Market Analysis

        18.9.1. By Type

        18.9.2. By Application

    18.10. Russia Market Analysis

        18.10.1. By Type

        18.10.2. By Application

    18.11. BENELUX Market Analysis

        18.11.1. By Type

        18.11.2. By Application

    18.12. China Market Analysis

        18.12.1. By Type

        18.12.2. By Application

    18.13. Japan Market Analysis

        18.13.1. By Type

        18.13.2. By Application

    18.14. S. Korea Market Analysis

        18.14.1. By Type

        18.14.2. By Application

    18.15. India Market Analysis

        18.15.1. By Type

        18.15.2. By Application

    18.16. ASEAN Market Analysis

        18.16.1. By Type

        18.16.2. By Application

    18.17. GCC Countries Market Analysis

        18.17.1. By Type

        18.17.2. By Application

    18.18. Turkey Market Analysis

        18.18.1. By Type

        18.18.2. By Application

    18.19. South Africa Market Analysis

        18.19.1. By Type

        18.19.2. By Application

19. Market Structure Analysis

    19.1. Market Analysis by Tier of Companies [Polymerization Initiators]

    19.2. Market Concentration

    19.3. Market Share Analysis of Top Players

    19.4. Production Capacity Estimates of Top Players

    19.5. Market Presence Analysis

20. Competition Analysis

    20.1. Competition Dashboard

    20.2. Primary Survey Analysis

    20.3. Competition Deep Dive

        20.3.1. Arkema

            20.3.1.1. Overview

            20.3.1.2. Product Portfolio

            20.3.1.3. Key Financials

            20.3.1.4. Sales Footprint

            20.3.1.5. Strategy Overview

        20.3.2. United Initiators

        20.3.3. LANXESS

        20.3.4. Nouryon

        20.3.5. Adeka Corporation

        20.3.6. Fujifilm Wako Pure Chemicals Corporation

        20.3.7. Akpa Kimya

        20.3.8. Negami Chemical Industrial Co. Ltd

        20.3.9. Otsuka Chemical Co. Ltd

        20.3.10. Chemorous

        20.3.11. PAT Impex India

        20.3.12. Capot Chemical Co Ltd

        20.3.13. Jinan Quinmu Fine Chemical

21. Assumptions and Acronyms Used

22. Research Methodology

Don't pay for what you don't need

Customize your report by selecting specific countries or regions and save 30%!

List of Tables

Table 01: Global Market Value (US$ Billion ) & Volume (Tons) by Type, 2017 to 2032

Table 02: Global Market Value (US$ Billion ) and Volume (Tons) Forecast by Application, 2017 to 2032

Table 03: Global Market Value (US$ Billion )  and Volume (Tons) Forecast by Region, 2017 to 2032

Table 04: North America Market Size (US$ Billion ) and Volume (Tons) Forecast by Country, 2017 to 2032

Table 05: North America Market Value (US$ Billion ) and Volume (Tons) Forecast by Type, 2017 to 2032

Table 06: North America Market Size (US$ Billion ) and Volume (Tons) Forecast by Application, 2017 to 2032

Table 07: Latin America Market Size (US$ Billion ) and Volume (Tons) Forecast by Country, 2017 to 2032

Table 08: Latin America Market Value (US$ Billion ) and Volume (Tons) Forecast by Type, 2017 to 2032

Table 09: Latin America Market Size (US$ Billion ) and Volume (Tons) Forecast by Application, 2017 to 2032

Table 10: Europe Market Size (US$ Billion ) and Volume (Tons) Forecast by Country, 2017 to 2032

Table 11: Europe Market Value (US$ Billion )  and Volume (Tons) Forecast by Type, 2017 to 2032

Table 12: Europe Market Size (US$ Billion ) and Volume (Tons) Forecast by Application, 2017 to 2032

Table 13: South Asia & Pacific Market Size (US$ Billion ) and Volume (Tons) Forecast by Country, 2017 to 2032

Table 14: South Asia & Pacific Market Value (US$ Billion )  and Volume (Tons) Forecast by Type, 2017 to 2032

Table 15: South Asia & Pacific Market Size (US$ Billion ) and Volume (Tons) Forecast by Application, 2017 to 2032

Table 16: East Asia Market Size (US$ Billion ) and Volume (Tons) Forecast by Country, 2017 to 2032

Table 17: East Asia Market Value (US$ Billion ) and Volume (Tons) Forecast by Type, 2017 to 2032

Table 18: East Asia Market Size (US$ Billion ) and Volume (Tons) Forecast by Application, 2017 to 2032

Table 19: Middle East & Africa Market Size (US$ Billion ) and Volume (Tons) Forecast by Country, 2017 to 2032

Table 20: Middle East & Africa Market Value (US$ Billion ) and Volume (Tons) Forecast by Type, 2017 to 2032

Table 21: Middle East & Africa Market Size (US$ Billion ) and Volume (Tons) Forecast by Application, 2017 to 2032
Nikhil Kaitwade
Nikhil Kaitwade

Principal Consultant

Talk to Analyst

Find your sweet spots for generating winning opportunities in this market.

List of Charts

Figure 01: Global Historical Market Volume (Tons) Analysis, 2017 to 2021

Figure 02: Global Current and Future Market Volume (Tons) Analysis, 2022 to 2032

Figure 03: Global Market Value (US$ Billion ), 2017 to 2021

Figure 04: Global Market Value (US$ Billion ) Forecast, 2022 to 2032

Figure 05: Global Market Absolute $ Opportunity, 2017 to 2022 and 2032

Figure 06: Global Market Share and BPS Analysis by Type - 2022 & 2032

Figure 07: Global Market Y-o-Y Growth Projections by Type, 2022 to 2032

Figure 08: Global Market Absolute $ Opportunity by Peroxide Segment

Figure 09: Global Market Absolute $ Opportunity by Persulfate Segment

Figure 10: Global Market Absolute $ Opportunity by Azo Compound Segment

Figure 11: Global Market Absolute $ Opportunity by Others Segment

Figure 12: Global Market Attractiveness Analysis by Type, 2022 to 2032

Figure 13: Global Market Share and BPS Analysis by Application - 2022 & 2032

Figure 14: Global Market Y-o-Y Growth Projections by Application, 2022 to 2032

Figure 15: Global Market Absolute $ Opportunity by Polyethylene Segment

Figure 16: Global Market Absolute $ Opportunity by Propylene Segment

Figure 17: Global Market Absolute $ Opportunity by PVC Segment

Figure 18: Global Market Absolute $ Opportunity by Polystyrene Segment

Figure 19: Global Market Absolute $ Opportunity by ABS Segment

Figure 20: Global Market Absolute $ Opportunity by Others Segment

Figure 21: Global Market Attractiveness Analysis by Application, 2022 to 2032

Figure 22: Global Market Share and BPS Analysis by Region- 2022 & 2032

Figure 23: Global Market Y-o-Y Growth Projections by Region, 2022 to 2032

Figure 24: Global Market Absolute $ Opportunity by North America Segment

Figure 25: Global Market Absolute $ Opportunity by Latin America Segment

Figure 26: Global Market Absolute $ Opportunity by Europe Segment

Figure 27: Global Market Absolute $ Opportunity by East Asia Segment

Figure 28: Global Market Absolute $ Opportunity by South Asia Pacific Segment

Figure 29: Global Market Absolute $ Opportunity by MEA Segment

Figure 30: Global Market Attractiveness Analysis by Region, 2022 to 2032

Figure 31: North America Market Share and BPS Analysis by Country- 2022 & 2032

Figure 32: North America Market Y-o-Y Growth Projections by Country, 2022 to 2032

Figure 33: North America Market Attractiveness Analysis by Country, 2022 to 2032

Figure 34: North America Market Share and BPS Analysis by Type- 2022 & 2032

Figure 35: North America Market Y-o-Y Growth Projections by Type, 2022 to 2032

Figure 36: North America Market Attractiveness Analysis by Type, 2022 to 2032

Figure 37: North America Market Share and BPS Analysis by Application- 2022 & 2032

Figure 38: North America Market Y-o-Y Growth Projections by Application, 2022 to 2032

Figure 39: North America Market Attractiveness Analysis by Application, 2022 to 2032

Figure 40: Latin America Market Share and BPS Analysis by Country- 2022 & 2032

Figure 41: Latin America Market Y-o-Y Growth Projections by Country, 2022 to 2032

Figure 42: Latin America Market Attractiveness Analysis by Country, 2022 to 2032

Figure 43: Latin America Market Share and BPS Analysis by Type- 2022 & 2032

Figure 44: Latin America Market Y-o-Y Growth Projections by Type, 2022 to 2032

Figure 45: Latin America Market Attractiveness Analysis by Type, 2022 to 2032

Figure 46: Latin America Market Share and BPS Analysis by Application- 2022 & 2032

Figure 47: Latin America Market Y-o-Y Growth Projections by Application, 2022 to 2032

Figure 48: Latin America Market Attractiveness Analysis by Application, 2022 to 2032

Figure 49: Europe Market Share and BPS Analysis by Country- 2022 & 2032

Figure 50: Europe Market Y-o-Y Growth Projections by Country, 2022 to 2032

Figure 51: Europe Market Attractiveness Analysis by Country, 2022 to 2032

Figure 52: Europe Market Share and BPS Analysis by Type- 2022 & 2032

Figure 53: Europe Market Y-o-Y Growth Projections by Type, 2022 to 2032

Figure 54: Europe Market Attractiveness Analysis by Type, 2022 to 2032

Figure 55: Europe Market Share and BPS Analysis by Application- 2022 & 2032

Figure 56: Europe Market Y-o-Y Growth Projections by Application, 2022 to 2032

Figure 57: Europe Market Attractiveness Analysis by Application, 2022 to 2032

Figure 58: South Asia & Pacific Market Share and BPS Analysis by Country- 2022 & 2032

Figure 59: South Asia & Pacific Market Y-o-Y Growth Projections by Country, 2022 to 2032

Figure 60: South Asia & Pacific Market Attractiveness Analysis by Country, 2022 to 2032

Figure 61: South Asia & Pacific Market Share and BPS Analysis by Type- 2022 & 2032

Figure 62: South Asia & Pacific Market Y-o-Y Growth Projections by Type, 2022 to 2032

Figure 63: South Asia & Pacific Market Attractiveness Analysis by Type, 2022 to 2032

Figure 64: South Asia & Pacific Market Share and BPS Analysis by Application- 2022 & 2032

Figure 65: South Asia & Pacific Market Y-o-Y Growth Projections by Application, 2022 to 2032

Figure 66: South Asia & Pacific Market Attractiveness Analysis by Application, 2022 to 2032

Figure 67: East Asia Market Share and BPS Analysis by Country- 2022 & 2032

Figure 68: East Asia Market Y-o-Y Growth Projections by Country, 2022 to 2032

Figure 69: East Asia Market Attractiveness Analysis by Country, 2022 to 2032

Figure 70: East Asia Market Share and BPS Analysis by Type- 2022 & 2032

Figure 71: East Asia Market Y-o-Y Growth Projections by Type, 2022 to 2032

Figure 72: East Asia Market Attractiveness Analysis by Type, 2022 to 2032

Figure 73: East Asia Market Share and BPS Analysis by Application- 2022 & 2032

Figure 74: East Asia Market Y-o-Y Growth Projections by Application, 2022 to 2032

Figure 75: East Asia Market Attractiveness Analysis by Application, 2022 to 2032

Figure 76: Middle East & Africa Market Share and BPS Analysis by Country- 2022 & 2032

Figure 77: Middle East & Africa Market Y-o-Y Growth Projections by Country, 2022 to 2032

Figure 78: Middle East & Africa a Market Attractiveness Analysis by Country, 2022 to 2032

Figure 79: Middle East & Africa Market Share and BPS Analysis by Type- 2022 & 2032

Figure 80: Middle East & Africa Market Y-o-Y Growth Projections by Type, 2022 to 2032

Figure 81: Middle East & Africa Market Attractiveness Analysis by Type, 2022 to 2032

Figure 82: Middle East & Africa Market Share and BPS Analysis by Application- 2022 & 2032

Figure 83: Middle East & Africa Market Y-o-Y Growth Projections by Application, 2022 to 2032

Figure 84: Middle East & Africa Market Attractiveness Analysis by Application, 2022 to 2032

Recommendations

Chemicals & Materials

Super Absorbent Polymer Market

Published : April 2024

Chemicals & Materials

Fluoropolymer Market

Published : May 2023

Chemicals & Materials

Polymer Fillers Market

Published : May 2023

Explore Chemicals & Materials Insights

View Reports

Polymerization Initiators Market