Pupillometer Market Outlook (2023 to 2033)

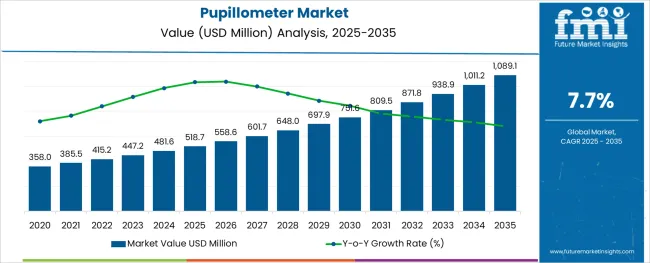
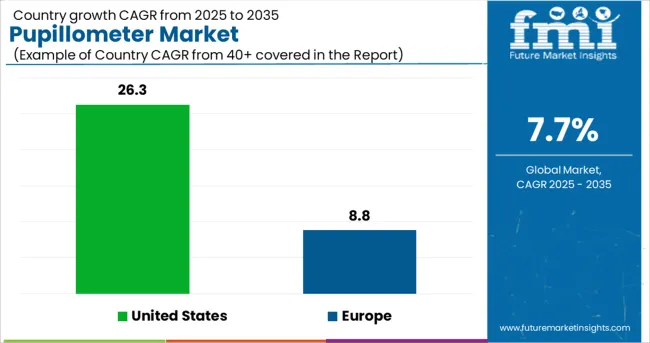
[333 Pages Report] The global pupillometer market is projected to have a moderate-paced CAGR of 7.7% during the forecast period. The current valuation of the pupillometer market is US$ 385.56 Million in 2023. The value of the pupillometer market is anticipated to reach a high of US$ 809.56 Million by the year 2033.

This growth in the sales of pupillometer is supported by the following:

  • There has been a dramatic rise in the incidence of neurological diseases.
  • Owing to technological progress, a new generation of pupillometers and medical devices is emerging.
  • Enhance the effectiveness of the diagnosis
  • Help doctors better identify brain disorders
Attribute Details
Market Value (2023) US$ 385.56 Million
Market Value (2033) US$ 809.56 Million
CAGR 7.7%

Don't pay for what you don't need

Customize your report by selecting specific countries or regions and save 30%!

Substantial Expansion of the Video Pupillometer Market Is Predicted for the Future

When comparing digital and video pupillometers, the latter is clearly superior. To give just one example, these tools can record the full range of pupillary responses. In addition, video pupillometers like Konan Medical USA Inc.'s EyeKinetix pupillometer use infrared high-definition video cameras to record the bilateral pupil responses to monocular visual stimuli.

Additionally, EyeKinetix captures both spontaneous and evoked pupillary light reactions at the same time. Another element contributing to increased interest in video automated pupillometer is their recent regulatory clearance. So, in July 2021, NeurOptics Inc. introduced the NPi-300 Pupillometer to consumers in the United States. The NPI-300 Pupillometer also contains cutting-edge technologies like an LED light source, a high-precision infrared camera, and a powerful microprocessor. As a result, the market expands as a result of the increased demand brought about by these features.

In addition, video pupillometers like the NPi-300 are faster and more convenient than digital pupillometers. Therefore, automatic pupillometers eliminate the potential for human error that might occur with manual approaches. Consequently, this causes an increase in demand for video pupillometers, which in turn propels the development of the market. Therefore, because of these benefits, these devices are widely used in clinical practice.

Key Drivers for the Pupillometer Market

The pupillometer market is expanding as a result of the widespread use of computers and the Internet in the creation of brand-new goods. For instance, in 2017, Essilor Instruments USA introduced the X81705 Pupillometer medical device, which combines precise measurement with user-friendly controls. Binocular and monocular measures, as well as the X81705's infinite vision distance setting, are both fully manually adjustable. The X81705 also has an automatic off/on functionality and digital readouts that can measure down to 0.5 nm.

The automated pupillometer market is expanding as more people seek alternatives to the traditional method of pupil measurement due to safety concerns. As an example, a 2016 study published in the American Journal of Critical Care found that neurological nurses and critical care consistently underestimated pupil size and incorrectly measured pupil reactivity, leading the authors to conclude that the use of an automated pupillometer medical device is an essential tool allowing for more effective and timely diagnostics.

The rising global incidence of eye problems is also fuelling demand for pupillometers. The number of people with moderate or severe visual impairment is projected to increase to nearly 588 million by 2050 from the current estimate of 217 million, according to 2017 research by the International Council of Ophthalmology.

The demand for pupillometers is expanding because of the rise in ophthalmic-related illnesses caused by prolonged use of digital electronics such as TVs, smartphones & tablets, laptops, video games, and PCs. While demand for pupilometers continues to rise, the market expansion is being stymied by a dearth of trained personnel to operate cutting-edge devices.
Sabyasachi Ghosh
Sabyasachi Ghosh

Principal Consultant

Talk to Analyst

Find your sweet spots for generating winning opportunities in this market.

Comparative Analysis of Adjacent Markets

Pupillometer Market:

Differentiating Aspects Pupillometer Market
CAGR 7.7%
Market Valuation in 2023 US$ 385.56 Million
Projected Market Value in 2033 US$ 809.56 Million
Drivers
  • New automated pupillometers are becoming on the market as a result of technical development.
  • Improve the accuracy of medical diagnoses
  • Aid medical professionals in making accurate diagnoses of brain illnesses.

Ureteral Stents Market:

Differentiating Aspects Ureteral Stents Market
CAGR 5.6%
Market Valuation in 2023 US$ 498.2 Million
Projected Market Value in 2033 US$ 907.21 Million
Drivers
  • The Incidence of renal illness is rising.
  • Regulatory bodies are giving out more green lights for products.

Surgical Microscopes Market:

Differentiating Aspects Surgical Microscopes Market
CAGR 9.7%
Market Valuation in 2023 US$ 1,096.8 Million
Projected Market Value in 2033 US$ 2,301.6 Million
Drivers
  • Product approvals and introductions for surgical microscopes are on the rise.
  • Boosting efforts in the realm of research and development

Category-wise Insights

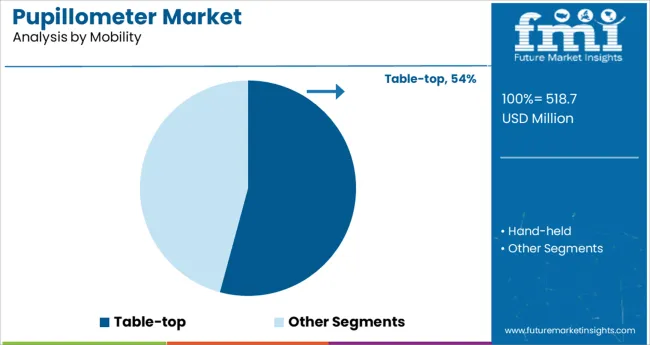
  • In terms of revenue, the category comprising tabletop pupillometers medical devices was the most lucrative in the world in 2021, accounting for 54.4% of the total. Many pupillometers are sold in bundles with other diagnostic tools, like keratometers, pachymeters, wavefront aberrometer, corneal topographers, and others. These combined pupillometers are commonly found in healthcare settings, albeit they are more commonly used with desktop models.
  • The portable pupillometer market is anticipated to develop at the highest rate throughout the forecast time frame. In order to aid in the diagnosis of neurological disorders like Alzheimer's, a portable pupillometer can be used to quickly and precisely capture an image of the pupil. In addition, the hand-held pupillometer's convenience has contributed to its widespread use. When it comes to portable pupillometers, NeurOptics is a frontrunner in the industry for both critical care and research applications.
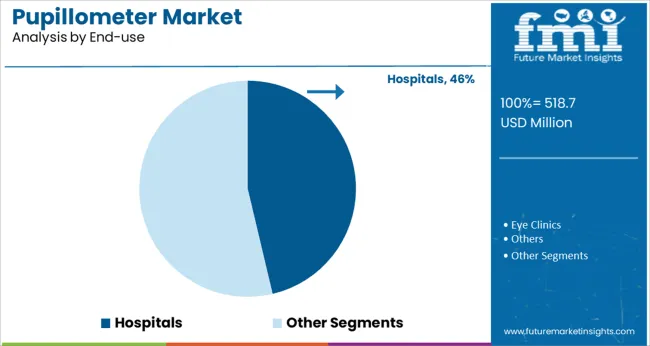
  • Since pupillometers are increasingly being used in hospitals, this application accounted for 49.7% of total revenue in 2021. Four hundred hospitals in the United States have embraced NeurOptics' pupillometer, which has helped the pupillometer market expand. Pupillometers' expanding role in specialized healthcare settings like intensive care units is also anticipated to boost demand in this area. Neurocritical care, medical ICU, ED, and cardiac ICU are just some of the settings where you can find a NeurOptics pupillometer in use.

Get the data you need at a Fraction of the cost

Personalize your report by choosing insights you need
and save 40%!

Regional Insights

United States

Market Share (2033) 26.3%

The US market is expected to hold a market share of 26.3% of the global market.

In 2021, North America accounted for over 26.3% of global revenue, thanks to the region's large population and high incidence of neurological and eye illnesses. Pupillometry's widespread applicability in the United States is another factor that should boost sales.

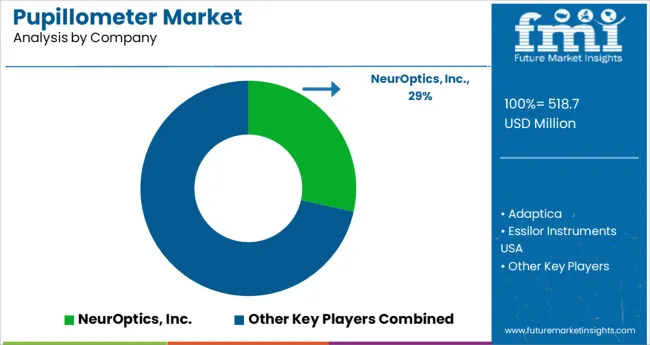
The United States is home to several market leaders, including NeurOptics, a company that designs and manufactures state-of-the-art pupillometers to improve medical diagnostics. The company is also investigating the application of pupillometers across a range of critical care settings to broaden the scope of its products.

Europe

Market Growth Rate (2023 to 2033) 8.8%

An 8.8 percent compound annual growth rate (CAGR) is predicted for the Europe Pupillometer Market between 2023 and 2033.

As their use in neuropsychological testing becomes increasingly commonplace, pupillometers are enjoying brisk sales growth around the world. When compared to more conventional approaches, the price of the next-generation pupillometer is higher. Despite the advantages of medical devices, their adoption rate has not changed significantly in industrialized economies.

With the rising prevalence of neurological illnesses, the pupillometer is finding more and more uses. Furthermore, technical development has led to the creation of a pupillometer for the next generation, which is more advanced than the medical devices of the past.

Japan

The forecast calls for the fastest growth in Japan for the Asia Pacific region. Pupillometers are becoming more widely available in the region owing to an increase in the number of online retailers and distributors offering them. Pupillometers are also being offered by the regional branches of multinational corporations like NeurOptics, Johnson & Johnson Vision, and Konan Medical.

NeurOptics' pupillometer is available in India through Hansraj Nayyar Medical India, in Japan from IMI Co., and in South Korea from Neuroplus. The introduction of major corporations like NIDEK has boosted the automated pupillometer's accessibility and popularity in the region.

India

Pupillometry is a growing industry for many reasons, including the prevalence of neurological illnesses. According to The Lancet Global Health Report 2021, for instance, an aging population is a major contributor to the rising incidence of non-communicable neurological illnesses in India. Major causes of disability from neurological disorders in India include stroke, headache problems, and epilepsy. Since automated pupillometers are used to measure eye curvature, which can indicate neurological abnormalities, this drives up demand for the devices. Over the next few years, the market in question is likely to expand, thanks to the rising prevalence of neurological illnesses.

Startup Ecosystem

New Entrants to Foster Innovation in the Global Market

The startups in the pupillometer market are adding a new edge to the properties of excavators by curating innovations beyond the imagination. They are continually upgrading the pupillometer with advanced technology, and manufacturers and sellers are continuously attempting to reduce costs for greater accessibility to the market share. Startup firms are triggering the expansion of the pupillometer market with their unique attempts.

The top startups operating in the market are:

Name Mind’s Eye
Date of Establishment 2016
Description When it comes to pupillometry biomarkers for ADHD, Mind'sEye Diagnostics has you covered. The platform relies on our novel scientific biomarkers, which include the use of a mobile phone camera to extract eye parameters, the execution of unique image analysis, and the deployment of a proprietary analysis algorithm, all of which allow for the identification of ADHD and other mental disorders. There's also a smartphone app that keeps tabs on how a patient's ADHD symptoms change throughout the day, allowing for more precise dosing and better overall management of the condition.
Name EYE-COG
Mind’s Eye 2016
Description EYE-main COG's goal is to aid in the identification of ADHD and other mental problems using pupillometry biomarkers. It has developed a platform that includes an Eye tracker, a short, computerized attention test, a personal questionnaire, and a cloud-based algorithm that analyses eye markers taken from the eye tracker data and automatically sends a full report to EYE-COG software which can be used for the accurate diagnosis of ADHD. Single ADHD analysis tests can be purchased for $30 each, and the kit can be purchased for $1500.

Competitive Landscape

There are several international and domestic players in the pupillometer industry, making for a competitive marketplace. NeurOptics Inc., Essilor Group (Essilor Instruments), Visionix, US Ophthalmic., NIDEK SA, HAAG-STREIT GROUP, Reichert Inc., Konan Medical USA Inc., Good-Lite Company, Grobet USA are among the top players in the market (Vigor Optical).

In order to maintain their market share and expand their product offerings, many companies are implementing market strategies like the introduction of new, ground-breaking items as well as mergers, collaborations, and acquisitions.

Some of the recent developments in the pupillometer market include the following:

NeurOptics Inc. introduced the NPi-300 pupillometer in 15 countries in May of 2022. The United Kingdom, France, Italy, Germany, Switzerland, Austria, Norway, Sweden, Denmark, Belgium, the Netherlands, Luxembourg, Ireland, Australia, and New Zealand were among the first to introduce the pupillometer.

The VERITAS Vision System, a next-generation phacoemulsification program (phaco) designed to address three critical areas of patient safety, performance during surgery, and comfort, became globally available on July 23, 2021, thanks to Johnson & Johnson Vision, a global leader in eye health and part of Johnson & Johnson Medical Devices Companies. This weekend at the 2021 American Society of Cataract and Refractive Surgery (ASCRS) and American Society of Ophthalmic Administrators (ASOA) Meeting, the business is expected to provide live demonstrations of the innovative system in the wetland area of Johnson & Johnson.

In the United States, NeurOptics Inc. released the NPi-300 Pupillometer in July 2021. The NPI-300 is an automated pupillometer for use in neurological testing. It is also utilized to detect neurological disorders in both young and old individuals, including stroke, TBI, seizures, and other neurological events.

Key Segments in the Pupillometer Market

By Mobility:

  • Table-top
  • Hand-held

By Type:

  • Video
  • Digital

By End-use:

  • Hospitals
  • Eye Clinics
  • Others

By Application:

  • Ophthalmology
  • Neurology
  • Oncology
  • Others

By Region:

  • North America
  • Latin America
  • Asia Pacific
  • Middle East & Africa (MEA)
  • Europe

Frequently Asked Questions

What is the Growth Outlook for the Pupillometer Market?

The growth outlook for the Pupillometer market is predicted to advance at a CAGR of 7.7% from 2022-to 2032.

Which Region Leads the Pupillometer Market?

The North American region is anticipated to lead the Pupillometer market during the forecast period.

What is the market valuation of Pupillometer in 2022?

The market valuation of the Pupillometer market stands at US$ 385.56 Mn Mn in 2023.

How much Growth Potential does Pupillometer hold?

The Pupillometer market is likely to hold a valuation of U US$ 809.56 Mn by 2033.

Which sector is the key driver in the Pupillometer Market?

The kitchen appliances sector is the key driver in the Pupillometer market.

Table of Content
1. Executive Summary | Pupillometer Market

    1.1. Global Market Outlook

    1.2. Demand-side Trends

    1.3. Supply-side Trends

    1.4. Technology Roadmap Analysis

    1.5. Analysis and Recommendations

2. Market Overview

    2.1. Market Coverage / Taxonomy

    2.2. Market Definition / Scope / Limitations

3. Market Background

    3.1. Market Dynamics

        3.1.1. Drivers

        3.1.2. Restraints

        3.1.3. Opportunity

        3.1.4. Trends

    3.2. Scenario Forecast

        3.2.1. Demand in Optimistic Scenario

        3.2.2. Demand in Likely Scenario

        3.2.3. Demand in Conservative Scenario

    3.3. Opportunity Map Analysis

    3.4. Investment Feasibility Matrix

    3.5. PESTLE and Porter’s Analysis

    3.6. Regulatory Landscape

        3.6.1. By Key Regions

        3.6.2. By Key Countries

    3.7. Regional Parent Market Outlook

4. Global Market Analysis 2017 to 2021 and Forecast, 2022 to 2032

    4.1. Historical Market Size Value (US$ Million) Analysis, 2017 to 2021

    4.2. Current and Future Market Size Value (US$ Million) Projections, 2022 to 2032

        4.2.1. Y-o-Y Growth Trend Analysis

        4.2.2. Absolute $ Opportunity Analysis

5. Global Market Analysis 2017 to 2021 and Forecast 2022 to 2032, By Mobility

    5.1. Introduction / Key Findings

    5.2. Historical Market Size Value (US$ Million) Analysis By Mobility, 2017 to 2021

    5.3. Current and Future Market Size Value (US$ Million) Analysis and Forecast By Mobility, 2022 to 2032

        5.3.1. Table-top

        5.3.2. Hand-held

    5.4. Y-o-Y Growth Trend Analysis By Mobility, 2017 to 2021

    5.5. Absolute $ Opportunity Analysis By Mobility, 2022 to 2032

6. Global Market Analysis 2017 to 2021 and Forecast 2022 to 2032, By Type

    6.1. Introduction / Key Findings

    6.2. Historical Market Size Value (US$ Million) Analysis By Type, 2017 to 2021

    6.3. Current and Future Market Size Value (US$ Million) Analysis and Forecast By Type, 2022 to 2032

        6.3.1. Video

        6.3.2. Digital

    6.4. Y-o-Y Growth Trend Analysis By Type, 2017 to 2021

    6.5. Absolute $ Opportunity Analysis By Type, 2022 to 2032

7. Global Market Analysis 2017 to 2021 and Forecast 2022 to 2032, By End-Use

    7.1. Introduction / Key Findings

    7.2. Historical Market Size Value (US$ Million) Analysis By End-Use, 2017 to 2021

    7.3. Current and Future Market Size Value (US$ Million) Analysis and Forecast By End-Use, 2022 to 2032

        7.3.1. Hospitals

        7.3.2. Eye Clinics

        7.3.3. Others

    7.4. Y-o-Y Growth Trend Analysis By End-Use, 2017 to 2021

    7.5. Absolute $ Opportunity Analysis By End-Use, 2022 to 2032

8. Global Market Analysis 2017 to 2021 and Forecast 2022 to 2032, By Application

    8.1. Introduction / Key Findings

    8.2. Historical Market Size Value (US$ Million) Analysis By Application, 2017 to 2021

    8.3. Current and Future Market Size Value (US$ Million) Analysis and Forecast By Application, 2022 to 2032

        8.3.1. Ophthalmology

        8.3.2. Neurology

        8.3.3. Oncology

        8.3.4. Others

    8.4. Y-o-Y Growth Trend Analysis By Application, 2017 to 2021

    8.5. Absolute $ Opportunity Analysis By Application, 2022 to 2032

9. Global Market Analysis 2017 to 2021 and Forecast 2022 to 2032, By Region

    9.1. Introduction

    9.2. Historical Market Size Value (US$ Million) Analysis By Region, 2017 to 2021

    9.3. Current Market Size Value (US$ Million) Analysis and Forecast By Region, 2022 to 2032

        9.3.1. North America

        9.3.2. Latin America

        9.3.3. Europe

        9.3.4. South Asia

        9.3.5. East Asia

        9.3.6. Oceania

        9.3.7. MEA

    9.4. Market Attractiveness Analysis By Region

10. North America Market Analysis 2017 to 2021 and Forecast 2022 to 2032, By Country

    10.1. Historical Market Size Value (US$ Million) Trend Analysis By Market Taxonomy, 2017 to 2021

    10.2. Market Size Value (US$ Million) Forecast By Market Taxonomy, 2022 to 2032

        10.2.1. By Country

            10.2.1.1. The US

            10.2.1.2. Canada

        10.2.2. By Mobility

        10.2.3. By Type

        10.2.4. By End-Use

        10.2.5. By Application

    10.3. Market Attractiveness Analysis

        10.3.1. By Country

        10.3.2. By Mobility

        10.3.3. By Type

        10.3.4. By End-Use

        10.3.5. By Application

    10.4. Key Takeaways

11. Latin America Market Analysis 2017 to 2021 and Forecast 2022 to 2032, By Country

    11.1. Historical Market Size Value (US$ Million) Trend Analysis By Market Taxonomy, 2017 to 2021

    11.2. Market Size Value (US$ Million) Forecast By Market Taxonomy, 2022 to 2032

        11.2.1. By Country

            11.2.1.1. Brazil

            11.2.1.2. Mexico

            11.2.1.3. Rest of Latin America

        11.2.2. By Mobility

        11.2.3. By Type

        11.2.4. By End-Use

        11.2.5. By Application

    11.3. Market Attractiveness Analysis

        11.3.1. By Country

        11.3.2. By Mobility

        11.3.3. By Type

        11.3.4. By End-Use

        11.3.5. By Application

    11.4. Key Takeaways

12. Europe Market Analysis 2017 to 2021 and Forecast 2022 to 2032, By Country

    12.1. Historical Market Size Value (US$ Million) Trend Analysis By Market Taxonomy, 2017 to 2021

    12.2. Market Size Value (US$ Million) Forecast By Market Taxonomy, 2022 to 2032

        12.2.1. By Country

            12.2.1.1. Germany

            12.2.1.2. The UK

            12.2.1.3. France

            12.2.1.4. Spain

            12.2.1.5. Italy

            12.2.1.6. Rest of Europe

        12.2.2. By Mobility

        12.2.3. By Type

        12.2.4. By End-Use

        12.2.5. By Application

    12.3. Market Attractiveness Analysis

        12.3.1. By Country

        12.3.2. By Mobility

        12.3.3. By Type

        12.3.4. By End-Use

        12.3.5. By Application

    12.4. Key Takeaways

13. South Asia Market Analysis 2017 to 2021 and Forecast 2022 to 2032, By Country

    13.1. Historical Market Size Value (US$ Million) Trend Analysis By Market Taxonomy, 2017 to 2021

    13.2. Market Size Value (US$ Million) Forecast By Market Taxonomy, 2022 to 2032

        13.2.1. By Country

            13.2.1.1. India

            13.2.1.2. Malaysia

            13.2.1.3. Singapore

            13.2.1.4. Thailand

            13.2.1.5. Rest of South Asia

        13.2.2. By Mobility

        13.2.3. By Type

        13.2.4. By End-Use

        13.2.5. By Application

    13.3. Market Attractiveness Analysis

        13.3.1. By Country

        13.3.2. By Mobility

        13.3.3. By Type

        13.3.4. By End-Use

        13.3.5. By Application

    13.4. Key Takeaways

14. East Asia Market Analysis 2017 to 2021 and Forecast 2022 to 2032, By Country

    14.1. Historical Market Size Value (US$ Million) Trend Analysis By Market Taxonomy, 2017 to 2021

    14.2. Market Size Value (US$ Million) Forecast By Market Taxonomy, 2022 to 2032

        14.2.1. By Country

            14.2.1.1. China

            14.2.1.2. Japan

            14.2.1.3. South Korea

        14.2.2. By Mobility

        14.2.3. By Type

        14.2.4. By End-Use

        14.2.5. By Application

    14.3. Market Attractiveness Analysis

        14.3.1. By Country

        14.3.2. By Mobility

        14.3.3. By Type

        14.3.4. By End-Use

        14.3.5. By Application

    14.4. Key Takeaways

15. Oceania Market Analysis 2017 to 2021 and Forecast 2022 to 2032, By Country

    15.1. Historical Market Size Value (US$ Million) Trend Analysis By Market Taxonomy, 2017 to 2021

    15.2. Market Size Value (US$ Million) Forecast By Market Taxonomy, 2022 to 2032

        15.2.1. By Country

            15.2.1.1. Australia

            15.2.1.2. New Zealand

        15.2.2. By Mobility

        15.2.3. By Type

        15.2.4. By End-Use

        15.2.5. By Application

    15.3. Market Attractiveness Analysis

        15.3.1. By Country

        15.3.2. By Mobility

        15.3.3. By Type

        15.3.4. By End-Use

        15.3.5. By Application

    15.4. Key Takeaways

16. MEA Market Analysis 2017 to 2021 and Forecast 2022 to 2032, By Country

    16.1. Historical Market Size Value (US$ Million) Trend Analysis By Market Taxonomy, 2017 to 2021

    16.2. Market Size Value (US$ Million) Forecast By Market Taxonomy, 2022 to 2032

        16.2.1. By Country

            16.2.1.1. GCC Countries

            16.2.1.2. South Africa

            16.2.1.3. Israel

            16.2.1.4. Rest of MEA

        16.2.2. By Mobility

        16.2.3. By Type

        16.2.4. By End-Use

        16.2.5. By Application

    16.3. Market Attractiveness Analysis

        16.3.1. By Country

        16.3.2. By Mobility

        16.3.3. By Type

        16.3.4. By End-Use

        16.3.5. By Application

    16.4. Key Takeaways

17. Key Countries Market Analysis

    17.1. The US

        17.1.1. Pricing Analysis

        17.1.2. Market Share Analysis, 2021

            17.1.2.1. By Mobility

            17.1.2.2. By Type

            17.1.2.3. By End-Use

            17.1.2.4. By Application

    17.2. Canada

        17.2.1. Pricing Analysis

        17.2.2. Market Share Analysis, 2021

            17.2.2.1. By Mobility

            17.2.2.2. By Type

            17.2.2.3. By End-Use

            17.2.2.4. By Application

    17.3. Brazil

        17.3.1. Pricing Analysis

        17.3.2. Market Share Analysis, 2021

            17.3.2.1. By Mobility

            17.3.2.2. By Type

            17.3.2.3. By End-Use

            17.3.2.4. By Application

    17.4. Mexico

        17.4.1. Pricing Analysis

        17.4.2. Market Share Analysis, 2021

            17.4.2.1. By Mobility

            17.4.2.2. By Type

            17.4.2.3. By End-Use

            17.4.2.4. By Application

    17.5. Germany

        17.5.1. Pricing Analysis

        17.5.2. Market Share Analysis, 2021

            17.5.2.1. By Mobility

            17.5.2.2. By Type

            17.5.2.3. By End-Use

            17.5.2.4. By Application

    17.6. The UK

        17.6.1. Pricing Analysis

        17.6.2. Market Share Analysis, 2021

            17.6.2.1. By Mobility

            17.6.2.2. By Type

            17.6.2.3. By End-Use

            17.6.2.4. By Application

    17.7. France

        17.7.1. Pricing Analysis

        17.7.2. Market Share Analysis, 2021

            17.7.2.1. By Mobility

            17.7.2.2. By Type

            17.7.2.3. By End-Use

            17.7.2.4. By Application

    17.8. Spain

        17.8.1. Pricing Analysis

        17.8.2. Market Share Analysis, 2021

            17.8.2.1. By Mobility

            17.8.2.2. By Type

            17.8.2.3. By End-Use

            17.8.2.4. By Application

    17.9. Italy

        17.9.1. Pricing Analysis

        17.9.2. Market Share Analysis, 2021

            17.9.2.1. By Mobility

            17.9.2.2. By Type

            17.9.2.3. By End-Use

            17.9.2.4. By Application

    17.10. India

        17.10.1. Pricing Analysis

        17.10.2. Market Share Analysis, 2021

            17.10.2.1. By Mobility

            17.10.2.2. By Type

            17.10.2.3. By End-Use

            17.10.2.4. By Application

    17.11. Malaysia

        17.11.1. Pricing Analysis

        17.11.2. Market Share Analysis, 2021

            17.11.2.1. By Mobility

            17.11.2.2. By Type

            17.11.2.3. By End-Use

            17.11.2.4. By Application

    17.12. Singapore

        17.12.1. Pricing Analysis

        17.12.2. Market Share Analysis, 2021

            17.12.2.1. By Mobility

            17.12.2.2. By Type

            17.12.2.3. By End-Use

            17.12.2.4. By Application

    17.13. Thailand

        17.13.1. Pricing Analysis

        17.13.2. Market Share Analysis, 2021

            17.13.2.1. By Mobility

            17.13.2.2. By Type

            17.13.2.3. By End-Use

            17.13.2.4. By Application

    17.14. China

        17.14.1. Pricing Analysis

        17.14.2. Market Share Analysis, 2021

            17.14.2.1. By Mobility

            17.14.2.2. By Type

            17.14.2.3. By End-Use

            17.14.2.4. By Application

    17.15. Japan

        17.15.1. Pricing Analysis

        17.15.2. Market Share Analysis, 2021

            17.15.2.1. By Mobility

            17.15.2.2. By Type

            17.15.2.3. By End-Use

            17.15.2.4. By Application

    17.16. South Korea

        17.16.1. Pricing Analysis

        17.16.2. Market Share Analysis, 2021

            17.16.2.1. By Mobility

            17.16.2.2. By Type

            17.16.2.3. By End-Use

            17.16.2.4. By Application

    17.17. Australia

        17.17.1. Pricing Analysis

        17.17.2. Market Share Analysis, 2021

            17.17.2.1. By Mobility

            17.17.2.2. By Type

            17.17.2.3. By End-Use

            17.17.2.4. By Application

    17.18. New Zealand

        17.18.1. Pricing Analysis

        17.18.2. Market Share Analysis, 2021

            17.18.2.1. By Mobility

            17.18.2.2. By Type

            17.18.2.3. By End-Use

            17.18.2.4. By Application

    17.19. GCC Countries

        17.19.1. Pricing Analysis

        17.19.2. Market Share Analysis, 2021

            17.19.2.1. By Mobility

            17.19.2.2. By Type

            17.19.2.3. By End-Use

            17.19.2.4. By Application

    17.20. South Africa

        17.20.1. Pricing Analysis

        17.20.2. Market Share Analysis, 2021

            17.20.2.1. By Mobility

            17.20.2.2. By Type

            17.20.2.3. By End-Use

            17.20.2.4. By Application

    17.21. Israel

        17.21.1. Pricing Analysis

        17.21.2. Market Share Analysis, 2021

            17.21.2.1. By Mobility

            17.21.2.2. By Type

            17.21.2.3. By End-Use

            17.21.2.4. By Application

18. Market Structure Analysis

    18.1. Competition Dashboard

    18.2. Competition Benchmarking

    18.3. Market Share Analysis of Top Players

        18.3.1. By Regional

        18.3.2. By Mobility

        18.3.3. By Type

        18.3.4. By End-Use

        18.3.5. By Application

19. Competition Analysis

    19.1. Competition Deep Dive

        19.1.1. NeurOptics, Inc.

            19.1.1.1. Overview

            19.1.1.2. Product Portfolio

            19.1.1.3. Profitability by Market Segments

            19.1.1.4. Sales Footprint

            19.1.1.5. Strategy Overview

                19.1.1.5.1. Marketing Strategy

        19.1.2. Adaptica

            19.1.2.1. Overview

            19.1.2.2. Product Portfolio

            19.1.2.3. Profitability by Market Segments

            19.1.2.4. Sales Footprint

            19.1.2.5. Strategy Overview

                19.1.2.5.1. Marketing Strategy

        19.1.3. Essilor Instruments USA

            19.1.3.1. Overview

            19.1.3.2. Product Portfolio

            19.1.3.3. Profitability by Market Segments

            19.1.3.4. Sales Footprint

            19.1.3.5. Strategy Overview

                19.1.3.5.1. Marketing Strategy

        19.1.4. HAAG-STREIT GROUP

            19.1.4.1. Overview

            19.1.4.2. Product Portfolio

            19.1.4.3. Profitability by Market Segments

            19.1.4.4. Sales Footprint

            19.1.4.5. Strategy Overview

                19.1.4.5.1. Marketing Strategy

        19.1.5. Johnson & Johnson Vision

            19.1.5.1. Overview

            19.1.5.2. Product Portfolio

            19.1.5.3. Profitability by Market Segments

            19.1.5.4. Sales Footprint

            19.1.5.5. Strategy Overview

                19.1.5.5.1. Marketing Strategy

        19.1.6. Luneau Technology Group

            19.1.6.1. Overview

            19.1.6.2. Product Portfolio

            19.1.6.3. Profitability by Market Segments

            19.1.6.4. Sales Footprint

            19.1.6.5. Strategy Overview

                19.1.6.5.1. Marketing Strategy

        19.1.7. NIDEK CO., LTD.

            19.1.7.1. Overview

            19.1.7.2. Product Portfolio

            19.1.7.3. Profitability by Market Segments

            19.1.7.4. Sales Footprint

            19.1.7.5. Strategy Overview

                19.1.7.5.1. Marketing Strategy

        19.1.8. Reichert Technologies

            19.1.8.1. Overview

            19.1.8.2. Product Portfolio

            19.1.8.3. Profitability by Market Segments

            19.1.8.4. Sales Footprint

            19.1.8.5. Strategy Overview

                19.1.8.5.1. Marketing Strategy

        19.1.9. SCHWIND eye-tech-solutions

            19.1.9.1. Overview

            19.1.9.2. Product Portfolio

            19.1.9.3. Profitability by Market Segments

            19.1.9.4. Sales Footprint

            19.1.9.5. Strategy Overview

                19.1.9.5.1. Marketing Strategy

        19.1.10. US Ophthalmic

            19.1.10.1. Overview

            19.1.10.2. Product Portfolio

            19.1.10.3. Profitability by Market Segments

            19.1.10.4. Sales Footprint

            19.1.10.5. Strategy Overview

                19.1.10.5.1. Marketing Strategy

        19.1.11. Konan Medical

            19.1.11.1. Overview

            19.1.11.2. Product Portfolio

            19.1.11.3. Profitability by Market Segments

            19.1.11.4. Sales Footprint

            19.1.11.5. Strategy Overview

                19.1.11.5.1. Marketing Strategy

        19.1.12. bright lamp, Inc.

            19.1.12.1. Overview

            19.1.12.2. Product Portfolio

            19.1.12.3. Profitability by Market Segments

            19.1.12.4. Sales Footprint

            19.1.12.5. Strategy Overview

                19.1.12.5.1. Marketing Strategy

20. Assumptions & Acronyms Used

21. Research Methodology
Recommendations

Technology

Eye Tracking System Market

January 2022

REP-GB-2010

April 2024

301 pages

Healthcare

Eye Infections Treatment Market

February 2022

REP-GB-1300

July 2022

256 pages

Explore Healthcare Insights

View Reports