Reports

- Global Locations -

Headquarters

Future Market Insights, Inc.

Christiana Corporate, 200
Continental Drive, Suite 401,
Newark, Delaware - 19713,
United States

T: +1-845-579-5705

Americas

Future Market Insights, Inc.

616 Corporate Way, Suite 2-9018,
Valley Cottage, NY 10989, United States

T: +1-347-918-3531

MEA

Future Market Insights

1602-6 Jumeirah Bay X2 Tower, Plot No: JLT-PH2-X2A,
Jumeirah Lakes Towers, Dubai,
United Arab Emirates

Europe

Future Market Insights

3rd Floor, 207 Regent Street,
W1B 3HH London
United Kingdom

T: + 44 (0) 20 8123 9659
D: +44 (0) 20 3287 4268

Asia Pacific

Future Market Insights

IndiaLand Global Tech Park, Unit UG-1, Behind Grand HighStreet, Phase 1, Hinjawadi, MH, Pune – 411057, India

Global Railroad Market Outlook for 2024 to 2034

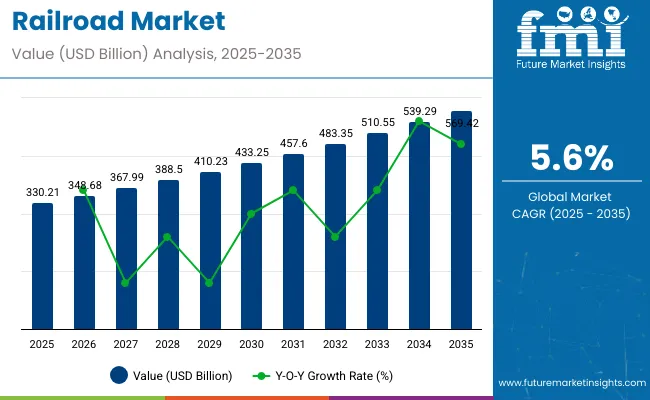
In 2024, the gross revenue of the world's railroad market is expected to be valued at US$ 311,628.9 million. A comprehensive analysis of the rail transit market projects that the railroad investment could increase at an annual growth rate of 5% from 2024 to 2034. The analysis report also gets to the bottom of underlying determinants for market growth in discussion until 2034, when it is expected to reach US$ 507,610.6 million.

Report Attribute Details
Railroad Market Revenue (2024) US$ 311,628.9 million
Market Anticipated Forecast Value (2034) US$ 507,610.6 million
Market Projected Growth Rate (2024 to 2034) 5%

Don't pay for what you don't need

Customize your report by selecting specific countries or regions and save 30%!

Global Railroad Market Trends

  • In comparison to other modes of transportation, rail transit is preferred more as an ecological and energy-efficient logistics solution.
  • Digital technology has revolutionized the rail transport market after gradually upgrading the whole sector by making reservations easier and enhancing passengers’ experience.
  • New commercial ventures, technology developments, and infrastructural upgrades of the rail service sector are all now aided by private sector investments.

Global Railroad Market Analysis During Historical Period from 2019 to 2023 Compared to Forecast Outlook for 2024 to 2034

According to the earlier assessment of railroad industry demand, sales of railroad components worldwide generated a revenue of around US$ 243,947.6 million in 2019. During the subsequent five years, the global sales of the railroad market progressed at an average 4.8% growth rate per year. By 2023 end, the global railroad industry was figured to have realized an annual revenue of US$ 294,267.1 million.

Attributes Details
Railroad Market Size (2019) US$ 243,947.6 million
Market Size (2023) US$ 294,267.1 million
Market (CAGR 2019 to 2023) 4.8%

Since traffic and road congestion emerged as persistent problems in the last decade, many countries chose to move products by train, instigating a higher demand for railroad track construction. Moreover, a rise in the e-commerce sector also raised the need for dependable and effective freight transportation infrastructure during this period. Though the sector experienced a brief period of downturn during the years 2020 and 2021, it regained its market potential in 2022 and 2023.

Ronak Shah
Ronak Shah

Principal Consultant

Talk to Analyst

Find your sweet spots for generating winning opportunities in this market.

Challenges and Opportunities for the Growth of Railroad Market

The railroad sector is expected to expand further as sustainability and environmentally friendly transportation options become essential. So, higher investments in the railway sector by public and private entities are expected to support the expansion of the railroad equipment sector over the forecast years.

In an increasingly urbanized world, underground railways or tube trains have become an indispensable mode of transportation for many countries. So, many established railroad equipment suppliers have evolved in the last few years to cater to the growing demand for railroads in the subway sector.

The advent of high-speed rails or bullet trains has increased the appeal of train travel for long-distance passengers as well as commercial enterprises. In the coming days, the growing popularity of bullet trains in emerging economies is expected to boost rail infrastructure development.

Comparative View of the Adjacent Railroad Market

The table below provides a summary of three markets operating in the global railway sector. The global demand for railroad ties is anticipated to follow the advancement of the railroad sector in general. Moreover, the progress of the railway track fittings market is expected to have a correlative impact on the overall railroad market.

Railroad Market:

Attributes Railroad Market
CAGR (2024 to 2034) 5%
Growth Factor Favorable policy changes to encourage more participation of private entities in railway network establishment, maintenance, and operations.
Market Opportunities The use of compressed recycled plastic as a substitute material for track sleepers is an emerging trend in many countries.
Market Challenges Soaring prices of iron, steel, and other metals used in the railway infrastructure are anticipated to hinder market growth.

Railroad Ties Market:

Attributes Railroad Ties Market
CAGR (2024 to 2034) 3%
Growth Factor Surging demand for the concrete tie-in train application with the developing subway train networks in emerging economies.
Market Opportunities With ongoing expenditures in infrastructure, technology, and equipment upgrades, the need to replace traditional wooden ties could grow.
Market Challenges Inconsistent standards for railroad tracks and equipment used in its construction pose a more significant challenge for railroad tie manufacturers.

Railway Track Fittings Market:

Attributes Railway Track Fittings Market
CAGR (2024 to 2034) 4.2%
Growth Factor Growing investment for expansion of railroad networks as well as increased focus on its proper maintenance to avoid accidents.
Market Opportunities Rising government investment in high-speed railway track construction is expected to drive the demand for railway track sleepers and fittings.
Market Challenges Security challenges for railway tracks in far-off locations that experience political disturbance frequently incur heavy damage to railway tracks.

Get the data you need at a Fraction of the cost

Personalize your report by choosing insights you need
and save 40%!

Country-wise Insights

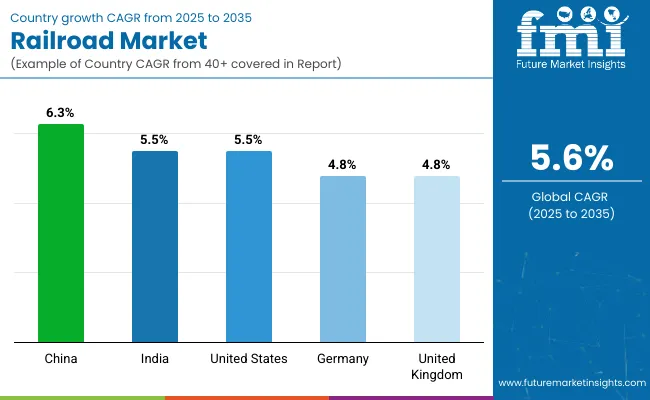
The table below lists the countries which are expected to witness a noteworthy growth rate in the railroad market. China and the United States are expected to grow on the back of increased export demand for railroad equipment. Meanwhile, domestic demand for railroad infrastructure is expected to drive the markets in India and Australia.

Regional Market Comparison CAGR (2024 to 2034)
United States 2.8%
Australia 4.5%
China 6.8%
India 7.3%

Private Sector Investments to Drive the United States Railroad Industry

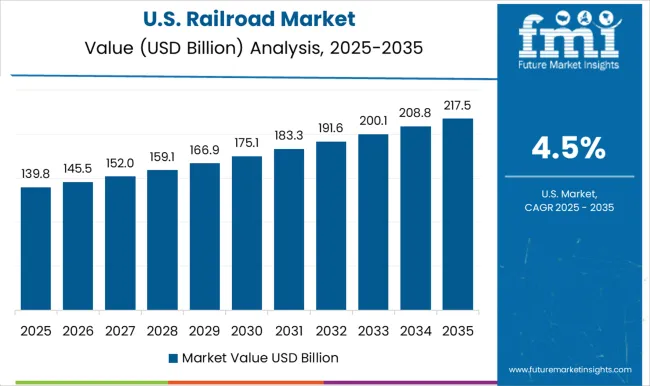
As per the global railway industry growth forecast, the market in the United States is projected to grow at 2.8% through 2034.

The railroad industry in the United States is seeing an increased investment by private market participants. For instance, Union Pacific Railroad Corporation provides a vital link in the global supply chain by building train connections between 23 states in the western part. Union Pacific supported America's rail transportation infrastructure by investing almost US$ 34 billion in its network and operations between 2013 and 2022.

Australia is the Nerve Center for Railroad Industry of Pacific and Oceania Countries

Australia has emerged as a promising market for railroad equipment manufacturers, and it is anticipated to experience a year-on-year growth rate of 4.5% till 2034.

Currently, the expansion and modernization of rail networks to improve the connection, capacity, and efficiency of train transportation services is driving the sales of railroad equipment in the domestic market. However, new policies to enhance the connectivity of hinterlands with coastal towns are more than likely to drive this growth trend during the projected years.

China Railroad Industry is Likely to Grow Along Ambitious Transcontinental Projects

The railroad sector in China is projected to register an impressive 6.8% growth rate per year over the next ten years.

China has started financing for rail projects in its neighboring countries because it understands how important railroads are for its Belt and Road (BRO) initiative. Moreover, it is hoped that the expansion of the railway network beyond China's borders could create enough business opportunities for railroad companies in many Asian countries.

Railroad Industries in India to Witness Immense Growth Opportunities

According to the market predictions, the demand for the railroad market in India is projected to rise at a robust 7.3% CAGR through 2034.

The revival of the Indian railroad industry in recent years can be attributed to increased investments by the federal government to beef up national train logistics. The regional market is experiencing some lucrative growth opportunities with the construction of new rail lines, the extension of current networks, and advancements in rail technology.

Category-wise Insights

The Passenger Rail Segment Holds a Greater Share than Freight Rail Segment

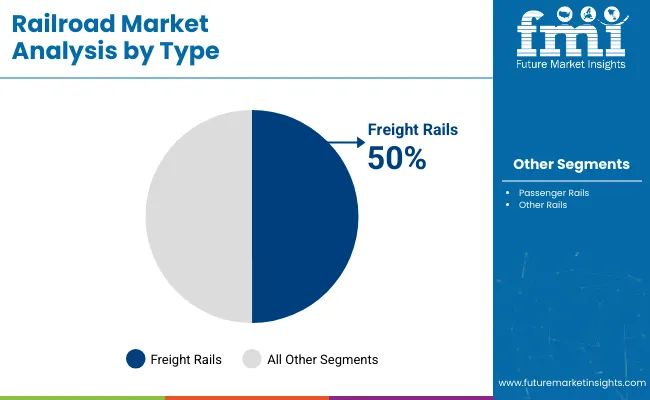
In 2024, the passenger rail segment is estimated to account for 56.7% of the worldwide revenue from sales of railroad equipment.

Attributes Details
Top Type Passenger Rail
Market Share in 2024 56.7%

The rail transit market is witnessing a significant shift from the freight or logistic sector to the passenger or tourism sector these days. Additionally, the expansion of passenger railroad networks after the introduction of metros and bullet trains is expected to boost the demand in this segment.

Deployment of Railroad in the Agriculture Sector is the Need of the Hour

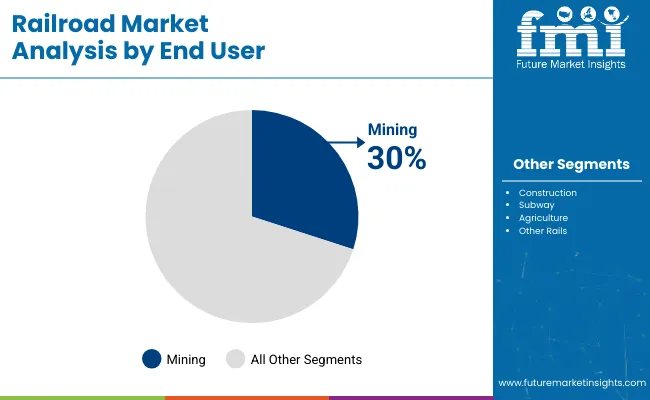
As per our industry sales analysis, the agriculture sector is anticipated to be the leading end user with a 33.8% market share in 2024.

Attributes Details
Top End User Agriculture
Market Share in 2024 33.8%

According to many governments, the railroad network is a cornerstone of their economy, as it helps to transport agricultural produce in bulk through freight rail corridors. Over the coming years, the contribution of the agriculture vertical is anticipated to expand further, particularly in the Asian and African countries.

Competitive Landscape

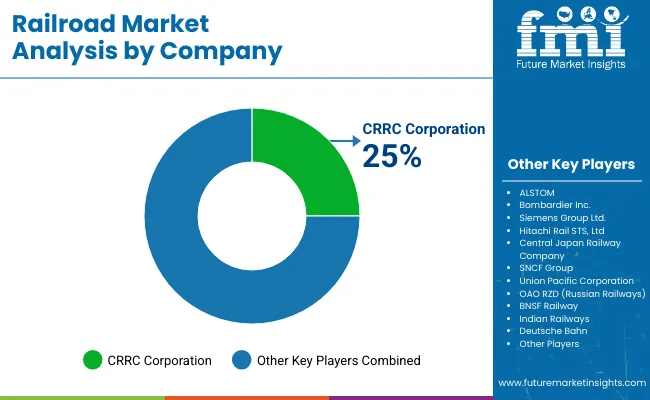
The greater share of the railroad project supplies is typically entrusted to a very few renowned railroad manufacturers, which consolidates the overall market. New market participants can establish their positions in the global railroad market by releasing innovative products tailored to specific railway tracks and by maintaining product differentiation.

Recent Developments in the Global Railroad Market

In November 2023, BNSF Railway and J.B. Hunt Transport Services Incorporate launched a groundbreaking intermodal service, Quantum, together. Quantum offers the dependability, flexibility, and quickness required for rail-based transit requirements during service-sensitive highway freight transportation. BNSF, the leading intermodal rail provider in North America, aims to meet the needs of customer supply chains through this development.

Hitachi Rail introduced four new products and services in September 2021 as part of its commitment to expand its rail business in North America. The company developed a processor which combines fundamental train control capabilities with next-generation communications, monitoring, and analytics. This new product, ViPro, has been designed to be used for railroad signaling and PTC applications.

Key Players Profiled in the Railroad Market Report

  • Central Japan Railway Company
  • SNCF Group
  • Union Pacific Corporation
  • OAO RZD (Russian Railways)
  • BNSF Railway
  • Indian Railways
  • Deutsche Bahn
  • JSC Russian Railways
  • CSX Corporation
  • Siemens Group Ltd.
  • Wabtec Corporation
  • The Greenbrier Companies
  • Progressive Rail Locomotive
  • Trinity Industries
  • ALSTOM
  • Bombardier Inc.
  • CRRC Corporation
  • Mitsubishi Electric Corporation
  • Hitachi Rail STS, Ltd

Railroad Market Report Scope

Attribute Details
Estimated Market Size (2024) US$ 311,628.9 million
Projected Market Size (2034) US$ 507,610.6 million
Anticipated Growth Rate (2024 to 2034) 5%
Forecast Period 2024 to 2034
Historical Data Available for 2019 to 2023
Market Analysis US$ million or billion for Value and Units for Volume
Key Regions Covered North America, Latin America, Europe, Middle East & Africa (MEA), East Asia, South Asia and Oceania
Key Countries Covered United States, Canada, Brazil, Mexico, Germany, Spain, Italy, France, United Kingdom, Russia, China, India, Australia & New Zealand, GCC Countries, and South Africa
Key Segments Covered By Type, By End Use, and By Region
Key Companies Profiled
  • Central Japan Railway Company
  • SNCF Group
  • Union Pacific Corporation
  • OAO RZD (Russian Railways)
  • BNSF Railway
  • Indian Railways
  • Deutsche Bahn
  • JSC Russian Railways
  • CSX Corporation
  • Siemens Group Ltd.
  • Wabtec Corporation
  • The Greenbrier Companies
  • Progressive Rail Locomotive
  • Trinity Industries
  • ALSTOM
  • Bombardier Inc.
  • CRRC Corporation
  • Mitsubishi Electric Corporation
  • Hitachi Rail STS, Ltd.
Report Coverage Market Forecast, Company Share Analysis, Competition Intelligence, DROT Analysis, Market Dynamics and Challenges, and Strategic Growth Initiatives
Customization & Pricing Available upon Request

Key Segments Covered by Railroad Industry Survey Report

By Type:

  • Freight Rails
  • Passenger Rails
  • Other Rails

By End User:

  • Mining
  • Construction
  • Agriculture
  • Subway
  • Others
  • Others

By Region:

  • North America
  • Latin America
  • Europe
  • East Asia
  • South Asia and Pacific
  • The Middle East and Africa (MEA)

Frequently Asked Questions

What is the Growth Outlook of the Railroad Market?

The global railroad market is to grow at 5% during the forecast period.

What is the Projected Value of the Railroad Market by 2034?

The global railroad market is predicted to be valued at US$ 507,610.6 million by 2034.

What was the Historical Size of the Railroad Market?

The global railroad market was valued at US$ 294,267.1 million in 2023.

Who are the Leading Railroad Suppliers in the Global Market?

SNCF, ALSTOM, and Hitachi are a few leading players in the global market.

Which Regional Market Has Subsequent Growth Potential?

India is likely to witness a CAGR of 7.3% through 2034.

Table of Content

1. Executive Summary

    1.1. Global Market Outlook

    1.2. Demand-side Trends

    1.3. Supply-side Trends

    1.4. Technology Roadmap Analysis

    1.5. Analysis and Recommendations

2. Market Overview

    2.1. Market Coverage / Taxonomy

    2.2. Market Definition / Scope / Limitations

3. Market Background

    3.1. Market Dynamics

        3.1.1. Drivers

        3.1.2. Restraints

        3.1.3. Opportunity

        3.1.4. Trends

    3.2. Scenario Forecast

        3.2.1. Demand in Optimistic Scenario

        3.2.2. Demand in Likely Scenario

        3.2.3. Demand in Conservative Scenario

    3.3. Opportunity Map Analysis

    3.4. Investment Feasibility Matrix

    3.5. PESTLE and Porter’s Analysis

    3.6. Regulatory Landscape

        3.6.1. By Key Regions

        3.6.2. By Key Countries

    3.7. Regional Parent Market Outlook

4. Global Market Analysis 2019 to 2023 and Forecast, 2024 to 2034

    4.1. Historical Market Size Value (US$ Million) Analysis, 2019 to 2023

    4.2. Current and Future Market Size Value (US$ Million) Projections, 2024 to 2034

        4.2.1. Y-o-Y Growth Trend Analysis

        4.2.2. Absolute $ Opportunity Analysis

5. Global Market Analysis 2019 to 2023 and Forecast 2024 to 2034, By Type

    5.1. Introduction / Key Findings

    5.2. Historical Market Size Value (US$ Million) Analysis By Type, 2019 to 2023

    5.3. Current and Future Market Size Value (US$ Million) Analysis and Forecast By Type, 2024 to 2034

        5.3.1. Rail Freight

        5.3.2. Passenger Rail

    5.4. Y-o-Y Growth Trend Analysis By Type, 2019 to 2023

    5.5. Absolute $ Opportunity Analysis By Type, 2024 to 2034

6. Global Market Analysis 2019 to 2023 and Forecast 2024 to 2034, By End-use

    6.1. Introduction / Key Findings

    6.2. Historical Market Size Value (US$ Million) Analysis By End-use, 2019 to 2023

    6.3. Current and Future Market Size Value (US$ Million) Analysis and Forecast By End-use, 2024 to 2034

        6.3.1. Mining

        6.3.2. Construction

        6.3.3. Agriculture

        6.3.4. Others

    6.4. Y-o-Y Growth Trend Analysis By End-use, 2019 to 2023

    6.5. Absolute $ Opportunity Analysis By End-use, 2024 to 2034

7. Global Market Analysis 2019 to 2023 and Forecast 2024 to 2034, By Region

    7.1. Introduction

    7.2. Historical Market Size Value (US$ Million) Analysis By Region, 2019 to 2023

    7.3. Current Market Size Value (US$ Million) Analysis and Forecast By Region, 2024 to 2034

        7.3.1. North America

        7.3.2. Latin America

        7.3.3. Western Europe

        7.3.4. Eastern Europe

        7.3.5. South Asia and Pacific

        7.3.6. East Asia

        7.3.7. Middle East and Africa

    7.4. Market Attractiveness Analysis By Region

8. North America Market Analysis 2019 to 2023 and Forecast 2024 to 2034, By Country

    8.1. Historical Market Size Value (US$ Million) Trend Analysis By Market Taxonomy, 2019 to 2023

    8.2. Market Size Value (US$ Million) Forecast By Market Taxonomy, 2024 to 2034

        8.2.1. By Country

            8.2.1.1. USA

            8.2.1.2. Canada

        8.2.2. By Type

        8.2.3. By End-use

    8.3. Market Attractiveness Analysis

        8.3.1. By Country

        8.3.2. By Type

        8.3.3. By End-use

    8.4. Key Takeaways

9. Latin America Market Analysis 2019 to 2023 and Forecast 2024 to 2034, By Country

    9.1. Historical Market Size Value (US$ Million) Trend Analysis By Market Taxonomy, 2019 to 2023

    9.2. Market Size Value (US$ Million) Forecast By Market Taxonomy, 2024 to 2034

        9.2.1. By Country

            9.2.1.1. Brazil

            9.2.1.2. Mexico

            9.2.1.3. Rest of Latin America

        9.2.2. By Type

        9.2.3. By End-use

    9.3. Market Attractiveness Analysis

        9.3.1. By Country

        9.3.2. By Type

        9.3.3. By End-use

    9.4. Key Takeaways

10. Western Europe Market Analysis 2019 to 2023 and Forecast 2024 to 2034, By Country

    10.1. Historical Market Size Value (US$ Million) Trend Analysis By Market Taxonomy, 2019 to 2023

    10.2. Market Size Value (US$ Million) Forecast By Market Taxonomy, 2024 to 2034

        10.2.1. By Country

            10.2.1.1. Germany

            10.2.1.2. UK

            10.2.1.3. France

            10.2.1.4. Spain

            10.2.1.5. Italy

            10.2.1.6. Rest of Western Europe

        10.2.2. By Type

        10.2.3. By End-use

    10.3. Market Attractiveness Analysis

        10.3.1. By Country

        10.3.2. By Type

        10.3.3. By End-use

    10.4. Key Takeaways

11. Eastern Europe Market Analysis 2019 to 2023 and Forecast 2024 to 2034, By Country

    11.1. Historical Market Size Value (US$ Million) Trend Analysis By Market Taxonomy, 2019 to 2023

    11.2. Market Size Value (US$ Million) Forecast By Market Taxonomy, 2024 to 2034

        11.2.1. By Country

            11.2.1.1. Poland

            11.2.1.2. Russia

            11.2.1.3. Czech Republic

            11.2.1.4. Romania

            11.2.1.5. Rest of Eastern Europe

        11.2.2. By Type

        11.2.3. By End-use

    11.3. Market Attractiveness Analysis

        11.3.1. By Country

        11.3.2. By Type

        11.3.3. By End-use

    11.4. Key Takeaways

12. South Asia and Pacific Market Analysis 2019 to 2023 and Forecast 2024 to 2034, By Country

    12.1. Historical Market Size Value (US$ Million) Trend Analysis By Market Taxonomy, 2019 to 2023

    12.2. Market Size Value (US$ Million) Forecast By Market Taxonomy, 2024 to 2034

        12.2.1. By Country

            12.2.1.1. India

            12.2.1.2. Bangladesh

            12.2.1.3. Australia

            12.2.1.4. New Zealand

            12.2.1.5. Rest of South Asia and Pacific

        12.2.2. By Type

        12.2.3. By End-use

    12.3. Market Attractiveness Analysis

        12.3.1. By Country

        12.3.2. By Type

        12.3.3. By End-use

    12.4. Key Takeaways

13. East Asia Market Analysis 2019 to 2023 and Forecast 2024 to 2034, By Country

    13.1. Historical Market Size Value (US$ Million) Trend Analysis By Market Taxonomy, 2019 to 2023

    13.2. Market Size Value (US$ Million) Forecast By Market Taxonomy, 2024 to 2034

        13.2.1. By Country

            13.2.1.1. China

            13.2.1.2. Japan

            13.2.1.3. South Korea

        13.2.2. By Type

        13.2.3. By End-use

    13.3. Market Attractiveness Analysis

        13.3.1. By Country

        13.3.2. By Type

        13.3.3. By End-use

    13.4. Key Takeaways

14. Middle East and Africa Market Analysis 2019 to 2023 and Forecast 2024 to 2034, By Country

    14.1. Historical Market Size Value (US$ Million) Trend Analysis By Market Taxonomy, 2019 to 2023

    14.2. Market Size Value (US$ Million) Forecast By Market Taxonomy, 2024 to 2034

        14.2.1. By Country

            14.2.1.1. GCC Countries

            14.2.1.2. South Africa

            14.2.1.3. Israel

            14.2.1.4. Rest of MEA

        14.2.2. By Type

        14.2.3. By End-use

    14.3. Market Attractiveness Analysis

        14.3.1. By Country

        14.3.2. By Type

        14.3.3. By End-use

    14.4. Key Takeaways

15. Key Countries Market Analysis

    15.1. USA

        15.1.1. Pricing Analysis

        15.1.2. Market Share Analysis, 2023

            15.1.2.1. By Type

            15.1.2.2. By End-use

    15.2. Canada

        15.2.1. Pricing Analysis

        15.2.2. Market Share Analysis, 2023

            15.2.2.1. By Type

            15.2.2.2. By End-use

    15.3. Brazil

        15.3.1. Pricing Analysis

        15.3.2. Market Share Analysis, 2023

            15.3.2.1. By Type

            15.3.2.2. By End-use

    15.4. Mexico

        15.4.1. Pricing Analysis

        15.4.2. Market Share Analysis, 2023

            15.4.2.1. By Type

            15.4.2.2. By End-use

    15.5. Germany

        15.5.1. Pricing Analysis

        15.5.2. Market Share Analysis, 2023

            15.5.2.1. By Type

            15.5.2.2. By End-use

    15.6. UK

        15.6.1. Pricing Analysis

        15.6.2. Market Share Analysis, 2023

            15.6.2.1. By Type

            15.6.2.2. By End-use

    15.7. France

        15.7.1. Pricing Analysis

        15.7.2. Market Share Analysis, 2023

            15.7.2.1. By Type

            15.7.2.2. By End-use

    15.8. Spain

        15.8.1. Pricing Analysis

        15.8.2. Market Share Analysis, 2023

            15.8.2.1. By Type

            15.8.2.2. By End-use

    15.9. Italy

        15.9.1. Pricing Analysis

        15.9.2. Market Share Analysis, 2023

            15.9.2.1. By Type

            15.9.2.2. By End-use

    15.10. Poland

        15.10.1. Pricing Analysis

        15.10.2. Market Share Analysis, 2023

            15.10.2.1. By Type

            15.10.2.2. By End-use

    15.11. Russia

        15.11.1. Pricing Analysis

        15.11.2. Market Share Analysis, 2023

            15.11.2.1. By Type

            15.11.2.2. By End-use

    15.12. Czech Republic

        15.12.1. Pricing Analysis

        15.12.2. Market Share Analysis, 2023

            15.12.2.1. By Type

            15.12.2.2. By End-use

    15.13. Romania

        15.13.1. Pricing Analysis

        15.13.2. Market Share Analysis, 2023

            15.13.2.1. By Type

            15.13.2.2. By End-use

    15.14. India

        15.14.1. Pricing Analysis

        15.14.2. Market Share Analysis, 2023

            15.14.2.1. By Type

            15.14.2.2. By End-use

    15.15. Bangladesh

        15.15.1. Pricing Analysis

        15.15.2. Market Share Analysis, 2023

            15.15.2.1. By Type

            15.15.2.2. By End-use

    15.16. Australia

        15.16.1. Pricing Analysis

        15.16.2. Market Share Analysis, 2023

            15.16.2.1. By Type

            15.16.2.2. By End-use

    15.17. New Zealand

        15.17.1. Pricing Analysis

        15.17.2. Market Share Analysis, 2023

            15.17.2.1. By Type

            15.17.2.2. By End-use

    15.18. China

        15.18.1. Pricing Analysis

        15.18.2. Market Share Analysis, 2023

            15.18.2.1. By Type

            15.18.2.2. By End-use

    15.19. Japan

        15.19.1. Pricing Analysis

        15.19.2. Market Share Analysis, 2023

            15.19.2.1. By Type

            15.19.2.2. By End-use

    15.20. South Korea

        15.20.1. Pricing Analysis

        15.20.2. Market Share Analysis, 2023

            15.20.2.1. By Type

            15.20.2.2. By End-use

    15.21. GCC Countries

        15.21.1. Pricing Analysis

        15.21.2. Market Share Analysis, 2023

            15.21.2.1. By Type

            15.21.2.2. By End-use

    15.22. South Africa

        15.22.1. Pricing Analysis

        15.22.2. Market Share Analysis, 2023

            15.22.2.1. By Type

            15.22.2.2. By End-use

    15.23. Israel

        15.23.1. Pricing Analysis

        15.23.2. Market Share Analysis, 2023

            15.23.2.1. By Type

            15.23.2.2. By End-use

16. Market Structure Analysis

    16.1. Competition Dashboard

    16.2. Competition Benchmarking

    16.3. Market Share Analysis of Top Players

        16.3.1. By Regional

        16.3.2. By Type

        16.3.3. By End-use

17. Competition Analysis

    17.1. Competition Deep Dive

        17.1.1. Central Japan Railway Company

            17.1.1.1. Overview

            17.1.1.2. Product Portfolio

            17.1.1.3. Profitability by Market Segments

            17.1.1.4. Sales Footprint

            17.1.1.5. Strategy Overview

                17.1.1.5.1. Marketing Strategy

        17.1.2. SNCF Group

            17.1.2.1. Overview

            17.1.2.2. Product Portfolio

            17.1.2.3. Profitability by Market Segments

            17.1.2.4. Sales Footprint

            17.1.2.5. Strategy Overview

                17.1.2.5.1. Marketing Strategy

        17.1.3. Union Pacific Corporation

            17.1.3.1. Overview

            17.1.3.2. Product Portfolio

            17.1.3.3. Profitability by Market Segments

            17.1.3.4. Sales Footprint

            17.1.3.5. Strategy Overview

                17.1.3.5.1. Marketing Strategy

        17.1.4. OAO RZD (Russian Railways)

            17.1.4.1. Overview

            17.1.4.2. Product Portfolio

            17.1.4.3. Profitability by Market Segments

            17.1.4.4. Sales Footprint

            17.1.4.5. Strategy Overview

                17.1.4.5.1. Marketing Strategy

        17.1.5. BNSF Railway

            17.1.5.1. Overview

            17.1.5.2. Product Portfolio

            17.1.5.3. Profitability by Market Segments

            17.1.5.4. Sales Footprint

            17.1.5.5. Strategy Overview

                17.1.5.5.1. Marketing Strategy

        17.1.6. Indian Railways

            17.1.6.1. Overview

            17.1.6.2. Product Portfolio

            17.1.6.3. Profitability by Market Segments

            17.1.6.4. Sales Footprint

            17.1.6.5. Strategy Overview

                17.1.6.5.1. Marketing Strategy

        17.1.7. Deutsche Bahn

            17.1.7.1. Overview

            17.1.7.2. Product Portfolio

            17.1.7.3. Profitability by Market Segments

            17.1.7.4. Sales Footprint

            17.1.7.5. Strategy Overview

                17.1.7.5.1. Marketing Strategy

        17.1.8. JSC Russian Railways

            17.1.8.1. Overview

            17.1.8.2. Product Portfolio

            17.1.8.3. Profitability by Market Segments

            17.1.8.4. Sales Footprint

            17.1.8.5. Strategy Overview

                17.1.8.5.1. Marketing Strategy

        17.1.9. CSX Corporation

            17.1.9.1. Overview

            17.1.9.2. Product Portfolio

            17.1.9.3. Profitability by Market Segments

            17.1.9.4. Sales Footprint

            17.1.9.5. Strategy Overview

                17.1.9.5.1. Marketing Strategy

        17.1.10. SBB Cargo

            17.1.10.1. Overview

            17.1.10.2. Product Portfolio

            17.1.10.3. Profitability by Market Segments

            17.1.10.4. Sales Footprint

            17.1.10.5. Strategy Overview

                17.1.10.5.1. Marketing Strategy

18. Assumptions & Acronyms Used

19. Research Methodology

List of Tables

Table 1: Global Market Value (US$ Million) Forecast by Region, 2019 to 2034

Table 2: Global Market Value (US$ Million) Forecast by Type, 2019 to 2034

Table 3: Global Market Value (US$ Million) Forecast by End-use, 2019 to 2034

Table 4: North America Market Value (US$ Million) Forecast by Country, 2019 to 2034

Table 5: North America Market Value (US$ Million) Forecast by Type, 2019 to 2034

Table 6: North America Market Value (US$ Million) Forecast by End-use, 2019 to 2034

Table 7: Latin America Market Value (US$ Million) Forecast by Country, 2019 to 2034

Table 8: Latin America Market Value (US$ Million) Forecast by Type, 2019 to 2034

Table 9: Latin America Market Value (US$ Million) Forecast by End-use, 2019 to 2034

Table 10: Western Europe Market Value (US$ Million) Forecast by Country, 2019 to 2034

Table 11: Western Europe Market Value (US$ Million) Forecast by Type, 2019 to 2034

Table 12: Western Europe Market Value (US$ Million) Forecast by End-use, 2019 to 2034

Table 13: Eastern Europe Market Value (US$ Million) Forecast by Country, 2019 to 2034

Table 14: Eastern Europe Market Value (US$ Million) Forecast by Type, 2019 to 2034

Table 15: Eastern Europe Market Value (US$ Million) Forecast by End-use, 2019 to 2034

Table 16: South Asia and Pacific Market Value (US$ Million) Forecast by Country, 2019 to 2034

Table 17: South Asia and Pacific Market Value (US$ Million) Forecast by Type, 2019 to 2034

Table 18: South Asia and Pacific Market Value (US$ Million) Forecast by End-use, 2019 to 2034

Table 19: East Asia Market Value (US$ Million) Forecast by Country, 2019 to 2034

Table 20: East Asia Market Value (US$ Million) Forecast by Type, 2019 to 2034

Table 21: East Asia Market Value (US$ Million) Forecast by End-use, 2019 to 2034

Table 22: Middle East and Africa Market Value (US$ Million) Forecast by Country, 2019 to 2034

Table 23: Middle East and Africa Market Value (US$ Million) Forecast by Type, 2019 to 2034

Table 24: Middle East and Africa Market Value (US$ Million) Forecast by End-use, 2019 to 2034

List of Charts

Figure 1: Global Market Value (US$ Million) by Type, 2024 to 2034

Figure 2: Global Market Value (US$ Million) by End-use, 2024 to 2034

Figure 3: Global Market Value (US$ Million) by Region, 2024 to 2034

Figure 4: Global Market Value (US$ Million) Analysis by Region, 2019 to 2034

Figure 5: Global Market Value Share (%) and BPS Analysis by Region, 2024 to 2034

Figure 6: Global Market Y-o-Y Growth (%) Projections by Region, 2024 to 2034

Figure 7: Global Market Value (US$ Million) Analysis by Type, 2019 to 2034

Figure 8: Global Market Value Share (%) and BPS Analysis by Type, 2024 to 2034

Figure 9: Global Market Y-o-Y Growth (%) Projections by Type, 2024 to 2034

Figure 10: Global Market Value (US$ Million) Analysis by End-use, 2019 to 2034

Figure 11: Global Market Value Share (%) and BPS Analysis by End-use, 2024 to 2034

Figure 12: Global Market Y-o-Y Growth (%) Projections by End-use, 2024 to 2034

Figure 13: Global Market Attractiveness by Type, 2024 to 2034

Figure 14: Global Market Attractiveness by End-use, 2024 to 2034

Figure 15: Global Market Attractiveness by Region, 2024 to 2034

Figure 16: North America Market Value (US$ Million) by Type, 2024 to 2034

Figure 17: North America Market Value (US$ Million) by End-use, 2024 to 2034

Figure 18: North America Market Value (US$ Million) by Country, 2024 to 2034

Figure 19: North America Market Value (US$ Million) Analysis by Country, 2019 to 2034

Figure 20: North America Market Value Share (%) and BPS Analysis by Country, 2024 to 2034

Figure 21: North America Market Y-o-Y Growth (%) Projections by Country, 2024 to 2034

Figure 22: North America Market Value (US$ Million) Analysis by Type, 2019 to 2034

Figure 23: North America Market Value Share (%) and BPS Analysis by Type, 2024 to 2034

Figure 24: North America Market Y-o-Y Growth (%) Projections by Type, 2024 to 2034

Figure 25: North America Market Value (US$ Million) Analysis by End-use, 2019 to 2034

Figure 26: North America Market Value Share (%) and BPS Analysis by End-use, 2024 to 2034

Figure 27: North America Market Y-o-Y Growth (%) Projections by End-use, 2024 to 2034

Figure 28: North America Market Attractiveness by Type, 2024 to 2034

Figure 29: North America Market Attractiveness by End-use, 2024 to 2034

Figure 30: North America Market Attractiveness by Country, 2024 to 2034

Figure 31: Latin America Market Value (US$ Million) by Type, 2024 to 2034

Figure 32: Latin America Market Value (US$ Million) by End-use, 2024 to 2034

Figure 33: Latin America Market Value (US$ Million) by Country, 2024 to 2034

Figure 34: Latin America Market Value (US$ Million) Analysis by Country, 2019 to 2034

Figure 35: Latin America Market Value Share (%) and BPS Analysis by Country, 2024 to 2034

Figure 36: Latin America Market Y-o-Y Growth (%) Projections by Country, 2024 to 2034

Figure 37: Latin America Market Value (US$ Million) Analysis by Type, 2019 to 2034

Figure 38: Latin America Market Value Share (%) and BPS Analysis by Type, 2024 to 2034

Figure 39: Latin America Market Y-o-Y Growth (%) Projections by Type, 2024 to 2034

Figure 40: Latin America Market Value (US$ Million) Analysis by End-use, 2019 to 2034

Figure 41: Latin America Market Value Share (%) and BPS Analysis by End-use, 2024 to 2034

Figure 42: Latin America Market Y-o-Y Growth (%) Projections by End-use, 2024 to 2034

Figure 43: Latin America Market Attractiveness by Type, 2024 to 2034

Figure 44: Latin America Market Attractiveness by End-use, 2024 to 2034

Figure 45: Latin America Market Attractiveness by Country, 2024 to 2034

Figure 46: Western Europe Market Value (US$ Million) by Type, 2024 to 2034

Figure 47: Western Europe Market Value (US$ Million) by End-use, 2024 to 2034

Figure 48: Western Europe Market Value (US$ Million) by Country, 2024 to 2034

Figure 49: Western Europe Market Value (US$ Million) Analysis by Country, 2019 to 2034

Figure 50: Western Europe Market Value Share (%) and BPS Analysis by Country, 2024 to 2034

Figure 51: Western Europe Market Y-o-Y Growth (%) Projections by Country, 2024 to 2034

Figure 52: Western Europe Market Value (US$ Million) Analysis by Type, 2019 to 2034

Figure 53: Western Europe Market Value Share (%) and BPS Analysis by Type, 2024 to 2034

Figure 54: Western Europe Market Y-o-Y Growth (%) Projections by Type, 2024 to 2034

Figure 55: Western Europe Market Value (US$ Million) Analysis by End-use, 2019 to 2034

Figure 56: Western Europe Market Value Share (%) and BPS Analysis by End-use, 2024 to 2034

Figure 57: Western Europe Market Y-o-Y Growth (%) Projections by End-use, 2024 to 2034

Figure 58: Western Europe Market Attractiveness by Type, 2024 to 2034

Figure 59: Western Europe Market Attractiveness by End-use, 2024 to 2034

Figure 60: Western Europe Market Attractiveness by Country, 2024 to 2034

Figure 61: Eastern Europe Market Value (US$ Million) by Type, 2024 to 2034

Figure 62: Eastern Europe Market Value (US$ Million) by End-use, 2024 to 2034

Figure 63: Eastern Europe Market Value (US$ Million) by Country, 2024 to 2034

Figure 64: Eastern Europe Market Value (US$ Million) Analysis by Country, 2019 to 2034

Figure 65: Eastern Europe Market Value Share (%) and BPS Analysis by Country, 2024 to 2034

Figure 66: Eastern Europe Market Y-o-Y Growth (%) Projections by Country, 2024 to 2034

Figure 67: Eastern Europe Market Value (US$ Million) Analysis by Type, 2019 to 2034

Figure 68: Eastern Europe Market Value Share (%) and BPS Analysis by Type, 2024 to 2034

Figure 69: Eastern Europe Market Y-o-Y Growth (%) Projections by Type, 2024 to 2034

Figure 70: Eastern Europe Market Value (US$ Million) Analysis by End-use, 2019 to 2034

Figure 71: Eastern Europe Market Value Share (%) and BPS Analysis by End-use, 2024 to 2034

Figure 72: Eastern Europe Market Y-o-Y Growth (%) Projections by End-use, 2024 to 2034

Figure 73: Eastern Europe Market Attractiveness by Type, 2024 to 2034

Figure 74: Eastern Europe Market Attractiveness by End-use, 2024 to 2034

Figure 75: Eastern Europe Market Attractiveness by Country, 2024 to 2034

Figure 76: South Asia and Pacific Market Value (US$ Million) by Type, 2024 to 2034

Figure 77: South Asia and Pacific Market Value (US$ Million) by End-use, 2024 to 2034

Figure 78: South Asia and Pacific Market Value (US$ Million) by Country, 2024 to 2034

Figure 79: South Asia and Pacific Market Value (US$ Million) Analysis by Country, 2019 to 2034

Figure 80: South Asia and Pacific Market Value Share (%) and BPS Analysis by Country, 2024 to 2034

Figure 81: South Asia and Pacific Market Y-o-Y Growth (%) Projections by Country, 2024 to 2034

Figure 82: South Asia and Pacific Market Value (US$ Million) Analysis by Type, 2019 to 2034

Figure 83: South Asia and Pacific Market Value Share (%) and BPS Analysis by Type, 2024 to 2034

Figure 84: South Asia and Pacific Market Y-o-Y Growth (%) Projections by Type, 2024 to 2034

Figure 85: South Asia and Pacific Market Value (US$ Million) Analysis by End-use, 2019 to 2034

Figure 86: South Asia and Pacific Market Value Share (%) and BPS Analysis by End-use, 2024 to 2034

Figure 87: South Asia and Pacific Market Y-o-Y Growth (%) Projections by End-use, 2024 to 2034

Figure 88: South Asia and Pacific Market Attractiveness by Type, 2024 to 2034

Figure 89: South Asia and Pacific Market Attractiveness by End-use, 2024 to 2034

Figure 90: South Asia and Pacific Market Attractiveness by Country, 2024 to 2034

Figure 91: East Asia Market Value (US$ Million) by Type, 2024 to 2034

Figure 92: East Asia Market Value (US$ Million) by End-use, 2024 to 2034

Figure 93: East Asia Market Value (US$ Million) by Country, 2024 to 2034

Figure 94: East Asia Market Value (US$ Million) Analysis by Country, 2019 to 2034

Figure 95: East Asia Market Value Share (%) and BPS Analysis by Country, 2024 to 2034

Figure 96: East Asia Market Y-o-Y Growth (%) Projections by Country, 2024 to 2034

Figure 97: East Asia Market Value (US$ Million) Analysis by Type, 2019 to 2034

Figure 98: East Asia Market Value Share (%) and BPS Analysis by Type, 2024 to 2034

Figure 99: East Asia Market Y-o-Y Growth (%) Projections by Type, 2024 to 2034

Figure 100: East Asia Market Value (US$ Million) Analysis by End-use, 2019 to 2034

Figure 101: East Asia Market Value Share (%) and BPS Analysis by End-use, 2024 to 2034

Figure 102: East Asia Market Y-o-Y Growth (%) Projections by End-use, 2024 to 2034

Figure 103: East Asia Market Attractiveness by Type, 2024 to 2034

Figure 104: East Asia Market Attractiveness by End-use, 2024 to 2034

Figure 105: East Asia Market Attractiveness by Country, 2024 to 2034

Figure 106: Middle East and Africa Market Value (US$ Million) by Type, 2024 to 2034

Figure 107: Middle East and Africa Market Value (US$ Million) by End-use, 2024 to 2034

Figure 108: Middle East and Africa Market Value (US$ Million) by Country, 2024 to 2034

Figure 109: Middle East and Africa Market Value (US$ Million) Analysis by Country, 2019 to 2034

Figure 110: Middle East and Africa Market Value Share (%) and BPS Analysis by Country, 2024 to 2034

Figure 111: Middle East and Africa Market Y-o-Y Growth (%) Projections by Country, 2024 to 2034

Figure 112: Middle East and Africa Market Value (US$ Million) Analysis by Type, 2019 to 2034

Figure 113: Middle East and Africa Market Value Share (%) and BPS Analysis by Type, 2024 to 2034

Figure 114: Middle East and Africa Market Y-o-Y Growth (%) Projections by Type, 2024 to 2034

Figure 115: Middle East and Africa Market Value (US$ Million) Analysis by End-use, 2019 to 2034

Figure 116: Middle East and Africa Market Value Share (%) and BPS Analysis by End-use, 2024 to 2034

Figure 117: Middle East and Africa Market Y-o-Y Growth (%) Projections by End-use, 2024 to 2034

Figure 118: Middle East and Africa Market Attractiveness by Type, 2024 to 2034

Figure 119: Middle East and Africa Market Attractiveness by End-use, 2024 to 2034

Figure 120: Middle East and Africa Market Attractiveness by Country, 2024 to 2034

Recommendations

Automotive

Railroad Ties Market

Published : February 2023

Industrial Automation

Railway Track Fittings Market

Published : February 2023

Explore Travel and Tourism Insights

View Reports