The Rheometers Market is estimated to be valued at USD 9.1 billion in 2025 and is projected to reach USD 14.9 billion by 2035, registering a compound annual growth rate (CAGR) of 5.1% over the forecast period.
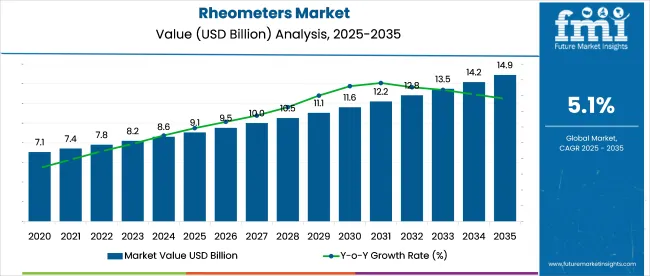
The rheometers market is witnessing steady growth, driven by expanding applications in material science, quality control, and product formulation processes. Industry publications and company announcements have emphasized the rising importance of rheological analysis in evaluating the viscosity, elasticity, and flow properties of complex fluids and soft solids.
Technological advancements in equipment sensitivity, automation, and data analysis capabilities have enhanced the precision and versatility of rheometers, supporting adoption across diverse industries. Additionally, increasing regulatory requirements for product consistency in pharmaceuticals, food and beverages, and chemicals have underscored the critical role of rheometry in production environments.
Offline sales channels have remained prominent due to the technical consultation and after-sales support required for high-precision instrumentation. As manufacturers expand their product lines with modular configurations and software integration, the market outlook remains positive. Segmental leadership is driven by Rotational Rheometers, Offline sales channels, and Industrial end users, reflecting the demand for advanced rheological testing in production and R&D facilities.
The market is segmented by Equipment Type, Sales Channel, and End User and region. By Equipment Type, the market is divided into Rotational Rheometers, Capillary Rheometers, and Oscillatory Rheometers. In terms of Sales Channel, the market is classified into Offline and Online.
Based on End User, the market is segmented into Industrial, Pharmaceutical, Industrial Oils and Lubricants, Paints & Coating, Food & Beverages, Petrochemicals, Cosmetics, Polymers & Rubber, Others (Research & Academician and Building & Construction Materials), and Testing & certification Agencies.
Regionally, the market is classified into North America, Latin America, Western Europe, Eastern Europe, Balkan & Baltic Countries, Russia & Belarus, Central Asia, East Asia, South Asia & Pacific, and the Middle East & Africa.
The Rotational Rheometers segment is projected to account for 44.0% of the rheometers market revenue in 2025, maintaining its lead among equipment types. Growth in this segment has been driven by the broad applicability of rotational rheometers in characterizing the flow behavior and viscoelastic properties of liquids and semi-solids.
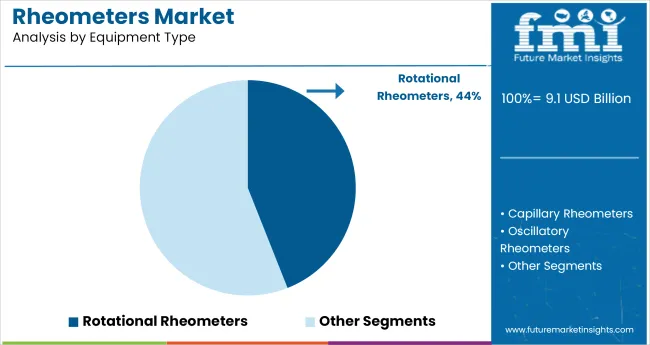
Industrial laboratories and quality control departments have preferred rotational rheometers for their ability to measure a wide range of viscosities under controlled shear conditions. Manufacturers have continued to enhance these instruments with advanced temperature control systems, automated gap settings, and user-friendly interfaces, improving their operational efficiency.
Furthermore, the ability to customize testing geometries and protocols has enabled rotational rheometers to serve applications in pharmaceuticals, food processing, polymers, and coatings. As industrial sectors increasingly focus on product optimization and compliance with rheological specifications, the Rotational Rheometers segment is expected to sustain its leading market position.
The Offline segment is projected to contribute 61.5% of the rheometers market revenue in 2025, securing its dominance among sales channels. Growth of this segment has been supported by the specialized nature of rheometers, where in-person demonstrations, technical consultations, and hands-on training are essential for informed purchasing decisions.
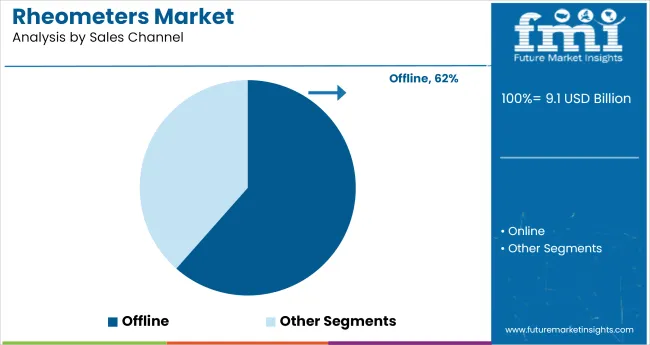
Industrial buyers have relied on direct sales representatives, distributors, and authorized dealers to provide detailed product specifications, application advice, and post-purchase support. Offline sales channels have also facilitated equipment customization and bundling with related laboratory instruments, offering a comprehensive procurement experience.
Industry trade shows, technical workshops, and on-site demonstrations have further strengthened offline sales engagement. As rheometry remains a technically complex field, the Offline segment is expected to remain the primary sales channel, driven by the need for personalized service and technical expertise in equipment selection.
The Industrial segment is projected to hold 76.00% of the rheometers market revenue in 2025, positioning it as the leading end user segment. Growth in this segment has been driven by the widespread use of rheometers in industrial production processes, where controlling material properties is critical for product quality and consistency.
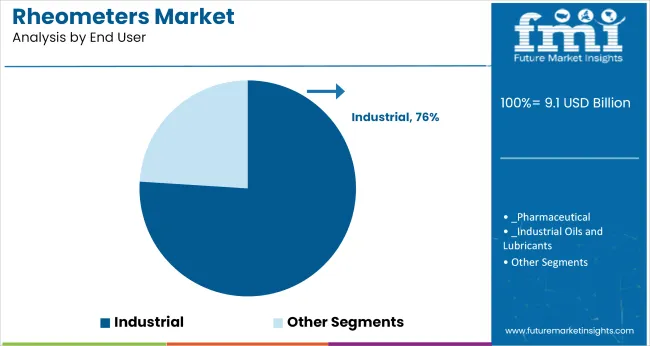
Industries such as chemicals, paints and coatings, construction materials, and food manufacturing have integrated rheometry into their quality control and formulation development workflows. Industrial users have prioritized rheometers for routine batch testing, raw material evaluation, and process optimization.
Additionally, the increasing complexity of industrial formulations has necessitated advanced rheological analysis to ensure performance under varying operational conditions. Manufacturers have responded by developing rugged, high-throughput rheometers designed for industrial environments. As quality assurance and regulatory compliance remain central to industrial production, the Industrial segment is expected to continue driving the majority of demand in the rheometers market.
Rapid industrialization and increasing investments for precise industrial equipment sector in developing counties will enable the Rheometers market growth at 12% CAGR during the forecast period 2025 to 2035. Whereas between 2020 and 2024, the global Rheometers Market expanded at a CAGR of over 3.8%.
Along with the rapidly growing industrial sector, awareness about product safety is increasing among customers. This is compelling manufacturers to strictly follow the regulatory frameworks, especially in pharmaceutical and cosmeceutical sector. Also, this regulatory frameworks on country level in respective industries is expected to create plenty of opportunities for the market growth.
Capillary Rheometer have emerged as a top choice across diverse industries. This is expected to enable growth in the market in the coming years.
Leading manufacturing companies are focusing on product development and advancement by highly investing in research & development (R&D) activities. They also are expanding their geographical presence through participating in merger & acquisition.
It has been observed that offline sales channel is driving the demand for Rheometer since of the leading manufacturers have tied up with various institutions. Coupled with this, the market is expected to gain from the increasing demand for rheometer for research in laboratories and testing agencies.
The high installation cost associated with the rheometer is one of the major factors restraining the growth of the Market. Also, expert guidance is highly required during the installation of the equipment for the efficient operation of systems as per the application’s requirements.
Therefore, technical support should be pursued in order to achieve desired result whenever required. Hence, requirement of skilled labor force to operate the equipment effectively and high investment cost in setting up rheometers are expected to act as barriers to growth of the Rheometers Market.
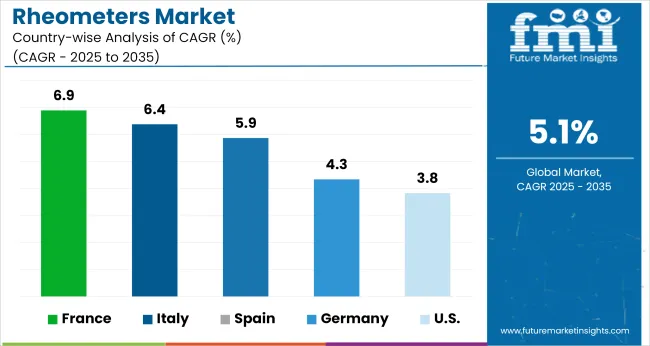
North America is expected to hold dominant share during the forecast period, according to Future Market Insights (FMI). According to the study, the USA is expected to account for nearly 50% of the North America market through 2035.
The USMCA, a new agreement between the USA, Mexico, and Canada that replaces NAFTA, will provide benefits to businesses in the North America market. The country is home to some of the leading market participants like Thermo Fischer Inc, Ametek Inc, ITW Instron and TA Instruments which are playing key role in fueling the growth of the Rheometers Market over the forecast period.
Furthermore, the USA remains one of the world's largest markets for industrial equipment, making it a lucrative market for Rheometer manufacturers. In addition, expansion of the end-use sectors such as building & construction, petrochemical industries and polymer & rubber industries in the USA is expected to drive demand growth during forecast period.
Demand in the Germany market is expected to rise at nearly 7.1% CAGR over the forecast period. Owing to its industrial expansion and technological developments, Germany is considered the world’s fourth largest economy and one of the largest machinery producing nations.
Also, Germany has the most elevated level of expenditure, excellent levels of productivity, a highly qualified labor force, high-quality engineering, good infrastructure, and has access to other markets in Europe due to convenience of a central location.
As per the report, the Germany is recognized as a primary market, and it is expected to continue exhibiting high demand for Rheometer through the forecast period. Moreover, rising research activities, presence of several major players, and growing industrial sectors in the nation are creating attractive opportunities for Rheometers Market in the country.
China's position as a global industrial powerhouse is a primary factor driving the expansion of industrial sectors. This is creating the lucrative opportunities for the market growth of rheometer.
China is one of the world’s top most manufacturers and consumers of industrial equipment. It is expected to account nearly for 40% of Rheometer sales within East Asia throughout the forecast period.
China is global provider of high tech solutions owing to its competitive advantage to address the rising demand of their customers, industrial expansion in the country and its continuous investments in manufacturing to increase the production. Shift of manufacturing industry from Europe to China as a consequence of low cost manufacturing capabilities will also pave a strong growth in the market.
In 2024, India will account for nearly 25% sales in South Asia & Pacific. Various engineering industries are making considerable progress in manufacturing precision instruments and electronic equipment in countries like India owing to the government initiatives like Make in India, and Invest in India.
This is anticipated to facilitate the development of India's industrial sector. These developments also will present attractive opportunities for Rheometers sales in the country.
In polymer melting process, capillary rheometer has its origins. However, it is also directly relevant to many other material processes such as high speed coating and printing applications as it enables material flow and deformation properties to be characterized under conditions of high pressure, high shear rate and at elevated temperature.
Therefore this segment holds dominant share in the global market. Equipment based Capillary Rheometer account for nearly 40% of the market by 2035.
The offline segment is estimated to hold highest share in the Rheometers Market. In 2024, offline segment accounted for 60% of sales in the market. To an extent, sales via offline channels were facilitated by collaborations and partnership between manufacturers and institutional laboratories, as the latter purchased rheometers in bulk quantities.
According to the research, the industrial sector is projected to hold maximum share as compared to testing & certification agencies over the forecast period. In industrial segment, the polymer & rubber industry is expected to contribute maximum revenue share which is more than 15% in the global Rheometers Market owing to growing usage of polymer instead of plastic.
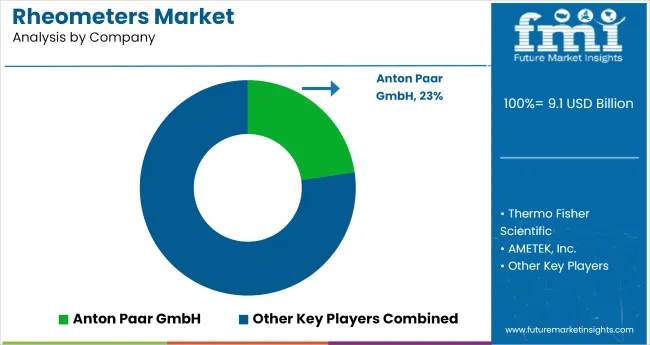
Companies operating in rheometers market are aiming at expanding their product range for precise applications for which they are investing huge in R&D activities. Also manufacturers are targeting end users by providing customized products for specific application which is enhancing their market share.
Companies are focusing on strategic collaborations and partnerships with other manufacturers to expand their product manufacturing capability and to meet the increasing demand of their customer base.
| Attribute | Details |
|---|---|
| Forecast Period | 2025 to 2035 |
| Historical Data Available for | 2020 to 2024 |
| Market Analysis | USD Million for Value and Units for Volume |
| Key Regions Covered | North America; Latin America; Europe; East Asia; South Asia & Pacific and the Middle East & Africa |
| Key Countries Covered | USA, Canada, Brazil, Mexico, Argentina, Colombia, Chile, Peru, Germany, UK, France, Italy, Spain, Russia, NORDICS, BENELUX, Hungary, Poland, Czech Republic, Switzerland, CIS States, China, Taiwan, Japan, South Korea, India, Bangladesh, ASEAN, ANZ, GCC Countries, Turkey, Israel, Iran, Nigeria, Kenya, Ghana, Northern Africa, and South Africa |
| Key Segments Covered | By Equipment type, By Sales Channel, By End User and Region |
| Key Companies Profiled | Thermo Fisher Scientific; AMETEK.Inc.; TA Instruments; Anton Paar GmbH; A&D Company; Instron Goettfert GmbH; Fann Instrument; Freeman Technology; Brabender GmbH; Cannon Instrument Company; Lamy Rheology Instruments; Shanghai Nirun Intelligent Technology Co., Ltd. |
| Report Coverage | Market Forecast, Company Share Analysis, Competition Intelligence, DROT Analysis, Market Dynamics and Challenges, and Strategic Growth Initiatives |
| Customization & Pricing | Available upon Request |
The global rheometers market is estimated to be valued at USD 9.1 billion in 2025.
The market size for the rheometers market is projected to reach USD 14.9 billion by 2035.
The rheometers market is expected to grow at a 5.1% CAGR between 2025 and 2035.
The key product types in rheometers market are rotational rheometers, capillary rheometers and oscillatory rheometers.
In terms of sales channel, offline segment to command 61.5% share in the rheometers market in 2025.


Our Research Products

The "Full Research Suite" delivers actionable market intel, deep dives on markets or technologies, so clients act faster, cut risk, and unlock growth.

The Leaderboard benchmarks and ranks top vendors, classifying them as Established Leaders, Leading Challengers, or Disruptors & Challengers.

Locates where complements amplify value and substitutes erode it, forecasting net impact by horizon

We deliver granular, decision-grade intel: market sizing, 5-year forecasts, pricing, adoption, usage, revenue, and operational KPIs—plus competitor tracking, regulation, and value chains—across 60 countries broadly.

Spot the shifts before they hit your P&L. We track inflection points, adoption curves, pricing moves, and ecosystem plays to show where demand is heading, why it is changing, and what to do next across high-growth markets and disruptive tech

Real-time reads of user behavior. We track shifting priorities, perceptions of today’s and next-gen services, and provider experience, then pace how fast tech moves from trial to adoption, blending buyer, consumer, and channel inputs with social signals (#WhySwitch, #UX).

Partner with our analyst team to build a custom report designed around your business priorities. From analysing market trends to assessing competitors or crafting bespoke datasets, we tailor insights to your needs.
Supplier Intelligence
Discovery & Profiling
Capacity & Footprint
Performance & Risk
Compliance & Governance
Commercial Readiness
Who Supplies Whom
Scorecards & Shortlists
Playbooks & Docs
Category Intelligence
Definition & Scope
Demand & Use Cases
Cost Drivers
Market Structure
Supply Chain Map
Trade & Policy
Operating Norms
Deliverables
Buyer Intelligence
Account Basics
Spend & Scope
Procurement Model
Vendor Requirements
Terms & Policies
Entry Strategy
Pain Points & Triggers
Outputs
Pricing Analysis
Benchmarks
Trends
Should-Cost
Indexation
Landed Cost
Commercial Terms
Deliverables
Brand Analysis
Positioning & Value Prop
Share & Presence
Customer Evidence
Go-to-Market
Digital & Reputation
Compliance & Trust
KPIs & Gaps
Outputs
Full Research Suite comprises of:
Market outlook & trends analysis
Interviews & case studies
Strategic recommendations
Vendor profiles & capabilities analysis
5-year forecasts
8 regions and 60+ country-level data splits
Market segment data splits
12 months of continuous data updates
DELIVERED AS:
PDF EXCEL ONLINE

Thank you!
You will receive an email from our Business Development Manager. Please be sure to check your SPAM/JUNK folder too.
Chat With
MaRIA