Ruthenium Tetroxide Market Size and Share Forecast Outlook 2025 to 2035

The ruthenium tetroxide market is valued at USD 1.6 billion in 2025 and is slated to reach USD 3.2 billion by 2035, at a CAGR of 7.3%. Its demand is driven by increasing usage in semiconductor manufacturing, chemical synthesis, and forensic applications. Growth is being observed as companies adopt ruthenium-based catalysts for specialty chemical oxidation and integrate ruthenium materials in advanced chip fabrication for improved conductivity and microcircuit performance.
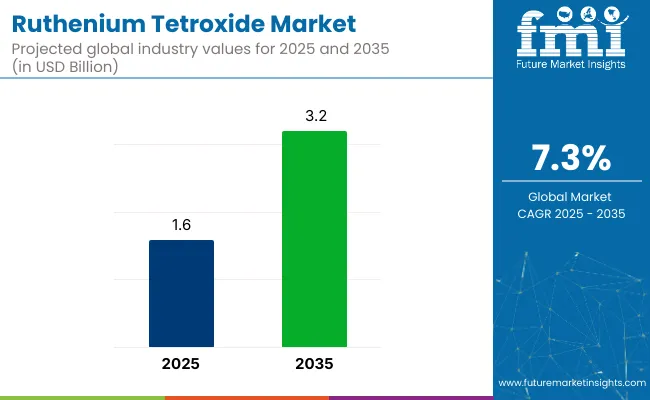
In 2025, catalyst function is expected to dominate the market with over 35% share due to its critical use in pharmaceutical oxidation processes and specialty chemical synthesis. Electronic resistors are projected to remain the largest application segment with approximately 32% market share, driven by demand from consumer electronics, 5G network components, and electric vehicle battery management systems. UK is forecasted to register the fastest growth with a CAGR of 7.7% due to strong semiconductor manufacturing investments.

Quick Stats of Ruthenium Tetroxide Market

  • Market Value (2025): USD 1.6 billion
  • Forecast Value (2035): USD 3.2 billion
  • Forecast CAGR: 7.3%
  • Leading Function in 2025:Catalyst (35% market share)
  • Top Application Segment: Electronic Resistors (32% market share)
  • Key Growth Region:Western Europe (UK fastest-growing market with 7.7% CAGR)
Metric Value
Estimated Market Size (2025) USD 1.6 Billion
Projected Market Size (2035) USD 3.2 Billion
CAGR (2025 to 2035) 7.3%

The market has been witnessing innovations focused on safer ruthenium processing, including encapsulated catalysts and stabilized compounds to mitigate toxicity and volatility risks. Research on recycling ruthenium from industrial waste streams is being advanced to ensure sustainability and reduce reliance on primary mining. These innovations are expected to enhance operational efficiency while aligning with environmental safety standards.

Ruthenium tetroxide holds an estimated 18% to 22% share in the ruthenium compounds market, primarily due to its unique oxidative and catalytic properties. Within the broader precious metal compounds market, it contributes around 6% to 8%, reflecting its niche yet critical role in specialized reactions. In the inorganic chemicals market, its share remains limited at below 1%, given the market's vast scope. It accounts for approximately 3% to 5% in the specialty chemicals market and around 4% in the chemical reagents segment, while its share in catalysts and electronics chemicals markets is estimated at 2% to 3%, largely in R&D and niche applications.

Additionally, opportunities are arising from the growing use of ruthenium tetroxide in dye-sensitized solar cells (DSSC). Its application as a light-absorbing dye in flexible and transparent solar panels is expected to gain traction due to rising demand for cost-effective renewable energy solutions. This emerging use case is being explored extensively by manufacturers aiming to enhance solar panel efficiency and market viability.

Analyzing Ruthenium Tetroxide Market by Top Investment Segments

The market is segmented into function, application, and region. By function, the market is divided into chemical intermediate, staining agent, resisting agent, catalyst, and others. Based on application, the market is categorized into electronic resistors, metal alloys, solar cells, pharmaceuticals, and others. Regionally, the market is classified into North America, Latin America, Western Europe, Eastern Europe, East Asia, South Asia Pacific, and Middle East and Africa.

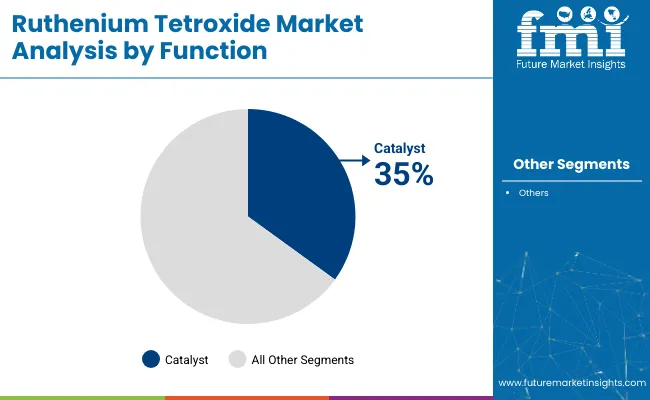
Catalyst Function to Lead with Over 35% Market Share

Catalyst function has been projected to dominate the function segment, accounting for over 35% of the global market share by 2025. Ruthenium tetroxide has been extensively used as an oxidation catalyst in pharmaceutical synthesis, aiding in complex organic reactions for antiviral and chemotherapy drugs.
  • Catalysts have been preferred for improving reaction selectivity and efficiency.
  • The function segment has supported high-purity specialty chemical manufacturing.
  • Growth has been driven by increased adoption in green oxidation processes.

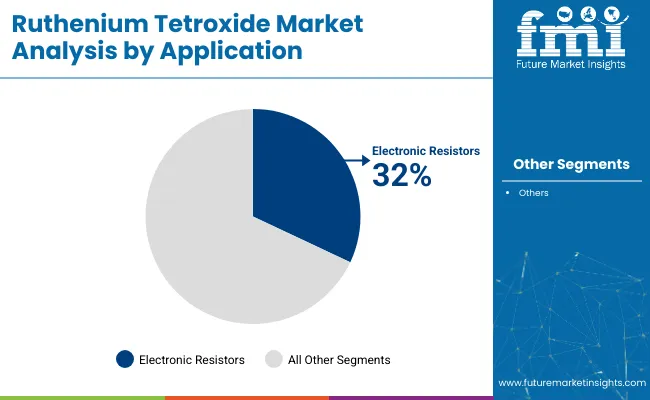
Electronic Resistors to Dominate Application with Approximately 32% Market Share

Electronic resistors are expected to lead the application segment, capturing approximately 32% market share in 2025. Ruthenium-based resistors have been widely used in consumer electronics, high-frequency telecommunications, and electric vehicles for their stable conductive properties.
  • Demand has risen due to miniaturization of electronic components.
  • High-temperature-resistant resistors have been favored in military and aviation applications.
  • Companies like Vishay and Bourns have employed ruthenium resistors in 5G and EV systems.

Top Ruthenium Tetroxide Market Dynamics

The ruthenium tetroxide market has been experiencing steady growth, driven by increasing demand for advanced semiconductor materials, specialty chemical oxidation catalysts, and forensic analysis applications.

Recent Trends in the Ruthenium Tetroxide Market

  • The adoption of ruthenium-based catalysts in green oxidation chemistry has been increasing.
  • Research into encapsulated and stabilized ruthenium compounds for safer handling has been expanded.
  • Semiconductor manufacturing is integrating ruthenium tetroxide in atomic layer deposition (ALD) and EUV lithography processes.

Challenges in the Ruthenium Tetroxide Market
  • Toxicity and volatility of ruthenium tetroxide have continued to pose handling and storage risks.
  • High production costs and regulatory requirements for safe processing have impacted market expansion.
  • Limited availability of raw materials due to the scarcity of ruthenium, creating supply chain constraints and price volatility.

Analyzing Top Countries Supplying Ruthenium Tetroxide

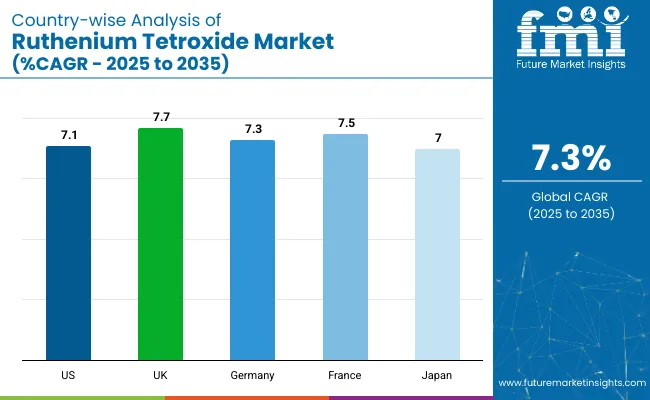
The UK leads the ruthenium tetroxide market with a projected CAGR of 7.7% from 2025 to 2035, driven by pharmaceutical synthesis, REACH compliance, and academic R&D. France follows closely at 7.5%, supported by semiconductor adoption and green oxidation technologies. Germany, with a 7.3% CAGR, benefits from a strong chemical base and semiconductor integration.

The USA market is growing at 7.1%, fueled by semiconductor and pharmaceutical demand alongside rising green chemistry investments. Japan registers a 7.0% CAGR, with growth led by semiconductor and solar cell applications. Across all countries, sustainability, advanced materials, and electronic-grade applications are key market drivers.

The report covers in-depth analysis of 40+ countries; five top-performing OECD countries are highlighted below.

USA Ruthenium Tetroxide Market Analysis

The ruthenium tetroxide demand in the USA is projected to grow at a CAGR of 7.1% from 2025 to 2035. Growth has been supported by rising demand for high-performance semiconductors, oxidation catalysts in pharmaceuticals, and forensic chemical analysis.

  • Strong semiconductor manufacturing demand for ruthenium-based etching materials.
  • Pharmaceutical synthesis applications are expanding ruthenium usage.
  • Investments in green oxidation technologies are rising.
  • Regulatory standards are focusing on safe handling and disposal.

Ruthenium Tetroxide Demand Analysis in the UK

The UK ruthenium tetroxide market is forecast to expand at a CAGR of 7.7% over the forecast period. Demand has been driven by chemical manufacturing, pharmaceutical synthesis, and increased research into eco-friendly oxidation catalysts.

  • Chemical and pharmaceutical sectors are primary users of ruthenium catalysts.
  • REACH regulations are encouraging safer catalyst development.
  • Semiconductor industry is supporting steady demand.
  • Universities and labs are researching alternative oxidation technologies.

Ruthenium Tetroxide Demand Analysis in Germany

Ruthenium tetroxide demand in Germany is projected to grow at a CAGR of 7.3% between 2025 and 2035. The nation’s strong chemical and semiconductor industries have been boosting demand for ruthenium-based materials.

  • Demand for high-purity ruthenium catalysts in pharmaceuticals is growing.
  • Semiconductor firms are integrating ruthenium in microchip fabrication.
  • Strict EU chemical safety regulations are shaping market strategies.
  • Research into ruthenium recycling is being prioritized.

France Ruthenium Tetroxide Market Analysis

France’s ruthenium tetroxide sales are expected to grow at a CAGR of 7.5% from 2025 to 2035. Growth has been supported by rising demand in pharmaceuticals, semiconductor materials, and advanced oxidation processes for specialty chemicals.

  • Strong pharmaceutical industry usage in oxidation catalysis.
  • Semiconductor firms are adopting ruthenium-based deposition materials.
  • Investments in green oxidation and sustainable catalyst technologies are increasing.
  • Regulatory frameworks are emphasizing safer handling and environmental compliance.

Ruthenium Tetroxide Sales Analysis in Japan

Ruthenium tetroxide sales in Japan are forecast to grow at a CAGR of 7.0% through 2035. Growth has been driven by semiconductor manufacturing, advanced materials, and dye-sensitized solar cells (DSSC) applications.

  • Semiconductor etching and coating technologies require ruthenium.
  • Solar cell manufacturing uses ruthenium-based dyes for efficiency.
  • High-tech chemical applications are expanding market opportunities.
  • Industry is focusing on safer handling and environmental compliance.

Leading Ruthenium Tetroxide Suppliers and Distributors

The ruthenium tetroxide market is moderately consolidated, with global leaders and niche regional producers shaping competitive dynamics through product purity, advanced manufacturing technologies, and safety-focused process innovations.

Tier-one firms, such as Hubei Jusheng Technology Co., Ltd., J&K Scientific, ESPI Metals, Krastsvetmet, American Elements, Aspira Chemicals, METAKEM GmbH, and Tokyo Chemical Industry have been focusing on high-purity catalyst production, technological R&D for safer compounds, and expanding applications in semiconductor, pharmaceutical, and material science sectors.

Ruthenium Tetroxide Market Report Scope

Report Attributes Details
Current Total Market Size (2025) USD 1.6 billion
Projected Market Size (2035) USD 3.2 billion
CAGR (2025 to 2035) 7.3%
Base Year for Estimation 2024
Historical Period 2020 to 2024
Projections Period 2025 to 2035
Market Analysis Parameters Revenue in USD billion / Volume in metric tons
By Function Chemical Intermediate, Staining Agent, Resisting Agent, Catalyst, Others
By Application Electronic Resistors, Metal Alloys, Solar Cells, Pharmaceuticals, Others
Regions Covered North America, Latin America, Western Europe, Eastern Europe, East Asia, South Asia Pacific, Middle East and Africa
Countries Covered United States, United Kingdom, Germany, France, Japan, South Korea, China, Brazil, India, Italy
Key Players Hubei Jusheng Technology Co., Ltd., J&K Scientific, ESPI Metals, Krastsvetmet , American Elements, Aspira Chemicals, METAKEM GmbH, Tokyo Chemical Industry, BOC Sciences, Henan CoreyChem .
Additional Attributes Market share analysis by function and application, country-wise CAGR analysis, and brand positioning insights

Key Segmentation

By Function:

  • Chemical Intermediate
  • Staining Agent
  • Resisting agent
  • Catalyst
  • Others

By Application:

  • Electronic resistors
  • Metal alloys
  • Solar Cells
  • Pharmaceuticals
  • Others

By Region:

  • North America
  • Latin America
  • Western Europe
  • Eastern Europe
  • East Asia
  • South Asia Pacific
  • Middle East and Africa

Table of Content

  1. Executive Summary
    • Global Market Outlook
    • Demand-side Trends
    • Supply-side Trends
    • Technology Roadmap Analysis
    • Analysis and Recommendations
  2. Market Overview
    • Market Coverage / Taxonomy
    • Market Definition / Scope / Limitations
  3. Market Background
    • Market Dynamics
      • Drivers
      • Restraints
      • Opportunity
      • Trends
    • Scenario Forecast
      • Demand in Optimistic Scenario
      • Demand in Likely Scenario
      • Demand in Conservative Scenario
    • Opportunity Map Analysis
    • Product Life Cycle Analysis
    • Supply Chain Analysis
      • Supply Side Participants and their Roles
        • Producers
        • Mid-Level Participants (Traders/ Agents/ Brokers)
        • Wholesalers and Distributors
      • Value Added and Value Created at Node in the Supply Chain
      • List of Raw Material Suppliers
      • List of Existing and Potential Buyer’s
    • Investment Feasibility Matrix
    • Value Chain Analysis
      • Profit Margin Analysis
      • Wholesalers and Distributors
      • Retailers
    • PESTLE and Porter’s Analysis
    • Regulatory Landscape
      • By Key Regions
      • By Key Countries
    • Regional Parent Market Outlook
    • Production and Consumption Statistics
    • Import and Export Statistics
  4. Global Market Analysis 2020 to 2024 and Forecast, 2025 to 2035
    • Historical Market Size Value (USD Billion) & Volume (Metric Tons) Analysis, 2020 to 2024
    • Current and Future Market Size Value (USD Billion) & Volume (Metric Tons) Projections, 2025 to 2035
      • Y-o-Y Growth Trend Analysis
      • Absolute $ Opportunity Analysis
  5. Global Market Pricing Analysis 2020 to 2024 and Forecast 2025 to 2035
  6. Global Market Analysis 2020 to 2024 and Forecast 2025 to 2035, By Function
    • Introduction / Key Findings
    • Historical Market Size Value (USD Billion) & Volume (Metric Tons) Analysis By Function, 2020 to 2024
    • Current and Future Market Size Value (USD Billion) & Volume (Metric Tons) Analysis and Forecast By Function, 2025 to 2035
      • Chemical Intermediate
      • Staining Agent
      • Resisting Agent
      • Catalyst
      • Others
    • Y-o-Y Growth Trend Analysis By Function, 2020 to 2024
    • Absolute $ Opportunity Analysis By Function, 2025 to 2035
  7. Global Market Analysis 2020 to 2024 and Forecast 2025 to 2035, By Application
    • Introduction / Key Findings
    • Historical Market Size Value (USD Billion) & Volume (Metric Tons) Analysis By Application, 2020 to 2024
    • Current and Future Market Size Value (USD Billion) & Volume (Metric Tons) Analysis and Forecast By Application, 2025 to 2035
      • Electronic Resistors
      • Metal Alloys
      • Solar Cells
      • Pharmaceuticals
      • Others
    • Y-o-Y Growth Trend Analysis By Application, 2020 to 2024
    • Absolute $ Opportunity Analysis By Application, 2025 to 2035
  8. Global Market Analysis 2020 to 2024 and Forecast 2025 to 2035, By Region
    • Introduction
    • Historical Market Size Value (USD Billion) & Volume (Metric Tons) Analysis By Region, 2020 to 2024
    • Current Market Size Value (USD Billion) & Volume (Metric Tons) Analysis and Forecast By Region, 2025 to 2035
      • North America
      • Latin America
      • Western Europe
      • Eastern Europe
      • East Asia
      • South Asia & Pacific
      • Middle East and Africa
    • Market Attractiveness Analysis By Region
  9. North America Market Analysis 2020 to 2024 and Forecast 2025 to 2035, By Country
    • Historical Market Size Value (USD Billion) & Volume (Metric Tons) Trend Analysis By Market Taxonomy, 2020 to 2024
    • Market Size Value (USD Billion) & Volume (Metric Tons) Forecast By Market Taxonomy, 2025 to 2035
      • By Country
        • USA
        • Canada
        • Mexico
      • By Function
      • By Application
    • Market Attractiveness Analysis
      • By Country
      • By Function
      • By Application
    • Key Takeaways
  10. Latin America Market Analysis 2020 to 2024 and Forecast 2025 to 2035, By Country
    • Historical Market Size Value (USD Billion) & Volume (Metric Tons) Trend Analysis By Market Taxonomy, 2020 to 2024
    • Market Size Value (USD Billion) & Volume (Metric Tons) Forecast By Market Taxonomy, 2025 to 2035
      • By Country
        • Brazil
        • Argentina
        • Rest of LATAM
      • By Function
      • By Application
    • Market Attractiveness Analysis
      • By Country
      • By Function
      • By Application
    • Key Takeaways
  11. Western Europe Market Analysis 2020 to 2024 and Forecast 2025 to 2035, By Country
    • Historical Market Size Value (USD Billion) & Volume (Metric Tons) Trend Analysis By Market Taxonomy, 2020 to 2024
    • Market Size Value (USD Billion) & Volume (Metric Tons) Forecast By Market Taxonomy, 2025 to 2035
      • By Country
        • Germany
        • Italy
        • France
        • UK
        • Spain
        • BENELUX
        • Nordic
        • Rest of W.Europe
      • By Function
      • By Application
    • Market Attractiveness Analysis
      • By Country
      • By Function
      • By Application
    • Key Takeaways
  12. Eastern Europe Market Analysis 2020 to 2024 and Forecast 2025 to 2035, By Country
    • Historical Market Size Value (USD Billion) & Volume (Metric Tons) Trend Analysis By Market Taxonomy, 2020 to 2024
    • Market Size Value (USD Billion) & Volume (Metric Tons) Forecast By Market Taxonomy, 2025 to 2035
      • By Country
        • Russia
        • Hungary
        • Poland
        • Balkan & Baltics
        • Rest of E. Europe
      • By Function
      • By Application
    • Market Attractiveness Analysis
      • By Country
      • By Function
      • By Application
    • Key Takeaways
  13. East Asia Market Analysis 2020 to 2024 and Forecast 2025 to 2035, By Country
    • Historical Market Size Value (USD Billion) & Volume (Metric Tons) Trend Analysis By Market Taxonomy, 2020 to 2024
    • Market Size Value (USD Billion) & Volume (Metric Tons) Forecast By Market Taxonomy, 2025 to 2035
      • By Country
        • China
        • Japan
        • South Korea
      • By Function
      • By Application
    • Market Attractiveness Analysis
      • By Country
      • By Function
      • By Application
    • Key Takeaways
  14. South Asia & Pacific Market Analysis 2020 to 2024 and Forecast 2025 to 2035, By Country
    • Historical Market Size Value (USD Billion) & Volume (Metric Tons) Trend Analysis By Market Taxonomy, 2020 to 2024
    • Market Size Value (USD Billion) & Volume (Metric Tons) Forecast By Market Taxonomy, 2025 to 2035
      • By Country
        • India
        • Australia & New Zealand
        • ASEAN
        • Rest of SAP
      • By Function
      • By Application
    • Market Attractiveness Analysis
      • By Country
      • By Function
      • By Application
    • Key Takeaways
  15. Middle East and Africa Market Analysis 2020 to 2024 and Forecast 2025 to 2035, By Country
    • Historical Market Size Value (USD Billion) & Volume (Metric Tons) Trend Analysis By Market Taxonomy, 2020 to 2024
    • Market Size Value (USD Billion) & Volume (Metric Tons) Forecast By Market Taxonomy, 2025 to 2035
      • By Country
        • GCC Countries
        • Northern Africa
        • South Africa
        • Turkiye
        • Rest of MEA
      • By Function
      • By Application
    • Market Attractiveness Analysis
      • By Country
      • By Function
      • By Application
    • Key Takeaways
  16. Key Countries Market Analysis
    • USA
      • Pricing Analysis
      • Market Share Analysis, 2024
        • By Function
        • By Application
    • Canada
      • Pricing Analysis
      • Market Share Analysis, 2024
        • By Function
        • By Application
    • Brazil
      • Pricing Analysis
      • Market Share Analysis, 2024
        • By Function
        • By Application
    • Mexico
      • Pricing Analysis
      • Market Share Analysis, 2024
        • By Function
        • By Application
    • Argentina
      • Pricing Analysis
      • Market Share Analysis, 2024
        • By Function
        • By Application
  17. Market Structure Analysis
    • Competition Dashboard
    • Competition Benchmarking
    • Market Share Analysis of Top Players
      • By Regional
      • By Function
      • By Application
  18. Competition Analysis
    • Competition Deep Dive
      • Hubei Jusheng Technology Co., Ltd.
        • Overview
        • Product Portfolio
        • Profitability by Market Segments (Product/Age /Sales Channel/Region)
        • Sales Footprint
        • Strategy Overview
          • Marketing Strategy
          • Product Strategy
          • Channel Strategy
      • J&K Scientific
        • Overview
        • Product Portfolio
        • Profitability by Market Segments (Product/Age /Sales Channel/Region)
        • Sales Footprint
        • Strategy Overview
          • Marketing Strategy
          • Product Strategy
          • Channel Strategy
      • ESPI Metals
        • Overview
        • Product Portfolio
        • Profitability by Market Segments (Product/Age /Sales Channel/Region)
        • Sales Footprint
        • Strategy Overview
          • Marketing Strategy
          • Product Strategy
          • Channel Strategy
      • Krastsvetmet
        • Overview
        • Product Portfolio
        • Profitability by Market Segments (Product/Age /Sales Channel/Region)
        • Sales Footprint
        • Strategy Overview
          • Marketing Strategy
          • Product Strategy
          • Channel Strategy
      • American Elements
        • Overview
        • Product Portfolio
        • Profitability by Market Segments (Product/Age /Sales Channel/Region)
        • Sales Footprint
        • Strategy Overview
          • Marketing Strategy
          • Product Strategy
          • Channel Strategy
      • Aspira Chemicals
        • Overview
        • Product Portfolio
        • Profitability by Market Segments (Product/Age /Sales Channel/Region)
        • Sales Footprint
        • Strategy Overview
          • Marketing Strategy
          • Product Strategy
          • Channel Strategy
      • METAKEM GmbH
        • Overview
        • Product Portfolio
        • Profitability by Market Segments (Product/Age /Sales Channel/Region)
        • Sales Footprint
        • Strategy Overview
          • Marketing Strategy
          • Product Strategy
          • Channel Strategy
      • Tokyo Chemical Industry
        • Overview
        • Product Portfolio
        • Profitability by Market Segments (Product/Age /Sales Channel/Region)
        • Sales Footprint
        • Strategy Overview
          • Marketing Strategy
          • Product Strategy
          • Channel Strategy
      • BOC Sciences
        • Overview
        • Product Portfolio
        • Profitability by Market Segments (Product/Age /Sales Channel/Region)
        • Sales Footprint
        • Strategy Overview
          • Marketing Strategy
          • Product Strategy
          • Channel Strategy
      • Henan CoreyChem
        • Overview
        • Product Portfolio
        • Profitability by Market Segments (Product/Age /Sales Channel/Region)
        • Sales Footprint
        • Strategy Overview
          • Marketing Strategy
          • Product Strategy
          • Channel Strategy
  19. Assumptions & Acronyms Used
  20. Research Methodology

List of Tables

  • Table 1: Global Market Value (USD Billion) Forecast by Region, 2020 to 2035
  • Table 2: Global Market Volume (Metric Tons) Forecast by Region, 2020 to 2035
  • Table 3: Global Market Value (USD Billion) Forecast by Function, 2020 to 2035
  • Table 4: Global Market Volume (Metric Tons) Forecast by Function, 2020 to 2035
  • Table 5: Global Market Value (USD Billion) Forecast by Application, 2020 to 2035
  • Table 6: Global Market Volume (Metric Tons) Forecast by Application, 2020 to 2035
  • Table 7: North America Market Value (USD Billion) Forecast by Country, 2020 to 2035
  • Table 8: North America Market Volume (Metric Tons) Forecast by Country, 2020 to 2035
  • Table 9: North America Market Value (USD Billion) Forecast by Function, 2020 to 2035
  • Table 10: North America Market Volume (Metric Tons) Forecast by Function, 2020 to 2035
  • Table 11: North America Market Value (USD Billion) Forecast by Application, 2020 to 2035
  • Table 12: North America Market Volume (Metric Tons) Forecast by Application, 2020 to 2035
  • Table 13: Latin America Market Value (USD Billion) Forecast by Country, 2020 to 2035
  • Table 14: Latin America Market Volume (Metric Tons) Forecast by Country, 2020 to 2035
  • Table 15: Latin America Market Value (USD Billion) Forecast by Function, 2020 to 2035
  • Table 16: Latin America Market Volume (Metric Tons) Forecast by Function, 2020 to 2035
  • Table 17: Latin America Market Value (USD Billion) Forecast by Application, 2020 to 2035
  • Table 18: Latin America Market Volume (Metric Tons) Forecast by Application, 2020 to 2035
  • Table 19: Western Europe Market Value (USD Billion) Forecast by Country, 2020 to 2035
  • Table 20: Western Europe Market Volume (Metric Tons) Forecast by Country, 2020 to 2035
  • Table 21: Western Europe Market Value (USD Billion) Forecast by Function, 2020 to 2035
  • Table 22: Western Europe Market Volume (Metric Tons) Forecast by Function, 2020 to 2035
  • Table 23: Western Europe Market Value (USD Billion) Forecast by Application, 2020 to 2035
  • Table 24: Western Europe Market Volume (Metric Tons) Forecast by Application, 2020 to 2035
  • Table 25: Eastern Europe Market Value (USD Billion) Forecast by Country, 2020 to 2035
  • Table 26: Eastern Europe Market Volume (Metric Tons) Forecast by Country, 2020 to 2035
  • Table 27: Eastern Europe Market Value (USD Billion) Forecast by Function, 2020 to 2035
  • Table 28: Eastern Europe Market Volume (Metric Tons) Forecast by Function, 2020 to 2035
  • Table 29: Eastern Europe Market Value (USD Billion) Forecast by Application, 2020 to 2035
  • Table 30: Eastern Europe Market Volume (Metric Tons) Forecast by Application, 2020 to 2035
  • Table 31: East Asia Market Value (USD Billion) Forecast by Country, 2020 to 2035
  • Table 32: East Asia Market Volume (Metric Tons) Forecast by Country, 2020 to 2035
  • Table 33: East Asia Market Value (USD Billion) Forecast by Function, 2020 to 2035
  • Table 34: East Asia Market Volume (Metric Tons) Forecast by Function, 2020 to 2035
  • Table 35: East Asia Market Value (USD Billion) Forecast by Application, 2020 to 2035
  • Table 36: East Asia Market Volume (Metric Tons) Forecast by Application, 2020 to 2035
  • Table 37: South Asia & Pacific Market Value (USD Billion) Forecast by Country, 2020 to 2035
  • Table 38: South Asia & Pacific Market Volume (Metric Tons) Forecast by Country, 2020 to 2035
  • Table 39: South Asia & Pacific Market Value (USD Billion) Forecast by Function, 2020 to 2035
  • Table 40: South Asia & Pacific Market Volume (Metric Tons) Forecast by Function, 2020 to 2035
  • Table 41: South Asia & Pacific Market Value (USD Billion) Forecast by Application, 2020 to 2035
  • Table 42: South Asia & Pacific Market Volume (Metric Tons) Forecast by Application, 2020 to 2035
  • Table 43: Middle East and Africa Market Value (USD Billion) Forecast by Country, 2020 to 2035
  • Table 44: Middle East and Africa Market Volume (Metric Tons) Forecast by Country, 2020 to 2035
  • Table 45: Middle East and Africa Market Value (USD Billion) Forecast by Function, 2020 to 2035
  • Table 46: Middle East and Africa Market Volume (Metric Tons) Forecast by Function, 2020 to 2035
  • Table 47: Middle East and Africa Market Value (USD Billion) Forecast by Application, 2020 to 2035
  • Table 48: Middle East and Africa Market Volume (Metric Tons) Forecast by Application, 2020 to 2035

List of Figures

  • Figure 1: Global Market Volume (Metric Tons) Forecast 2020 to 2035
  • Figure 2: Global Market Pricing Analysis
  • Figure 3: Global Market Value (USD Billion) Forecast 2020 to 2035
  • Figure 4: Global Market Value Share and BPS Analysis by Function, 2025 and 2035
  • Figure 5: Global Market Y-o-Y Growth Comparison by Function, 2025 to 2035
  • Figure 6: Global Market Attractiveness Analysis by Function
  • Figure 7: Global Market Value Share and BPS Analysis by Application, 2025 and 2035
  • Figure 8: Global Market Y-o-Y Growth Comparison by Application, 2025 to 2035
  • Figure 9: Global Market Attractiveness Analysis by Application
  • Figure 10: Global Market Value (USD Billion) Share and BPS Analysis by Region, 2025 and 2035
  • Figure 11: Global Market Y-o-Y Growth Comparison by Region, 2025 to 2035
  • Figure 12: Global Market Attractiveness Analysis by Region
  • Figure 13: North America Market Incremental $ Opportunity, 2025 to 2035
  • Figure 14: Latin America Market Incremental $ Opportunity, 2025 to 2035
  • Figure 15: Western Europe Market Incremental $ Opportunity, 2025 to 2035
  • Figure 16: Eastern Europe Market Incremental $ Opportunity, 2025 to 2035
  • Figure 17: East Asia Market Incremental $ Opportunity, 2025 to 2035
  • Figure 18: South Asia & Pacific Market Incremental $ Opportunity, 2025 to 2035
  • Figure 19: Middle East and Africa Market Incremental $ Opportunity, 2025 to 2035
  • Figure 20: North America Market Value Share and BPS Analysis by Country, 2025 and 2035
  • Figure 21: North America Market Value Share and BPS Analysis by Function, 2025 and 2035
  • Figure 22: North America Market Y-o-Y Growth Comparison by Function, 2025 to 2035
  • Figure 23: North America Market Attractiveness Analysis by Function
  • Figure 24: North America Market Value Share and BPS Analysis by Application, 2025 and 2035
  • Figure 25: North America Market Y-o-Y Growth Comparison by Application, 2025 to 2035
  • Figure 26: North America Market Attractiveness Analysis by Application
  • Figure 27: Latin America Market Value Share and BPS Analysis by Country, 2025 and 2035
  • Figure 28: Latin America Market Value Share and BPS Analysis by Function, 2025 and 2035
  • Figure 29: Latin America Market Y-o-Y Growth Comparison by Function, 2025 to 2035
  • Figure 30: Latin America Market Attractiveness Analysis by Function
  • Figure 31: Latin America Market Value Share and BPS Analysis by Application, 2025 and 2035
  • Figure 32: Latin America Market Y-o-Y Growth Comparison by Application, 2025 to 2035
  • Figure 33: Latin America Market Attractiveness Analysis by Application
  • Figure 34: Western Europe Market Value Share and BPS Analysis by Country, 2025 and 2035
  • Figure 35: Western Europe Market Value Share and BPS Analysis by Function, 2025 and 2035
  • Figure 36: Western Europe Market Y-o-Y Growth Comparison by Function, 2025 to 2035
  • Figure 37: Western Europe Market Attractiveness Analysis by Function
  • Figure 38: Western Europe Market Value Share and BPS Analysis by Application, 2025 and 2035
  • Figure 39: Western Europe Market Y-o-Y Growth Comparison by Application, 2025 to 2035
  • Figure 40: Western Europe Market Attractiveness Analysis by Application
  • Figure 41: Eastern Europe Market Value Share and BPS Analysis by Country, 2025 and 2035
  • Figure 42: Eastern Europe Market Value Share and BPS Analysis by Function, 2025 and 2035
  • Figure 43: Eastern Europe Market Y-o-Y Growth Comparison by Function, 2025 to 2035
  • Figure 44: Eastern Europe Market Attractiveness Analysis by Function
  • Figure 45: Eastern Europe Market Value Share and BPS Analysis by Application, 2025 and 2035
  • Figure 46: Eastern Europe Market Y-o-Y Growth Comparison by Application, 2025 to 2035
  • Figure 47: Eastern Europe Market Attractiveness Analysis by Application
  • Figure 48: East Asia Market Value Share and BPS Analysis by Country, 2025 and 2035
  • Figure 49: East Asia Market Value Share and BPS Analysis by Function, 2025 and 2035
  • Figure 50: East Asia Market Y-o-Y Growth Comparison by Function, 2025 to 2035
  • Figure 51: East Asia Market Attractiveness Analysis by Function
  • Figure 52: East Asia Market Value Share and BPS Analysis by Application, 2025 and 2035
  • Figure 53: East Asia Market Y-o-Y Growth Comparison by Application, 2025 to 2035
  • Figure 54: East Asia Market Attractiveness Analysis by Application
  • Figure 55: South Asia & Pacific Market Value Share and BPS Analysis by Country, 2025 and 2035
  • Figure 56: South Asia & Pacific Market Value Share and BPS Analysis by Function, 2025 and 2035
  • Figure 57: South Asia & Pacific Market Y-o-Y Growth Comparison by Function, 2025 to 2035
  • Figure 58: South Asia & Pacific Market Attractiveness Analysis by Function
  • Figure 59: South Asia & Pacific Market Value Share and BPS Analysis by Application, 2025 and 2035
  • Figure 60: South Asia & Pacific Market Y-o-Y Growth Comparison by Application, 2025 to 2035
  • Figure 61: South Asia & Pacific Market Attractiveness Analysis by Application
  • Figure 62: Middle East and Africa Market Value Share and BPS Analysis by Country, 2025 and 2035
  • Figure 63: Middle East and Africa Market Value Share and BPS Analysis by Function, 2025 and 2035
  • Figure 64: Middle East and Africa Market Y-o-Y Growth Comparison by Function, 2025 to 2035
  • Figure 65: Middle East and Africa Market Attractiveness Analysis by Function
  • Figure 66: Middle East and Africa Market Value Share and BPS Analysis by Application, 2025 and 2035
  • Figure 67: Middle East and Africa Market Y-o-Y Growth Comparison by Application, 2025 to 2035
  • Figure 68: Middle East and Africa Market Attractiveness Analysis by Application
  • Figure 69: Global Market - Tier Structure Analysis
  • Figure 70: Global Market - Company Share Analysis

Frequently Asked Questions

What is the projected size of ruthenium tetroxide market by 2035?

The market is expected to reach USD 3.2 billion by 2035.

What is the CAGR of the ruthenium tetroxide market from 2025 to 2035?

The global market is projected to grow at a CAGR of 7.3% during this period.

Which function holds the highest share in the ruthenium tetroxide market in 2025?

Catalyst function is expected to lead with over 35% market share in 2025.

What is the projected share of electronic resistors in the application segment of the ruthenium tetroxide market by 2025?

Electronic resistors are expected to hold approximately 32% of the market share in 2025.

Which country is projected to grow fastest in the ruthenium tetroxide market?

UK is anticipated to be the fastest-growing market with a CAGR of 7.7% through 2035.

Future Market Insights

Ruthenium Tetroxide Market