
- Market Size (2026)
- USD 717.4 Mn
- Forecast (2036)
- USD 1146.5 Mn
- CAGR (2026 to 2036)
- 4.8%
How big is Sandbags Market in 2026?
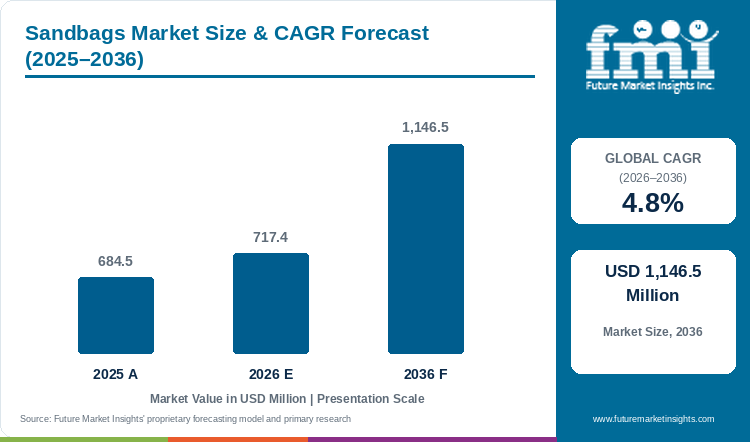
Starting from USD 684.5 million in 2025, the sandbags market valuation advanced to USD 717.4 million in 2026, with projections pointing toward USD 1,146.5 million by 2036 at a CAGR of 4.8%.
Emergency municipal flood-stockpiling budgets anchor commercial demand in the global sandbags market, where industry valuation stood at USD 684.5 million for 2025 before reaching USD 717.4 million in 2026. Global market size is forecast by FMI to hit USD 1,146.5 million by 2036, advancing at a 4.8% CAGR over the decade. UV-Stabilized Woven Polypropylene accounts for 58.6% of 2026 fabric material demand because high-tenacity 850-denier circular-woven tapes resist puncture during wet stacking. In December 2025, outdoor weathering tests in Scientific Reports confirmed that UV-stabilized polypropylene retains 96% tensile strength after 1,000 hours of solar irradiation whereas unstabilized tapes lose 42.1% of their strength. Hydrostatic burst durability separates flood-grade bags from the broader woven bags market at 4.3% CAGR, since agricultural grain sacks split under saturated sand loads. Public infrastructure allocations are accelerating multi-year tender volumes across Europe and North America. The UK Government committed GBP 1.4 billion on 17 March 2026 for 2026/27 flood defense works including GBP 260 million for post-storm barrier repairs, while Emmbi Industries expanded FY2025-26 revenue by 11.98% through technical woven polymer flood and water barriers. Municipal procurement officers award long-term framework contracts only when weaving mills certify 1,600-hour UV retention and biodegradable jute alternatives for sensitive riverbanks.
Key Market Trends & Insights
- By fabric material: UV-Stabilized Woven Polypropylene holds an estimated 58.6% share in 2026 because UV-inhibited circular-woven tapes withstand six-month outdoor embankment deployment without splitting.
- By fill status at sale: Empty Tie-String Bulk Bales represent 67.4% in 2026 as civil defense agencies warehouse flat-baled sacks in regional depots for on-site automated sand hoppers.
- By capacity class: Standard 15 kg to 25 kg Hand-Portable Sandbags account for 62.8% in 2026 because manual volunteer brigades and road crews require ergonomic lifting weights.
- By end-use application: Municipal Flood Defense and Storm Surge Control secures 43.6% in 2026 owing to mandatory river-basin levee cresting and coastal storm-surge ring barriers.
- By sales channel: Direct Municipal and Defense Agency Tenders command 54.2% in 2026 through multi-year government stockpiling frameworks and military fortification specifications.
Regional Highlights
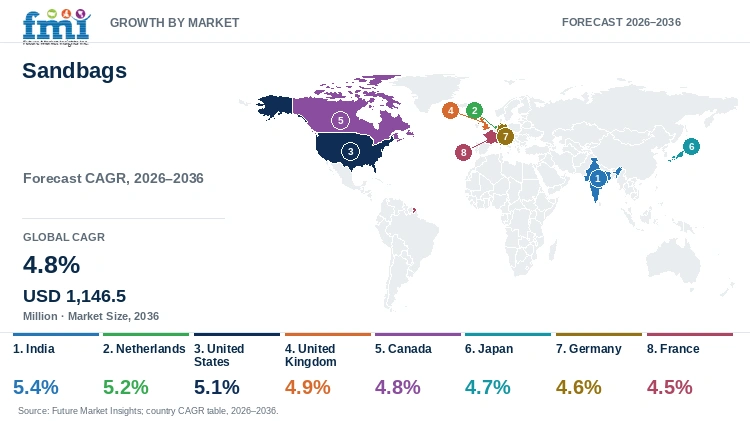
- Top national expansion: India tops country-level growth tables with a 5.4% CAGR through 2036 under monsoon river-embankment reinforcement and captive woven polypropylene and jute mill capacity.
- Broader country progression: The Netherlands records a 5.2% CAGR followed by the United States at 5.1% and the United Kingdom at 4.9%, while Canada progresses at 4.8%.
Market Size & Forecast
Table 1: Market Size and Forecast for the Sandbags Market (USD million and CAGR percentage), 2025 to 2036
| Metric | Value |
|---|---|
| 2025 Market Size | USD 684.5 million |
| Estimated Market Size in 2026 | USD 717.4 million |
| Projected Market Size by 2036 | USD 1,146.5 million |
| CAGR, 2026 to 2036 | 4.8% |
| Added Value, 2026 to 2036 | USD 429.1 million |
Municipal water boards and civil defense agencies are shifting from reactive storm purchasing to pre-season levee crest stockpiling across major alluvial river basins. When extreme rainfall overwhelms upstream reservoirs, flood peaks arrive faster than permanent concrete floodwalls can be raised and force emergency crews to build temporary sandbag crowns. A February 2026 hydrodynamic modeling study in Scientific Reports on the lower Yellow River demonstrated that 100-year flood discharges of 6000 to 10000 cubic meters per second raise river stage by 0.57 to 1.45 meters and require immediate embankment crest reinforcement. Civil protection agencies therefore procure flood-certified sacks with polypropylene woven bags and sacks to construct interlocking dike crowns within hours of flood warnings.
Contained Aggregate Tonnage and Bag Shipment Sizing
Table 2: Contained Aggregate Tonnage and Bag Shipment Sizing for the Sandbags Market (USD million and operational ranges), 2025 to 2036
| Metric | 2025 | 2026 | 2036 |
|---|---|---|---|
| Market size (USD million) | 684.5 | 717.4 | 1,146.5 |
| Contained sand & aggregate capacity across deployed bags (million metric tons) | 34.5 to 38.8 | 36.2 to 40.6 | 56.0 to 63.0 |
| Commercial sandbag & cellular barrier shipments (billion bag equivalents) | 1.82 to 2.05 | 1.90 to 2.14 | 2.95 to 3.32 |
| Average manufacturer realization per 1,000 standard bags (USD) | 335.0 to 376.0 | 336.0 to 377.5 | 345.0 to 388.0 |
Operational note on bag sizing applies standard 18 kg average dry sand fill for hand-portable bags and 1,000 kg fill for cellular FIBC flood bastions.
Riverbank toe scour and foundation piping drive continuous maintenance demand for heavy-duty sandbags even during years without catastrophic urban flooding. Wide swings between drought low-water stages and seasonal flood crests strip cohesive clay cover from river levees and expose underlying sand beds to rapid current erosion. A November 2025 geotechnical investigation in Science Advances analyzing 1656 borings across 500 kilometers of the lower Mississippi River proved that noncohesive sand layer thickness doubled from 1.5 to 3.0 meters and tripled bank erosion rates. River engineering districts deploy high-denier sandbags and heavy-duty bags and sacks along eroding revetment toes to arrest sand boils before levee failure occurs.
Per Capita & Municipal Flood Depot Allocation Sizing
Table 3: Per Capita and Municipal Depot Allocation Indicators for the Sandbags Market (USD), 2025 to 2036
| Metric | 2025 | 2026 | 2036 |
|---|---|---|---|
| World population (billion) | 8.2 | 8.3 | 9.0 |
| Valuation per 1,000 people (USD) | 83.5 | 86.4 | 127.4 |
| Annual sandbag allocation per municipal flood district (USD thousand) | 48.5 to 55.0 | 50.8 to 57.6 | 78.0 to 88.5 |
| Pre-filled & cellular rapid-deploy barrier share (%) | 31.5% to 32.2% | 32.6% | 38.5% to 41.0% |
Table 4: Emergency Management & Channel Allocation Indicators for the Sandbags Market (USD and percentages), 2026
| Metric | Value | Institutional Reference Basis |
|---|---|---|
| Market size, 2026 | USD 717.4 million | 2026 global market value baseline |
| Active municipal flood districts & highway depots | 14,100 depots | Global water boards, civil defense & DOT depots |
| Market allocation per emergency depot | USD 50,879.4 | Annualized sandbag & cellular barrier allocation |
| Direct Municipal and Defense Agency Tenders value, 2026 | USD 388.8 million | 54.2% sales channel allocation |
Post-flood cleanup regulations are pushing environmental agencies to restrict synthetic polypropylene bags along wetlands and agricultural floodplains. Manual recovery of tens of thousands of silt-covered plastic sandbags from muddy riverbanks is labor-intensive, and abandoned synthetic sacks fray into microplastic litter over subsequent seasons. A May 2025 technical assessment in the Journal of Food Science and Technology noted that global raw jute fiber output reaches 2.0 million metric tonnes annually with 99% spun into biodegradable woven sacking fabric. Watershed conservation districts specify unbleached hessian sacks from the jute bags supply chain for temporary riverbank stabilization where bags can decompose naturally in place.
Analyst Perspective
"Municipal flood engineers and highway contractors no longer view sandbags as disposable commodity sacks. Procurement specifications now separate 1,600-hour UV-stabilized polypropylene and cellular wire-mesh bastions for six-month levee protection from biodegradable hessian jute and pre-filled gravel tubes for permanent wetland and stormwater compliance."
- Nandini Roy Choudhury, Associate Vice President, Future Market Insights.
How is the sandbags market segmented?
The sandbags market is segmented by fabric material, fill status at sale, capacity class, end-use application, and sales channel. In 2026, UV-Stabilized Woven Polypropylene is projected at 58.6%, Empty Tie-String Bulk Bales at 67.4%, Standard 15 kg to 25 kg Hand-Portable Sandbags at 62.8%, Municipal Flood Defense and Storm Surge Control at 43.6%, and Direct Municipal and Defense Agency Tenders at 54.2%.
By fabric material: UV-Stabilized Woven Polypropylene, Natural Biodegradable Burlap and Hessian Jute, and Acrylic, Canvas, and Self-Inflating Polymer Gel Bags.
By fill status at sale: Empty Tie-String Bulk Bales and Pre-Filled Palletized Sand and Aggregate Bags.
By capacity class: Standard 15 kg to 25 kg Hand-Portable Sandbags, 1-Ton FIBC Flood Barrier and Military Hesco Bastions, and 5 kg to 10 kg Traffic Sign and Tent Ballast Bags.
By end-use application: Municipal Flood Defense and Storm Surge Control, Highway Work-Zone Sign Ballast and Erosion Control, Military Fortification and Civil Defense, and Pipeline Trench Weighting and Agriculture Silage.
By sales channel: Direct Municipal and Defense Agency Tenders, Construction Supply Distributors and Hardware Wholesalers, and Online Bulk Procurement Portals.
Why does UV-Stabilized Woven Polypropylene lead the fabric material category?
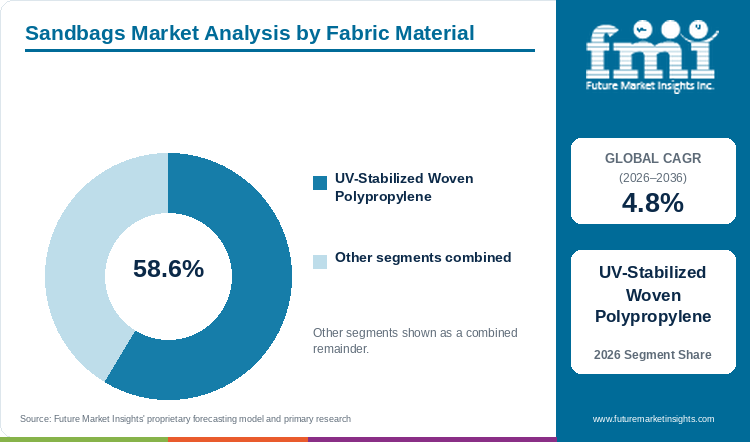
UV-Stabilized Woven Polypropylene holds an estimated 58.6% of fabric material demand in 2026, anchored by 1,600-hour UV weathering endurance and high wet burst strength.
Table 5: Fabric Material Share for the Sandbags Market (percentage share), 2026
| Fabric Material | Share (2026) |
|---|---|
| UV-Stabilized Woven Polypropylene | 58.6% |
| Other Segments Combined | 41.4%* |
| Total | 100.0% |
*Note that remaining fabric material categories account for the balance of 2026 global sandbags demand.
Table 6: Fabric Material Leadership and Market Growth for the Sandbags Market (segment and CAGR percentage), 2026 to 2036
| Metric | Value |
|---|---|
| Global CAGR (2026 to 2036) | 4.8% |
| Leading Segment | UV-Stabilized Woven Polypropylene |
Material selection in flood and construction tenders balances wet tensile strength against outdoor ultraviolet survival during multi-month levee deployments. Circular-woven polypropylene tape fabric dominates civil defense stockpiles because it resists fungal rot in waterlogged soil and delivers the lowest cost per ton of contained sand. A December 2025 composite fiber evaluation in Polymers demonstrated that reinforcing polypropylene matrices with natural jute and glass fibers lifts tensile strength from 33.60 MPa to 51.46 MPa and raises heat deflection stability to 103 degrees Celsius. Converter demand for high-tenacity raffia grades continues to spur UV-inhibitor compounding across polypropylene resins.
- UV-Stabilized Woven Polypropylene holds 58.6% of fabric material market value in 2026 because 10x10 weave density and heat-cut hemmed mouths prevent sand leakage under wave impact.
- A February 2025 climate-hazard modeling study in Geomatics Natural Hazards and Risk confirmed that intensifying probable maximum flood inflows under RCP4.5 and RCP8.5 scenarios require long-duration crest protection across high-hazard embankment dams.
What sustains Empty Tie-String Bulk Bales leadership in fill status at sale?
Empty Tie-String Bulk Bales represent 67.4% of the fill status category in 2026, supported by low-freight palletized warehouse storage and local quarry sand filling.
Freight economics explain why empty tie-string bulk bales capture more than two-thirds of commercial unit shipments while pre-filled bags remain localized around urban quarries. Long-distance transport of 20 kg of wet quarry sand inside each bag over long highway distances multiplies diesel freight bills by 6x to 10x compared with shipping flat-baled woven sacks. Emergency management agencies therefore store compressed 1,000-bag bales inside regional warehouses and fill them at local sand pits when storm warnings are issued. Rural water boards and agricultural co-ops order these compressed bales with farming sacks and totes ahead of spring snowmelt and monsoon seasons.
- Empty Tie-String Bulk Bales represent 67.4% of the fill status segment in 2026 as flat-baled sacks offer a 5-year indoor warehouse shelf life and rapid deployment with automated multi-spout sandbaggers.
- Falkirk Council launched its municipal Flood Protection Support Scheme on 25 November 2025 offering a 30% grant up to GBP 1,000 for property owners procuring sandbags and flood barriers ahead of winter storms.
How do Standard 15 kg to 25 kg Hand-Portable Sandbags lead the capacity class category?
Standard 15 kg to 25 kg Hand-Portable Sandbags account for 62.8% of capacity class volume in 2026, driven by two-person manual stacking ergonomics and tight urban seam sealing.
Access constraints along flooded residential streets and narrow basement stairwells keep hand-portable 15 kg to 25 kg bags as the primary unit class. Heavy excavators and cranes cannot maneuver inside narrow urban alleys during night-time storm surges, leaving manual two-person stacking as the only practical defense. Pliable bags filled to two-thirds capacity also mold tightly against uneven curbstones and doorway thresholds to block water seepage. Where heavy equipment can reach wide river breaches, army engineers supplement hand-portable sacks with 1-ton multi-trip woven polypropylene jumbo bags and cellular wire-mesh bastions.
- Standard 15 kg to 25 kg Hand-Portable Sandbags account for 62.8% of capacity class demand in 2026 because pliable two-thirds-filled sacks conform tightly to uneven pavement and curb contours.
- A December 2025 geotechnical review in MethodsX documented that combining modular gabion and geosynthetic-encased sand units improves embankment slope factor of safety by up to 45% while cutting settlement by over 30%.
Why does Municipal Flood Defense and Storm Surge Control lead the end-use application category?
Municipal Flood Defense and Storm Surge Control secures 43.6% of end-use application value in 2026, supported by riverine levee cresting and coastal storm-surge stockpiling.
Municipal flood defense and coastal storm-surge protection generate the largest recurring volume because floodwater-contaminated bags must be replaced after every major storm. While highway contractors reuse sign-ballast bags across multiple road-work projects, municipalities must dispose of sewage-soaked flood sandbags and restock depot inventories before the next rainy season.
- Municipal Flood Defense and Storm Surge Control captures 43.6% within the end-use application category for 2026 since coastal and riverine cities maintain mandatory pre-season buffer inventories.
- A June 2025 coastal risk modeling study in Risk Analysis found that structural coastal barrier and ring-levee systems reduce average storm-surge flood depths by 1.00 to 1.25 meters across 521 to 803 square kilometers of coastal floodplains.
What gives Direct Municipal and Defense Agency Tenders the leading position in sales channel?
Direct Municipal and Defense Agency Tenders command 54.2% of sales channel share in 2026, anchored by multi-year civil protection framework contracts and military specifications.
Public civil-defense agencies and state transportation departments purchase sandbags through multi-year direct tenders rather than retail hardware stores to guarantee surge availability and ASTM compliance. Direct framework contracts require weaving mills to certify grab tensile strength and maintain bonded warehouse reserves ready for 48-hour emergency dispatch.
- Direct Municipal and Defense Agency Tenders capture 54.2% across the sales channel category for 2026 since public civil-defense frameworks mandate certified mill test reports and bonded warehouse reserves.
- The U.S. Federal Emergency Management Agency confirmed in October 2026 allocations of USD 400 million under its FY2026 Flood Mitigation Assistance grant program with USD 600 million in Swift Current community resilience funding.
What are the drivers, restraints, and opportunities in the sandbags market?
In the sandbags market, national flood-defense capital programs and river stage volatility are projected to drive adoption whereas unstabilized polypropylene photodegradation restrains low-grade synthetic bags and biodegradable jute and self-inflating hydrogel formats unlock eco-compliant deployment.
- Driver: Record government flood-mitigation budgets and intensifying river stage volatility compel municipalities to expand pre-positioned woven polypropylene and cellular barrier stockpiles.
- Restraint: Photodegradation of unstabilized polypropylene tapes and microplastic shedding rules along protected waterways restrict low-grade synthetic bag use.
- Opportunity: Water-activated superabsorbent polymer flood sacks and biodegradable jute-hybrid fabrics unlock rapid labor-free deployment and eco-compliant erosion control.
Growth Analysis and Future Potential: Qualitative Demand Catalysts
Water authorities are combining satellite and infrared levee monitoring with pre-positioned sandbag stockpiles so maintenance crews can reinforce weak embankment zones before breaches occur. An October 2025 earthen embankment study in Scientific Reports demonstrated that infrared thermal imaging combined with deep-learning networks pinpoints localized levee seepage and ponding anomalies during high-water stages. Early seepage detection allows flood districts to deploy woven sandbag rings and engineered geosynthetics directly over active sand boils within hours.
Risk Assessment of the Sandbags Market: Operational and Formulation Friction
Stricter European polymer waste rules and microplastic restrictions represent the primary regulatory hurdle confronting synthetic woven polypropylene bag suppliers. On 6 August 2026, LC Packaging issued technical compliance guidance ahead of the 12 August 2026 entry into application of the European Union Packaging and Packaging Waste Regulation governing polymer documentation and recyclability. Municipal buyers across Europe are therefore testing low-microplastic geotextiles and technical textiles with biodegradable hessian jute sacks for riverine deployments.
Commercial Opportunity Analysis: Formulation Differentiation and Value-Add Formats
Weaving mills and regional distributors capture 4x to 8x higher unit revenue by supplying pre-filled gravel erosion socks and water-activated polymer hydrogel sacks that eliminate manual shoveling. Sandbaggy expanded its palletized pre-filled gravel and 1,600-hour UV-stabilized highway erosion control bags in January 2026 to serve department of transportation stormwater contractors. Road builders pair these heavy-duty woven gravel tubes with erosion control polymers and soil binders to stabilize highway slopes and storm-drain inlets.
Sandbags Market by Country (2026 to 2036)
FMI country modeling indicates that India leads sandbags expansion at a 5.4% CAGR through 2036, while France advances at 4.5% across riverine and coastal flood districts.
Table 7: Country CAGR and Primary Growth Levers for the Sandbags Market (CAGR percentage and operational drivers), 2026 to 2036
| Country | CAGR (2026 to 2036) | Primary Growth Lever |
|---|---|---|
| India | 5.4% | Monsoon river-embankment reinforcement and captive PP and jute sacking mill base |
| Netherlands | 5.2% | Rijkswaterstaat Room for the River 2.0 dyke upgrades and water board reserves |
| United States | 5.1% | FEMA flood mitigation grants, USACE Mississippi River depots, and DOT work zones |
| United Kingdom | 4.9% | GBP 1.4B 2026/27 Environment Agency flood program and municipal property grants |
| Canada | 4.8% | Spring snowmelt river freshet defense and Alberta pipeline trench weight bags |
| Japan | 4.7% | MLIT Class A river typhoon resilience rules and urban subway flood barriers |
| Germany | 4.6% | BBK civil protection flood exercises and DIN-certified Rhine and Elbe depots |
| France | 4.5% | River-basin flood syndicates, Atlantic coastal dune tubes, and silage weighting |
Source: Future Market Insights analysis
India Sandbags Market Outlook (2026 to 2036)
Monsoon embankment vulnerability and captive domestic weaving capacity make India the fastest-growing sandbags market at a 5.4% CAGR through 2036. Every summer monsoon season, state water resources departments across Bihar and Assam procure tens of millions of woven polypropylene and hessian jute bags to armor breaches along the Ganges and Brahmaputra rivers. Because India houses both the world's largest raw jute loom cluster in West Bengal and low-cost polypropylene raffia extruders in Gujarat, public tenders are fulfilled entirely by domestic mills. An April 2026 geotechnical study in Advanced Sensor Research demonstrated how flexible sensor-enabled geotextiles and sand containers monitor soil moisture and slope stability across monsoon-exposed embankments.
Key takeaway: In India, annual monsoon embankment reinforcement and captive polypropylene and jute weaving mills support a 5.4% CAGR through 2036.
Netherlands Sandbags Market Outlook (2026 to 2036)
Long-term delta engineering governs purchasing in the Netherlands, where flood-barrier procurement rises at a 5.2% CAGR from 2026 through 2036 across Rijkswaterstaat and 21 regional water boards. Rather than treating sandbags as improvised residential barriers, Netherlands hydraulic engineers integrate heavy-duty woven polypropylene sacks and geotextile sand containers into formal dyke-piping containment protocols. In January 2025, Rijkswaterstaat marked the 30th anniversary of the 1995 high-water evacuation by detailing ongoing Room for the River 2.0 dyke reinforcements and sand-boil ring defenses along the Waal and Rhine corridors. Water board tenders in the Netherlands demand certified UV-stabilized fabrics and traceable European polymer documentation from domestic suppliers led by Waddinxveen-based LC Packaging.
Key takeaway: In the Netherlands, Room for the River 2.0 dyke reinforcement and regional water board emergency stockpiles are expected to sustain a 5.2% CAGR.
United States Sandbags Market Outlook (2026 to 2036)
Dual-channel demand from Gulf Coast hurricane preparedness and state highway work-zone ballasting drives the United States market at a 5.1% CAGR through 2036. Municipal emergency management districts across Florida and Texas replenish millions of tie-string polypropylene and burlap bags ahead of each Atlantic hurricane season, while state transportation contractors consume gravel-filled ballast bags year-round to weight temporary road signs. United Bags updated its military-specification woven polypropylene and burlap flood sandbag catalog in September 2025 to supply high-UV-hour bulk bales to U.S. Army Corps of Engineers and municipal depots. Stormwater compliance rules under state highway permits also sustain steady contractor orders for pre-filled aggregate curb-inlet filter bags.
Key takeaway: In the United States, FEMA flood mitigation grants and Mississippi River levee reinforcement with DOT work-zone ballasting are forecast to drive a 5.1% CAGR.
United Kingdom Sandbags Market Outlook (2026 to 2036)
Decentralized council stockpiling and residential property-level flood grants shape the United Kingdom market, where sandbag valuation rises at a 4.9% annual rate across 2026 through 2036. Frequent winter cyclonic storms and rapid river-catchment runoff across England and Scotland force local authorities and water utilities to hold palletized empty bales and water-activated hydrosacks at parish depots. On 15 April 2026, Defra and the Environment Agency announced that England exceeded its national flood protection target by safeguarding hundreds of thousands of properties through upgraded embankments and rapid-deploy barriers. Utility contractors and rail network operators also maintain multi-year call-off contracts for 1-ton FIBC flood sacks to protect electrical substations.
Key takeaway: In the United Kingdom, the GBP 1.4 billion 2026/27 Environment Agency flood program and municipal property-resilience grants are anticipated to support a 4.9% CAGR.
Canada Sandbags Market Outlook (2026 to 2036)
Sub-zero freeze-thaw durability and western pipeline construction define buyer specifications in Canada, where provincial procurement advances at a 4.8% CAGR through 2036. Spring snowmelt freshets along the Red River in Manitoba and the Fraser River in western river valleys require woven polypropylene bags that do not turn brittle or split when wet sand freezes overnight at minus 20 degrees Celsius. At the same time, energy contractors across Alberta and Saskatchewan purchase non-abrasive woven sandbags to weight buried oil-and-gas pipelines inside marshy trenches without scratching epoxy pipe coatings. Edmonton-headquartered Norseman Inc. expanded its cold-weather woven polypropylene flood sandbags and pipeline trench weight containment bags in August 2025 to serve prairie and arctic infrastructure projects.
Key takeaway: In Canada, spring freshet river flood defense and western pipeline trench weighting are estimated to drive a 4.8% CAGR through 2036.
Japan Sandbags Market Outlook (2026 to 2036)
Urban underground infrastructure protection and typhoon spillway stabilization drive the market in Japan, where annual demand moves upward at a 4.7% annual pace from 2026 through 2036. Because aging municipal volunteers in coastal and mountain towns struggle to shovel heavy quarry sand during sudden typhoon downpours, city fire brigades and Tokyo and Osaka subway operators stock self-inflating polymer hydrogel flood sacks and cellular bastions at station entrances. Along steep mountain rivers, civil contractors deploy large geotextile sandbags to dissipate high-velocity spillway discharges. A July 2026 hydraulic simulation study in PLOS ONE confirmed that combining riverbank lining with 4.0-meter detention dredging and structural bank protection reduces near-bank flood velocity and impact loads by 3.5x.
Key takeaway: In Japan, MLIT river-basin typhoon resilience guidelines and urban subway self-inflating flood barrier stocks are projected to sustain a 4.7% CAGR.
Germany Sandbags Market Outlook (2026 to 2036)
Standardized federal civil-protection training and DIN-certified depot reserves anchor demand in Germany, where purchasing grows at a 4.6% CAGR through 2036 across the Rhine and Elbe basins. Following catastrophic flash floods in western river valleys, federal states in Germany and the Technisches Hilfswerk overhauled municipal sandbag logistics to ensure millions of filled and empty woven sacks can be mobilized across state borders within 12 hours. On 23 June 2026, the Federal Office of Civil Protection and Disaster Assistance marked the fifth anniversary of the Ahrtal flood by expanding joint mobile barrier and sandbag dike construction exercises across local municipalities. Autobahn construction contractors provide a steady secondary revenue stream by purchasing high-visibility woven ballast sacks for work-zone traffic beacons.
Key takeaway: In Germany, BBK civil protection stockpile expansions and standardized Rhine and Elbe dyke defense reserves are forecast to support a 4.6% CAGR.
France Sandbags Market Outlook (2026 to 2036)
Coastal dune erosion control and agricultural silage pit weighting distinguish the market in France, where departmental and farm demand increases at a 4.5% annual rate from 2026 through 2036. While municipal syndicates along the Rhone and Loire rivers stockpile standard woven polypropylene flood sacks, Atlantic coastal communes actively ban synthetic plastics on public beaches and specify biodegradable burlap or engineered geosynthetic sand containers. Dairy and livestock farms across Brittany and Normandy also consume millions of woven gravel tubes annually to seal polyethylene tarps over fermented corn silage trenches. Maccaferri expanded its MacBag geosynthetic sand containers and FlexMac gabion flood protection systems in November 2025 to support European coastal dune and riverbank stabilization tenders.
Key takeaway: In France, river-basin flood syndicates and Atlantic coastal dune protection with agricultural silage weighting are predicted to sustain a 4.5% CAGR.
Full report country CAGRs cover North America, Latin America, Western Europe, Eastern Europe, East Asia, South Asia and Pacific, and Middle East and Africa.
Who are the notable companies in the sandbags market?
Hesco Bastion Ltd, United Bags, Inc., Norseman Inc., Sandbaggy LLC, lcpackaging International B.V., Emmbi Industries Limited, Mondi plc, Maccaferri S.p.A., Berry Global Inc., and Conwed Plastics LLC are the notable companies in the sandbags market.
Competitive positioning in the sandbags industry separates cellular flood-barrier and military bastion engineers from high-volume woven polypropylene and burlap bag converters and regional erosion-control specialists.
- Cellular Flood Barrier and Defense Bastion Engineers: Hesco Bastion Ltd and Maccaferri S.p.A. manufacture collapsible wire-mesh geotextile bastions and large geosynthetic sand containers for military perimeters and river levees.
- Global and Regional Woven Polypropylene and Burlap Converters: lcpackaging International B.V., Emmbi Industries Limited, Mondi plc, and Berry Global Inc. operate integrated polymer tape extrusion and circular weaving mills.
- North America Flood, Highway, and Pipeline Bag Specialists: United Bags, Inc., Norseman Inc., Sandbaggy LLC, and Conwed Plastics LLC supply military-spec tie-string bales, pre-filled gravel bags, and pipeline trench weights.
Competitive Benchmarking: Sandbags Market
Table 8: Competitive Benchmarking for the Sandbags Market (qualitative capability ratings), 2026
| Company | Woven Tape & UV Formulation Depth | Cellular & Pre-Filled Format Range | Municipal & Military Specification Fit | Geographic Depot Reach |
|---|---|---|---|---|
| Hesco Bastion Ltd | Medium | High | High | Global defense and flood barrier footprint; Concertainer and Floodline cellular bastions |
| United Bags, Inc. | High | High | High | North America flood depot network; military-spec woven PP and burlap bulk bales |
| Norseman Inc. | High | Medium | High | Canada and US industrial fabric network; flood sandbags and pipeline trench weights |
| Sandbaggy LLC | High | High | Medium | Direct North America e-procurement and DOT network; pre-filled gravel and UV flood bags |
| lcpackaging International B.V. | High | High | High | Europe, Africa, and Asia weaving network; PPWR-compliant PP and jute flood bags |
| Emmbi Industries Limited | High | High | High | Global export network from India; 11.98% FY26 revenue growth in woven polymer barriers |
| Mondi plc | High | Medium | High | Global industrial bags footprint; heavy-duty construction and moisture-resistant sacks |
| Maccaferri S.p.A. | High | High | High | Global hydraulic engineering footprint; MacBag geosynthetic containers and FlexMac gabions |
| Berry Global Inc. | High | Medium | High | North America and Europe woven polyolefin film and heavy-duty industrial bag plants |
| Conwed Plastics LLC | High | Medium | Medium | North America extruded polymer netting and erosion-control sediment containment tubing |
Scoring basis: Woven Tape & UV Formulation Depth evaluates captive extrusion of 1,600-hour UV-stabilized PP and natural jute fabrics, Cellular & Pre-Filled Format Range assesses 1-ton bastion and pre-filled gravel offerings, Municipal & Military Specification Fit measures compliance with USACE, FEMA, and DIN flood standards, and Geographic Depot Reach reflects multi-region surge delivery.
Key Developments in the Sandbags Market
- LC Packaging International B.V. expanded its woven polypropylene and biodegradable hessian jute flood-defense and public-safety sandbag line in November 2025 to serve European water boards and civil defense depots.
- A July 2025 geotechnical field study in Scientific Reports established a 20.71% critical soil moisture instability benchmark for rain-saturated loess embankments and validated 251 kilonewton anchoring reinforcement to prevent slope slip-collapse.
- Hesco Bastion Ltd expanded deployment of its modular Floodline and Concertainer geotextile-lined wire mesh bastions in October 2025 for rapid mechanical levee cresting and military perimeter protection.
Key Players in the Sandbags Market
Cellular Flood Barrier and Defense Bastion Engineers
- Hesco Bastion Ltd
- Maccaferri S.p.A.
- Global and Regional Woven Polypropylene and Burlap Converters
- lcpackaging International B.V.
Emmbi Industries Limited
- Mondi plc
- Berry Global Inc.
- North America Flood, Highway, and Pipeline Bag Specialists
- United Bags, Inc.
Norseman Inc.
- Sandbaggy LLC
- Conwed Plastics LLC
Sandbags Market - Report Scope
Table 9: Report Scope for the Sandbags Market (coverage fields and definitions), 2026 to 2036
| Coverage field | Report scope |
|---|---|
| Market breakdown | Fabric Material; Fill Status at Sale; Capacity Class; End-Use Application; Sales Channel |
| Quantitative Units | USD Million |
| Market Definition | Includes commercial manufacturer valuation from empty and pre-filled sandbags, gravel ballast bags, water-activated self-inflating flood sacks, and collapsible cellular earth-filled flood and defense bastions manufactured from UV-stabilized woven polypropylene, burlap/hessian jute, acrylic, canvas, and non-woven geotextiles. Category Scope Note: Excludes agricultural grain and fertilizer shipping sacks, permanent poured-concrete seawalls, and metallic sheet piling. |
| Regions Covered | North America; Latin America; Western Europe; Eastern Europe; East Asia; South Asia and Pacific; Middle East and Africa |
| Countries Covered | India, Netherlands, United States, United Kingdom, Canada, Japan, Germany, France, and additional countries in the full report |
| Key Companies Covered | Hesco Bastion Ltd, United Bags, Inc., Norseman Inc., Sandbaggy LLC, lcpackaging International B.V., Emmbi Industries Limited, Mondi plc, Maccaferri S.p.A., Berry Global Inc., Conwed Plastics LLC |
| Forecast Period | 2026 to 2036 |
| Approach | Primary and secondary research with top-down and bottom-up market triangulation. |
Sandbags Market - Research Methodology
Table 10: Research Methodology for the Sandbags Market (research methods and approach), 2026 edition
| Method | Approach |
|---|---|
| Primary Research | Structured interviews with municipal flood-defense engineers, army corps emergency stockpile directors, highway work-zone contractors, and woven polypropylene and jute mill executives to verify bale pricing and tender volumes. |
| Secondary Research | Analysis of UK Defra and Environment Agency flood budgets, FEMA Flood Mitigation Assistance records, Rijkswaterstaat and Germany BBK civil protection reports, PMC hydraulic and polymer UV weathering studies, and corporate filings. |
| Market Sizing and Forecasting | Top-down global technical textile and flood-barrier expenditures reconciled against bottom-up annual sandbag shipments (1.90B to 2.14B bag equivalents in 2026) and pre-filled/cellular value multipliers from 2026 to 2036. |
| Country Forecasting Model | Econometric country projections weight national flood-defense capital budgets, river stage variability indices, highway work-zone lane-miles, and domestic jute/PP weaving capacity across eight national markets. |
| Operational Benchmark Traceability | Contained aggregate tonnage and municipal depot indicators in Tables 2, 3, and 4 trace to Scientific Reports UVA-340 tensile retention data, Science Advances river scour studies, and public agency stockpile registries. |
| Data Triangulation and Validation | Valuation estimates isolate flood, erosion, highway ballast, military fortification, and pipeline trench sandbags while strictly excluding commodity agricultural grain sacks, retail shopping totes, and permanent concrete levees. |
Sandbags Market by Segments
Sandbags Market segmented by Fabric Material:
- UV-Stabilized Woven Polypropylene
- Natural Biodegradable Burlap and Hessian Jute
- Acrylic, Canvas, and Self-Inflating Polymer Gel Bags
- Non-Woven Geotextile Polyester and Hybrid Composite Bags
Sandbags Market segmented by Fill Status at Sale:
- Empty Tie-String Bulk Bales
- Pre-Filled Palletized Sand and Aggregate Bags
- Water-Activated Self-Inflating Hydrogel Sacks
- Collapsible Multi-Cell Earth-Fill Bastions
Sandbags Market segmented by Capacity Class:
- Standard 15 kg to 25 kg Hand-Portable Sandbags
- 1-Ton FIBC Flood Barrier and Military Hesco Bastions
- 5 kg to 10 kg Traffic Sign and Tent Ballast Bags
- Above 1-Ton Geotextile Coastal Dune Tubes
- 10 kg to 15 kg Agricultural Silage Cover Gravel Tubes
Sandbags Market segmented by End-Use Application:
- Municipal Flood Defense and Storm Surge Control
- Highway Work-Zone Sign Ballast and Erosion Control
- Military Fortification and Civil Defense
- Pipeline Trench Weighting and Agriculture Silage
Sandbags Market segmented by Sales Channel:
- Direct Municipal and Defense Agency Tenders
- Construction Supply Distributors and Hardware Wholesalers
- Online Bulk Procurement Portals
- Agricultural and Geosynthetic Engineering Dealers
Sandbags Market by Region
- North America
- United States
- Canada
- Latin America
- Brazil
- Mexico
- Argentina
- Chile
- Western Europe
- Germany
- France
- United Kingdom
- Italy
- Spain
- Benelux
- Nordics
- Eastern Europe
- Poland
- Czech Republic
- Romania
- Hungary
- East Asia
- China
- Japan
- South Korea
- South Asia and Pacific
- India
- ASEAN
- Australia and New Zealand
- Middle East and Africa
- GCC Countries
- South Africa
- Türkiye
- Israel
Research Sources and Bibliography
- [1] Baafif, M., Abdo, H. S., & Albedah, A. (2025, December 28). Enhanced UV resistance of polypropylene via copper nanoparticle incorporation for outdoor applications. Scientific Reports, 16, 3951 (PMCID PMC12855964).
- [2] UK Department for Environment, Food & Rural Affairs. (2026, March 17). 1.4bn flood investment unleashed to protect homes and businesses. UK Government Environment Agency and Defra.
- [3] Emmbi Industries Limited. (2026, May 27). Investor Presentation FY 2025-26 Financial Results and Woven Polymer Barrier Operations. Emmbi Industries Limited Corporate Filings.
- [4] Chen, J., Zhang, L., & Wang, H. (2026, February 4). Evaluating flood peak attenuation effectiveness of levee management strategies in braided river reaches: a case study of the lower Yellow River. Scientific Reports, 16, 7277 (PMCID PMC12923736).
- [5] Wu, C., Kim, W., Yang, S., Tsai, F. T.-C., Nittrouer, J. A., Dong, T. Y., Keum, D., & Straub, K. M. (2025, November 28). High variability in flood discharge and stage accelerates river mobility. Science Advances, 11(48), eadv7637 (PMCID PMC12662209).
- [6] Murmu, S. B., Nayak, L. K., Lakshmanan, A., Baite, H., Nayak, D., & Biswas, P. (2025, May 10). Improved food storage in jute packaging: an assessment of the current uses, constraints, and functional enhancements of jute bags and the potential of nonconventional jute-based paper packaging. Journal of Food Science and Technology, 62(7), 1199-1212 (PMCID PMC12174033).
- [7] Ozyer, T., & Demirci, E. (2025, December 17). Evaluation of Jute-Glass Ratio Effects on the Mechanical, Thermal, and Morphological Properties of PP Hybrid Composites for Sustainable Automotive Applications. Polymers, 17(24), 3335 (PMCID PMC12736671).
- [8] Kamarudin, M. K. A., & Toriman, M. E. (2025, February 27). Overtopping risk of high-hazard embankment dam under climate change scenarios. Geomatics, Natural Hazards and Risk, 16(1), 2451890 (PMCID PMC11867341).
- [9] Falkirk Council. (2025, November 25). New flood protection support scheme launches for residential and commercial properties. Falkirk Council Municipal Flood Resilience.
- [10] Latif, D. O., Rahmadhian, V. S., & Hazhiyah, A. U. (2025, December 17). Systematic review of gabion-faced geogrid and pile systems for slope and embankment stability. MethodsX, 16, 103767 (PMCID PMC12808513).
- [11] Son, S., Xu, C., Davlasheridze, M., Ross, A. D., & Bricker, J. D. (2025, June 18). Effectiveness of the Ike Dike in mitigating coastal flood risk under multiple climate and sea level rise projections. Risk Analysis, 45(9), 2865-2894 (PMCID PMC12474534).
- [12] Federal Emergency Management Agency. (2026, October 22). Flood Mitigation Assistance Grant Program and Swift Current Funding Allocations. U.S. Department of Homeland Security, FEMA Mitigation Directorate.
- [13] Al-Sultani, A. H., & Kim, J. S. (2025, October 15). Localized identification of seepage and ponding in earthen embankments using infrared imaging and deep learning. Scientific Reports, 15, 24190 (PMCID PMC12528693).
- [14] LC Packaging International B.V. (2026, August 6). PPWR: Is your packaging documentation ready for 12 August 2026 implementation. LC Packaging International Newsroom.
- [15] Sandbaggy LLC. (2026, January 18). Pre-Filled Gravel and UV-Stabilized Flood Barrier Sandbags for Highway and Municipal Erosion Control. Sandbaggy Commercial Erosion Control Division.
- [16] Rossi, F., & Bianchi, M. (2026, April 18). Sensing the Soil with Flexible Geotextiles Sensors for Embankment and Slope Stability Monitoring. Advanced Sensor Research, 5(4), 2500112 (PMCID PMC13246488).
- [17] Rijkswaterstaat Ministry of Infrastructure and Water Management. (2025, January 30). Thirty years later: the 1995 high water evacuation and Room for the River 2.0 dyke reinforcement. Government of the Netherlands Rijkswaterstaat.
- [18] United Bags, Inc. (2025, September 22). Military Specification Woven Polypropylene and Burlap Flood Control Sandbags. United Bags Industrial and Flood Protection Catalog.
- [19] UK Department for Environment, Food & Rural Affairs. (2026, April 15). Better flood protection target exceeded across England. UK Government Environment Agency and Defra.
- [20] Norseman Inc. (2025, August 19). Heavy-Duty Woven Polypropylene Sandbags and Pipeline Trench Weight Containment. Norseman Protective Industrial Fabrics Division.
- [21] Nguyen, T. H., Tran, V. D., & Le, M. H. (2026, July 15). Numerical investigation of structural protection measures for riverbank erosion and high-velocity flood releases. PLOS ONE, 21(7), e0305418 (PMCID PMC13436742).
- [22] Bundesamt fuer Bevoelkerungsschutz und Katastrophenhilfe. (2026, June 23). Fuenf Jahre Flut Ahrtal: Civil Protection Flood Response Training and Barrier Stockpiling. Federal Republic of Germany BBK Press Office.
- [23] Maccaferri S.p.A. (2025, November 4). MacBag Geosynthetic Sand Containers and FlexMac Gabion Flood Protection Systems. Officine Maccaferri Hydraulic Works Documentation.
- [24] LC Packaging International B.V. (2025, November 12). Flood Defence and Public Safety Sandbags in Woven Polypropylene and Jute. LC Packaging Industrial Products Division.
- [25] Zhang, W., Liu, Y., & Chen, H. (2025, July 1). Study on the disaster mechanism and prevention technology of embankment slip-collapse in extreme rainfall conditions. Scientific Reports, 15, 15412 (PMCID PMC12217268).
- [26] Hesco Bastion Ltd. (2025, October 14). Hesco Floodline and Concertainer Rapid-Deploy Earth-Filled Flood and Defense Barriers. Hesco Group Technical Engineering Specifications.
- [27] Mondi plc. (2026, March 12). Industrial Bags and Heavy-Duty Flood and Construction Containment Solutions. Mondi Group Flexible Packaging and Industrial Bags.
- [28] U.S. Environmental Protection Agency. (2025, November 19). National Pollutant Discharge Elimination System (NPDES) Stormwater Construction Perimeter and Sediment Barrier Controls. U.S. EPA Office of Water.
This bibliography is provided for reader reference and is not exhaustive. The full report contains the complete reference list and detailed source annotations.
This Report Answers
- How large is the sandbags market in 2026 and what is forecast for 2036?
- Which riverine levee reinforcement and highway erosion-control mandates support demand for sandbags?
- Why does UV-Stabilized Woven Polypropylene lead the fabric material category?
- Why do Empty Tie-String Bulk Bales lead the fill status category globally?
- How do growth rates differ between India and the Netherlands as well as the United States and the United Kingdom?
- Which leading companies supply cellular military bastions versus high-volume woven polypropylene sandbags today?
- What limits outdoor UV survival or synthetic bag disposal in the sandbags market?
- What should municipal flood engineers evaluate before choosing between woven polypropylene and burlap jute or self-inflating bags?
Table of Content
- Key Takeaways
- Market Size and CAGR
- Top Growth Driver
- Fastest Growing Segment
- Leading Region
- Key Companies
- Emerging Opportunities
- Executive Summary
- Global Market Outlook
- Demand-side Trends
- Supply-side Trends
- Technology Roadmap Analysis
- Analysis and Recommendations
- Analyst Perspective (What is happening? Why now? What should investors know?)
- Key Questions Answered
- How large is the market?
- What is the CAGR?
- What are key trends?
- Which region dominates?
- Who are the leaders?
Read More...
- Market Overview
- Market Coverage / Taxonomy
- Market Definition / Scope / Limitations
- Research Methodology
- Chapter Orientation
- Analytical Lens and Working Hypotheses
- Market Structure, Signals, and Trend Drivers
- Benchmarking and Cross-market Comparability
- Market Sizing, Forecasting, and Opportunity Mapping
- Research Design and Evidence Framework
- Desk Research Programme (Secondary Evidence)
- Expert Input and Fieldwork (Primary Evidence)
- Tooling, Models, and Reference Databases
- Data Engineering and Model Build
- Quality Assurance and Audit Trail
- Market Background
- Market Dynamics (Drivers, Restraints, Opportunity, Trends)
- Scenario Forecast (Optimistic, Likely, Conservative)
- Impact Analysis
- AI Impact
- Sustainability Impact
- Regulatory Impact
- Technology Impact
- Consumer / Buyer Analysis
- Purchase Drivers
- Adoption Barriers
- Buyer Journey
- Opportunity Map Analysis
- Product Life Cycle Analysis
- Supply Chain Analysis
- Investment Feasibility Matrix
- Value Chain Analysis
- PESTLE and Porter's Analysis
- Regulatory Landscape
- Regional Parent Market Outlook
- Production and Consumption Statistics
- Import and Export Statistics
- Global Market Analysis and Forecast, 2021 to 2036
- Historical Market Size Value (USD Million) Analysis, 2021 to 2025
- Current and Future Market Size Value (USD Million) Projections, 2026 to 2036
- Y-o-Y Growth Trend Analysis
- Absolute $ Opportunity Analysis
- Global Market Pricing Analysis, 2021 to 2036
- Global Market Analysis and Forecast, By Fabric Material, 2021 to 2036
- Introduction / Key Findings
- Historical Market Size Value (USD Million) Analysis By Fabric Material, 2021 to 2025
- Current and Future Market Size Value (USD Million) Analysis and Forecast By Fabric Material, 2026 to 2036
- UV-Stabilized Woven Polypropylene
- Natural Biodegradable Burlap and Hessian Jute
- Acrylic, Canvas, and Self-Inflating Polymer Gel Bags
- Non-Woven Geotextile Polyester and Hybrid Composite Bags
- Y-o-Y Growth Trend Analysis By Fabric Material, 2021 to 2025
- Absolute $ Opportunity Analysis By Fabric Material, 2026 to 2036
- Global Market Analysis and Forecast, By Fill Status at Sale, 2021 to 2036
- Introduction / Key Findings
- Historical Market Size Value (USD Million) Analysis By Fill Status at Sale, 2021 to 2025
- Current and Future Market Size Value (USD Million) Analysis and Forecast By Fill Status at Sale, 2026 to 2036
- Empty Tie-String Bulk Bales
- Pre-Filled Palletized Sand and Aggregate Bags
- Water-Activated Self-Inflating Hydrogel Sacks
- Collapsible Multi-Cell Earth-Fill Bastions
- Y-o-Y Growth Trend Analysis By Fill Status at Sale, 2021 to 2025
- Absolute $ Opportunity Analysis By Fill Status at Sale, 2026 to 2036
- Global Market Analysis and Forecast, By Capacity Class, 2021 to 2036
- Introduction / Key Findings
- Historical Market Size Value (USD Million) Analysis By Capacity Class, 2021 to 2025
- Current and Future Market Size Value (USD Million) Analysis and Forecast By Capacity Class, 2026 to 2036
- Standard 15 kg to 25 kg Hand-Portable Sandbags
- 1-Ton FIBC Flood Barrier and Military Hesco Bastions
- 5 kg to 10 kg Traffic Sign and Tent Ballast Bags
- Above 1-Ton Geotextile Coastal Dune Tubes
- 10 kg to 15 kg Agricultural Silage Cover Gravel Tubes
- Y-o-Y Growth Trend Analysis By Capacity Class, 2021 to 2025
- Absolute $ Opportunity Analysis By Capacity Class, 2026 to 2036
- Global Market Analysis and Forecast, By End-Use Application, 2021 to 2036
- Introduction / Key Findings
- Historical Market Size Value (USD Million) Analysis By End-Use Application, 2021 to 2025
- Current and Future Market Size Value (USD Million) Analysis and Forecast By End-Use Application, 2026 to 2036
- Municipal Flood Defense and Storm Surge Control
- Highway Work-Zone Sign Ballast and Erosion Control
- Military Fortification and Civil Defense
- Pipeline Trench Weighting and Agriculture Silage
- Y-o-Y Growth Trend Analysis By End-Use Application, 2021 to 2025
- Absolute $ Opportunity Analysis By End-Use Application, 2026 to 2036
- Global Market Analysis and Forecast, By Sales Channel, 2021 to 2036
- Introduction / Key Findings
- Historical Market Size Value (USD Million) Analysis By Sales Channel, 2021 to 2025
- Current and Future Market Size Value (USD Million) Analysis and Forecast By Sales Channel, 2026 to 2036
- Direct Municipal and Defense Agency Tenders
- Construction Supply Distributors and Hardware Wholesalers
- Online Bulk Procurement Portals
- Agricultural and Geosynthetic Engineering Dealers
- Y-o-Y Growth Trend Analysis By Sales Channel, 2021 to 2025
- Absolute $ Opportunity Analysis By Sales Channel, 2026 to 2036
- Global Market Analysis and Forecast, By Region, 2021 to 2036
- Introduction
- Historical Market Size Value (USD Million) Analysis By Region, 2021 to 2025
- Current Market Size Value (USD Million) Analysis and Forecast By Region, 2026 to 2036
- North America
- Latin America
- Western Europe
- Eastern Europe
- East Asia
- South Asia and Pacific
- Middle East and Africa
- Market Attractiveness Analysis By Region
- North America Market Analysis and Forecast, By Country, 2021 to 2036
- Historical Market Size Value (USD Million) Trend Analysis By Market Taxonomy, 2021 to 2025
- Market Size Value (USD Million) Forecast By Market Taxonomy, 2026 to 2036
- By Country
- United States
- Canada
- By Fabric Material
- By Fill Status at Sale
- By Capacity Class
- By End-Use Application
- By Sales Channel
- By Country
- Market Attractiveness Analysis
- By Country
- By Fabric Material
- By Fill Status at Sale
- By Capacity Class
- By End-Use Application
- By Sales Channel
- Key Takeaways
- Latin America Market Analysis and Forecast, By Country
- Historical Market Size Value (USD Million) Trend Analysis By Market Taxonomy, 2021 to 2025
- Market Size Value (USD Million) Forecast By Market Taxonomy, 2026 to 2036
- By Country
- Brazil
- Mexico
- Argentina
- Chile
- By Fabric Material
- By Fill Status at Sale
- By Capacity Class
- By End-Use Application
- By Sales Channel
- By Country
- Market Attractiveness Analysis
- By Country
- By Fabric Material
- By Fill Status at Sale
- By Capacity Class
- By End-Use Application
- By Sales Channel
- Key Takeaways
- Western Europe Market Analysis and Forecast, By Country
- Historical Market Size Value (USD Million) Trend Analysis By Market Taxonomy, 2021 to 2025
- Market Size Value (USD Million) Forecast By Market Taxonomy, 2026 to 2036
- By Country
- Germany
- France
- United Kingdom
- Italy
- Spain
- Benelux
- Nordics
- By Fabric Material
- By Fill Status at Sale
- By Capacity Class
- By End-Use Application
- By Sales Channel
- By Country
- Market Attractiveness Analysis
- By Country
- By Fabric Material
- By Fill Status at Sale
- By Capacity Class
- By End-Use Application
- By Sales Channel
- Key Takeaways
- Eastern Europe Market Analysis and Forecast, By Country
- Historical Market Size Value (USD Million) Trend Analysis By Market Taxonomy, 2021 to 2025
- Market Size Value (USD Million) Forecast By Market Taxonomy, 2026 to 2036
- By Country
- Poland
- Czech Republic
- Romania
- Hungary
- By Fabric Material
- By Fill Status at Sale
- By Capacity Class
- By End-Use Application
- By Sales Channel
- By Country
- Market Attractiveness Analysis
- By Country
- By Fabric Material
- By Fill Status at Sale
- By Capacity Class
- By End-Use Application
- By Sales Channel
- Key Takeaways
- East Asia Market Analysis and Forecast, By Country
- Historical Market Size Value (USD Million) Trend Analysis By Market Taxonomy, 2021 to 2025
- Market Size Value (USD Million) Forecast By Market Taxonomy, 2026 to 2036
- By Country
- China
- Japan
- South Korea
- By Fabric Material
- By Fill Status at Sale
- By Capacity Class
- By End-Use Application
- By Sales Channel
- By Country
- Market Attractiveness Analysis
- By Country
- By Fabric Material
- By Fill Status at Sale
- By Capacity Class
- By End-Use Application
- By Sales Channel
- Key Takeaways
- South Asia and Pacific Market Analysis and Forecast, By Country
- Historical Market Size Value (USD Million) Trend Analysis By Market Taxonomy, 2021 to 2025
- Market Size Value (USD Million) Forecast By Market Taxonomy, 2026 to 2036
- By Country
- India
- ASEAN
- Australia and New Zealand
- By Fabric Material
- By Fill Status at Sale
- By Capacity Class
- By End-Use Application
- By Sales Channel
- By Country
- Market Attractiveness Analysis
- By Country
- By Fabric Material
- By Fill Status at Sale
- By Capacity Class
- By End-Use Application
- By Sales Channel
- Key Takeaways
- Middle East and Africa Market Analysis and Forecast, By Country
- Historical Market Size Value (USD Million) Trend Analysis By Market Taxonomy, 2021 to 2025
- Market Size Value (USD Million) Forecast By Market Taxonomy, 2026 to 2036
- By Country
- GCC Countries
- South Africa
- Türkiye
- Israel
- By Fabric Material
- By Fill Status at Sale
- By Capacity Class
- By End-Use Application
- By Sales Channel
- By Country
- Market Attractiveness Analysis
- By Country
- By Fabric Material
- By Fill Status at Sale
- By Capacity Class
- By End-Use Application
- By Sales Channel
- Key Takeaways
- Key Countries Market Analysis
- United States
- Pricing Analysis
- Market Share Analysis, 2025
- By Fabric Material
- By Fill Status at Sale
- By Capacity Class
- By End-Use Application
- By Sales Channel
- Canada
- Pricing Analysis
- Market Share Analysis, 2025
- By Fabric Material
- By Fill Status at Sale
- By Capacity Class
- By End-Use Application
- By Sales Channel
- Mexico
- Pricing Analysis
- Market Share Analysis, 2025
- By Fabric Material
- By Fill Status at Sale
- By Capacity Class
- By End-Use Application
- By Sales Channel
- Brazil
- Pricing Analysis
- Market Share Analysis, 2025
- By Fabric Material
- By Fill Status at Sale
- By Capacity Class
- By End-Use Application
- By Sales Channel
- Chile
- Pricing Analysis
- Market Share Analysis, 2025
- By Fabric Material
- By Fill Status at Sale
- By Capacity Class
- By End-Use Application
- By Sales Channel
- Germany
- Pricing Analysis
- Market Share Analysis, 2025
- By Fabric Material
- By Fill Status at Sale
- By Capacity Class
- By End-Use Application
- By Sales Channel
- United Kingdom
- Pricing Analysis
- Market Share Analysis, 2025
- By Fabric Material
- By Fill Status at Sale
- By Capacity Class
- By End-Use Application
- By Sales Channel
- Italy
- Pricing Analysis
- Market Share Analysis, 2025
- By Fabric Material
- By Fill Status at Sale
- By Capacity Class
- By End-Use Application
- By Sales Channel
- Spain
- Pricing Analysis
- Market Share Analysis, 2025
- By Fabric Material
- By Fill Status at Sale
- By Capacity Class
- By End-Use Application
- By Sales Channel
- France
- Pricing Analysis
- Market Share Analysis, 2025
- By Fabric Material
- By Fill Status at Sale
- By Capacity Class
- By End-Use Application
- By Sales Channel
- India
- Pricing Analysis
- Market Share Analysis, 2025
- By Fabric Material
- By Fill Status at Sale
- By Capacity Class
- By End-Use Application
- By Sales Channel
- ASEAN
- Pricing Analysis
- Market Share Analysis, 2025
- By Fabric Material
- By Fill Status at Sale
- By Capacity Class
- By End-Use Application
- By Sales Channel
- Australia and New Zealand
- Pricing Analysis
- Market Share Analysis, 2025
- By Fabric Material
- By Fill Status at Sale
- By Capacity Class
- By End-Use Application
- By Sales Channel
- China
- Pricing Analysis
- Market Share Analysis, 2025
- By Fabric Material
- By Fill Status at Sale
- By Capacity Class
- By End-Use Application
- By Sales Channel
- Japan
- Pricing Analysis
- Market Share Analysis, 2025
- By Fabric Material
- By Fill Status at Sale
- By Capacity Class
- By End-Use Application
- By Sales Channel
- South Korea
- Pricing Analysis
- Market Share Analysis, 2025
- By Fabric Material
- By Fill Status at Sale
- By Capacity Class
- By End-Use Application
- By Sales Channel
- Poland
- Pricing Analysis
- Market Share Analysis, 2025
- By Fabric Material
- By Fill Status at Sale
- By Capacity Class
- By End-Use Application
- By Sales Channel
- Hungary
- Pricing Analysis
- Market Share Analysis, 2025
- By Fabric Material
- By Fill Status at Sale
- By Capacity Class
- By End-Use Application
- By Sales Channel
- Türkiye
- Pricing Analysis
- Market Share Analysis, 2025
- By Fabric Material
- By Fill Status at Sale
- By Capacity Class
- By End-Use Application
- By Sales Channel
- South Africa
- Pricing Analysis
- Market Share Analysis, 2025
- By Fabric Material
- By Fill Status at Sale
- By Capacity Class
- By End-Use Application
- By Sales Channel
- Netherlands
- Pricing Analysis
- Market Share Analysis, 2025
- By Fabric Material
- By Fill Status at Sale
- By Capacity Class
- By End-Use Application
- By Sales Channel
- United States
- Market Structure Analysis
- Competition Dashboard
- Competition Benchmarking
- Market Share Analysis of Top Players
- By Regional
- By Fabric Material
- By Fill Status at Sale
- By Capacity Class
- By End-Use Application
- By Sales Channel
- Emerging Startups
- Innovation Benchmarking
- Competition Analysis
- Competition Deep Dive
- Hesco Bastion Ltd
- Overview
- Product Portfolio
- Profitability by Market Segments
- Sales Footprint
- Strategy Overview
- Marketing Strategy
- Product Strategy
- Channel Strategy
- United Bags, Inc.
- Norseman Inc.
- Sandbaggy LLC
- lcpackaging International B.V.
- Emmbi Industries Limited
- Mondi plc
- Maccaferri S.p.A.
- Berry Global Inc.
- Conwed Plastics LLC
- Global and Regional Woven Polypropylene and Burlap Converters
- North America Flood, Highway, and Pipeline Bag Specialists
- Hesco Bastion Ltd
- Case Studies
- Success Stories
- Recent Developments
- Competition Deep Dive
- Assumptions & Acronyms Used
List of Tables
- Table 1: Global Market Value (USD Million) Forecast by Region, 2021 to 2036
- Table 2: Global Market Value (USD Million) Forecast by Fabric Material, 2021 to 2036
- Table 3: Global Market Value (USD Million) Forecast by Fill Status at Sale, 2021 to 2036
- Table 4: Global Market Value (USD Million) Forecast by Capacity Class, 2021 to 2036
- Table 5: Global Market Value (USD Million) Forecast by End-Use Application, 2021 to 2036
- Table 6: Global Market Value (USD Million) Forecast by Sales Channel, 2021 to 2036
- Table 7: North America Market Value (USD Million) Forecast by Country, 2021 to 2036
- Table 8: North America Market Value (USD Million) Forecast by Fabric Material, 2021 to 2036
- Table 9: North America Market Value (USD Million) Forecast by Fill Status at Sale, 2021 to 2036
- Table 10: North America Market Value (USD Million) Forecast by Capacity Class, 2021 to 2036
- Table 11: North America Market Value (USD Million) Forecast by End-Use Application, 2021 to 2036
- Table 12: North America Market Value (USD Million) Forecast by Sales Channel, 2021 to 2036
- Table 13: Latin America Market Value (USD Million) Forecast by Country, 2021 to 2036
- Table 14: Latin America Market Value (USD Million) Forecast by Fabric Material, 2021 to 2036
- Table 15: Latin America Market Value (USD Million) Forecast by Fill Status at Sale, 2021 to 2036
- Table 16: Latin America Market Value (USD Million) Forecast by Capacity Class, 2021 to 2036
- Table 17: Latin America Market Value (USD Million) Forecast by End-Use Application, 2021 to 2036
- Table 18: Latin America Market Value (USD Million) Forecast by Sales Channel, 2021 to 2036
- Table 19: Western Europe Market Value (USD Million) Forecast by Country, 2021 to 2036
- Table 20: Western Europe Market Value (USD Million) Forecast by Fabric Material, 2021 to 2036
- Table 21: Western Europe Market Value (USD Million) Forecast by Fill Status at Sale, 2021 to 2036
- Table 22: Western Europe Market Value (USD Million) Forecast by Capacity Class, 2021 to 2036
- Table 23: Western Europe Market Value (USD Million) Forecast by End-Use Application, 2021 to 2036
- Table 24: Western Europe Market Value (USD Million) Forecast by Sales Channel, 2021 to 2036
- Table 25: Eastern Europe Market Value (USD Million) Forecast by Country, 2021 to 2036
- Table 26: Eastern Europe Market Value (USD Million) Forecast by Fabric Material, 2021 to 2036
- Table 27: Eastern Europe Market Value (USD Million) Forecast by Fill Status at Sale, 2021 to 2036
- Table 28: Eastern Europe Market Value (USD Million) Forecast by Capacity Class, 2021 to 2036
- Table 29: Eastern Europe Market Value (USD Million) Forecast by End-Use Application, 2021 to 2036
- Table 30: Eastern Europe Market Value (USD Million) Forecast by Sales Channel, 2021 to 2036
- Table 31: East Asia Market Value (USD Million) Forecast by Country, 2021 to 2036
- Table 32: East Asia Market Value (USD Million) Forecast by Fabric Material, 2021 to 2036
- Table 33: East Asia Market Value (USD Million) Forecast by Fill Status at Sale, 2021 to 2036
- Table 34: East Asia Market Value (USD Million) Forecast by Capacity Class, 2021 to 2036
- Table 35: East Asia Market Value (USD Million) Forecast by End-Use Application, 2021 to 2036
- Table 36: East Asia Market Value (USD Million) Forecast by Sales Channel, 2021 to 2036
- Table 37: South Asia and Pacific Market Value (USD Million) Forecast by Country, 2021 to 2036
- Table 38: South Asia and Pacific Market Value (USD Million) Forecast by Fabric Material, 2021 to 2036
- Table 39: South Asia and Pacific Market Value (USD Million) Forecast by Fill Status at Sale, 2021 to 2036
- Table 40: South Asia and Pacific Market Value (USD Million) Forecast by Capacity Class, 2021 to 2036
- Table 41: South Asia and Pacific Market Value (USD Million) Forecast by End-Use Application, 2021 to 2036
- Table 42: South Asia and Pacific Market Value (USD Million) Forecast by Sales Channel, 2021 to 2036
- Table 43: Middle East and Africa Market Value (USD Million) Forecast by Country, 2021 to 2036
- Table 44: Middle East and Africa Market Value (USD Million) Forecast by Fabric Material, 2021 to 2036
- Table 45: Middle East and Africa Market Value (USD Million) Forecast by Fill Status at Sale, 2021 to 2036
- Table 46: Middle East and Africa Market Value (USD Million) Forecast by Capacity Class, 2021 to 2036
- Table 47: Middle East and Africa Market Value (USD Million) Forecast by End-Use Application, 2021 to 2036
- Table 48: Middle East and Africa Market Value (USD Million) Forecast by Sales Channel, 2021 to 2036
List of Figures
- Figure 1: Global Market Pricing Analysis
- Figure 2: Global Market Value (USD Million) Forecast 2021-2036
- Figure 3: Global Market Value Share and BPS Analysis by Fabric Material, 2026 and 2036
- Figure 4: Global Market Y-o-Y Growth Comparison by Fabric Material, 2026-2036
- Figure 5: Global Market Attractiveness Analysis by Fabric Material
- Figure 6: Global Market Value Share and BPS Analysis by Fill Status at Sale, 2026 and 2036
- Figure 7: Global Market Y-o-Y Growth Comparison by Fill Status at Sale, 2026-2036
- Figure 8: Global Market Attractiveness Analysis by Fill Status at Sale
- Figure 9: Global Market Value Share and BPS Analysis by Capacity Class, 2026 and 2036
- Figure 10: Global Market Y-o-Y Growth Comparison by Capacity Class, 2026-2036
- Figure 11: Global Market Attractiveness Analysis by Capacity Class
- Figure 12: Global Market Value Share and BPS Analysis by End-Use Application, 2026 and 2036
- Figure 13: Global Market Y-o-Y Growth Comparison by End-Use Application, 2026-2036
- Figure 14: Global Market Attractiveness Analysis by End-Use Application
- Figure 15: Global Market Value Share and BPS Analysis by Sales Channel, 2026 and 2036
- Figure 16: Global Market Y-o-Y Growth Comparison by Sales Channel, 2026-2036
- Figure 17: Global Market Attractiveness Analysis by Sales Channel
- Figure 18: Global Market Value (USD Million) Share and BPS Analysis by Region, 2026 and 2036
- Figure 19: Global Market Y-o-Y Growth Comparison by Region, 2026-2036
- Figure 20: Global Market Attractiveness Analysis by Region
- Figure 21: North America Market Incremental Dollar Opportunity, 2026-2036
- Figure 22: Latin America Market Incremental Dollar Opportunity, 2026-2036
- Figure 23: Western Europe Market Incremental Dollar Opportunity, 2026-2036
- Figure 24: Eastern Europe Market Incremental Dollar Opportunity, 2026-2036
- Figure 25: East Asia Market Incremental Dollar Opportunity, 2026-2036
- Figure 26: South Asia and Pacific Market Incremental Dollar Opportunity, 2026-2036
- Figure 27: Middle East and Africa Market Incremental Dollar Opportunity, 2026-2036
- Figure 28: North America Market Value Share and BPS Analysis by Country, 2026 and 2036
- Figure 29: North America Market Value Share and BPS Analysis by Fabric Material, 2026 and 2036
- Figure 30: North America Market Y-o-Y Growth Comparison by Fabric Material, 2026-2036
- Figure 31: North America Market Attractiveness Analysis by Fabric Material
- Figure 32: North America Market Value Share and BPS Analysis by Fill Status at Sale, 2026 and 2036
- Figure 33: North America Market Y-o-Y Growth Comparison by Fill Status at Sale, 2026-2036
- Figure 34: North America Market Attractiveness Analysis by Fill Status at Sale
- Figure 35: North America Market Value Share and BPS Analysis by Capacity Class, 2026 and 2036
- Figure 36: North America Market Y-o-Y Growth Comparison by Capacity Class, 2026-2036
- Figure 37: North America Market Attractiveness Analysis by Capacity Class
- Figure 38: North America Market Value Share and BPS Analysis by End-Use Application, 2026 and 2036
- Figure 39: North America Market Y-o-Y Growth Comparison by End-Use Application, 2026-2036
- Figure 40: North America Market Attractiveness Analysis by End-Use Application
- Figure 41: North America Market Value Share and BPS Analysis by Sales Channel, 2026 and 2036
- Figure 42: North America Market Y-o-Y Growth Comparison by Sales Channel, 2026-2036
- Figure 43: North America Market Attractiveness Analysis by Sales Channel
- Figure 44: Latin America Market Value Share and BPS Analysis by Country, 2026 and 2036
- Figure 45: Latin America Market Value Share and BPS Analysis by Fabric Material, 2026 and 2036
- Figure 46: Latin America Market Y-o-Y Growth Comparison by Fabric Material, 2026-2036
- Figure 47: Latin America Market Attractiveness Analysis by Fabric Material
- Figure 48: Latin America Market Value Share and BPS Analysis by Fill Status at Sale, 2026 and 2036
- Figure 49: Latin America Market Y-o-Y Growth Comparison by Fill Status at Sale, 2026-2036
- Figure 50: Latin America Market Attractiveness Analysis by Fill Status at Sale
- Figure 51: Latin America Market Value Share and BPS Analysis by Capacity Class, 2026 and 2036
- Figure 52: Latin America Market Y-o-Y Growth Comparison by Capacity Class, 2026-2036
- Figure 53: Latin America Market Attractiveness Analysis by Capacity Class
- Figure 54: Latin America Market Value Share and BPS Analysis by End-Use Application, 2026 and 2036
- Figure 55: Latin America Market Y-o-Y Growth Comparison by End-Use Application, 2026-2036
- Figure 56: Latin America Market Attractiveness Analysis by End-Use Application
- Figure 57: Latin America Market Value Share and BPS Analysis by Sales Channel, 2026 and 2036
- Figure 58: Latin America Market Y-o-Y Growth Comparison by Sales Channel, 2026-2036
- Figure 59: Latin America Market Attractiveness Analysis by Sales Channel
- Figure 60: Western Europe Market Value Share and BPS Analysis by Country, 2026 and 2036
- Figure 61: Western Europe Market Value Share and BPS Analysis by Fabric Material, 2026 and 2036
- Figure 62: Western Europe Market Y-o-Y Growth Comparison by Fabric Material, 2026-2036
- Figure 63: Western Europe Market Attractiveness Analysis by Fabric Material
- Figure 64: Western Europe Market Value Share and BPS Analysis by Fill Status at Sale, 2026 and 2036
- Figure 65: Western Europe Market Y-o-Y Growth Comparison by Fill Status at Sale, 2026-2036
- Figure 66: Western Europe Market Attractiveness Analysis by Fill Status at Sale
- Figure 67: Western Europe Market Value Share and BPS Analysis by Capacity Class, 2026 and 2036
- Figure 68: Western Europe Market Y-o-Y Growth Comparison by Capacity Class, 2026-2036
- Figure 69: Western Europe Market Attractiveness Analysis by Capacity Class
- Figure 70: Western Europe Market Value Share and BPS Analysis by End-Use Application, 2026 and 2036
- Figure 71: Western Europe Market Y-o-Y Growth Comparison by End-Use Application, 2026-2036
- Figure 72: Western Europe Market Attractiveness Analysis by End-Use Application
- Figure 73: Western Europe Market Value Share and BPS Analysis by Sales Channel, 2026 and 2036
- Figure 74: Western Europe Market Y-o-Y Growth Comparison by Sales Channel, 2026-2036
- Figure 75: Western Europe Market Attractiveness Analysis by Sales Channel
- Figure 76: Eastern Europe Market Value Share and BPS Analysis by Country, 2026 and 2036
- Figure 77: Eastern Europe Market Value Share and BPS Analysis by Fabric Material, 2026 and 2036
- Figure 78: Eastern Europe Market Y-o-Y Growth Comparison by Fabric Material, 2026-2036
- Figure 79: Eastern Europe Market Attractiveness Analysis by Fabric Material
- Figure 80: Eastern Europe Market Value Share and BPS Analysis by Fill Status at Sale, 2026 and 2036
- Figure 81: Eastern Europe Market Y-o-Y Growth Comparison by Fill Status at Sale, 2026-2036
- Figure 82: Eastern Europe Market Attractiveness Analysis by Fill Status at Sale
- Figure 83: Eastern Europe Market Value Share and BPS Analysis by Capacity Class, 2026 and 2036
- Figure 84: Eastern Europe Market Y-o-Y Growth Comparison by Capacity Class, 2026-2036
- Figure 85: Eastern Europe Market Attractiveness Analysis by Capacity Class
- Figure 86: Eastern Europe Market Value Share and BPS Analysis by End-Use Application, 2026 and 2036
- Figure 87: Eastern Europe Market Y-o-Y Growth Comparison by End-Use Application, 2026-2036
- Figure 88: Eastern Europe Market Attractiveness Analysis by End-Use Application
- Figure 89: Eastern Europe Market Value Share and BPS Analysis by Sales Channel, 2026 and 2036
- Figure 90: Eastern Europe Market Y-o-Y Growth Comparison by Sales Channel, 2026-2036
- Figure 91: Eastern Europe Market Attractiveness Analysis by Sales Channel
- Figure 92: East Asia Market Value Share and BPS Analysis by Country, 2026 and 2036
- Figure 93: East Asia Market Value Share and BPS Analysis by Fabric Material, 2026 and 2036
- Figure 94: East Asia Market Y-o-Y Growth Comparison by Fabric Material, 2026-2036
- Figure 95: East Asia Market Attractiveness Analysis by Fabric Material
- Figure 96: East Asia Market Value Share and BPS Analysis by Fill Status at Sale, 2026 and 2036
- Figure 97: East Asia Market Y-o-Y Growth Comparison by Fill Status at Sale, 2026-2036
- Figure 98: East Asia Market Attractiveness Analysis by Fill Status at Sale
- Figure 99: East Asia Market Value Share and BPS Analysis by Capacity Class, 2026 and 2036
- Figure 100: East Asia Market Y-o-Y Growth Comparison by Capacity Class, 2026-2036
- Figure 101: East Asia Market Attractiveness Analysis by Capacity Class
- Figure 102: East Asia Market Value Share and BPS Analysis by End-Use Application, 2026 and 2036
- Figure 103: East Asia Market Y-o-Y Growth Comparison by End-Use Application, 2026-2036
- Figure 104: East Asia Market Attractiveness Analysis by End-Use Application
- Figure 105: East Asia Market Value Share and BPS Analysis by Sales Channel, 2026 and 2036
- Figure 106: East Asia Market Y-o-Y Growth Comparison by Sales Channel, 2026-2036
- Figure 107: East Asia Market Attractiveness Analysis by Sales Channel
- Figure 108: South Asia and Pacific Market Value Share and BPS Analysis by Country, 2026 and 2036
- Figure 109: South Asia and Pacific Market Value Share and BPS Analysis by Fabric Material, 2026 and 2036
- Figure 110: South Asia and Pacific Market Y-o-Y Growth Comparison by Fabric Material, 2026-2036
- Figure 111: South Asia and Pacific Market Attractiveness Analysis by Fabric Material
- Figure 112: South Asia and Pacific Market Value Share and BPS Analysis by Fill Status at Sale, 2026 and 2036
- Figure 113: South Asia and Pacific Market Y-o-Y Growth Comparison by Fill Status at Sale, 2026-2036
- Figure 114: South Asia and Pacific Market Attractiveness Analysis by Fill Status at Sale
- Figure 115: South Asia and Pacific Market Value Share and BPS Analysis by Capacity Class, 2026 and 2036
- Figure 116: South Asia and Pacific Market Y-o-Y Growth Comparison by Capacity Class, 2026-2036
- Figure 117: South Asia and Pacific Market Attractiveness Analysis by Capacity Class
- Figure 118: South Asia and Pacific Market Value Share and BPS Analysis by End-Use Application, 2026 and 2036
- Figure 119: South Asia and Pacific Market Y-o-Y Growth Comparison by End-Use Application, 2026-2036
- Figure 120: South Asia and Pacific Market Attractiveness Analysis by End-Use Application
- Figure 121: South Asia and Pacific Market Value Share and BPS Analysis by Sales Channel, 2026 and 2036
- Figure 122: South Asia and Pacific Market Y-o-Y Growth Comparison by Sales Channel, 2026-2036
- Figure 123: South Asia and Pacific Market Attractiveness Analysis by Sales Channel
- Figure 124: Middle East and Africa Market Value Share and BPS Analysis by Country, 2026 and 2036
- Figure 125: Middle East and Africa Market Value Share and BPS Analysis by Fabric Material, 2026 and 2036
- Figure 126: Middle East and Africa Market Y-o-Y Growth Comparison by Fabric Material, 2026-2036
- Figure 127: Middle East and Africa Market Attractiveness Analysis by Fabric Material
- Figure 128: Middle East and Africa Market Value Share and BPS Analysis by Fill Status at Sale, 2026 and 2036
- Figure 129: Middle East and Africa Market Y-o-Y Growth Comparison by Fill Status at Sale, 2026-2036
- Figure 130: Middle East and Africa Market Attractiveness Analysis by Fill Status at Sale
- Figure 131: Middle East and Africa Market Value Share and BPS Analysis by Capacity Class, 2026 and 2036
- Figure 132: Middle East and Africa Market Y-o-Y Growth Comparison by Capacity Class, 2026-2036
- Figure 133: Middle East and Africa Market Attractiveness Analysis by Capacity Class
- Figure 134: Middle East and Africa Market Value Share and BPS Analysis by End-Use Application, 2026 and 2036
- Figure 135: Middle East and Africa Market Y-o-Y Growth Comparison by End-Use Application, 2026-2036
- Figure 136: Middle East and Africa Market Attractiveness Analysis by End-Use Application
- Figure 137: Middle East and Africa Market Value Share and BPS Analysis by Sales Channel, 2026 and 2036
- Figure 138: Middle East and Africa Market Y-o-Y Growth Comparison by Sales Channel, 2026-2036
- Figure 139: Middle East and Africa Market Attractiveness Analysis by Sales Channel
- Figure 140: Global Market - Tier Structure Analysis
- Figure 141: Global Market - Company Share Analysis
Frequently Asked Questions
How big is the sandbags market in 2026, and what is forecast for 2036?
Global sandbags market valuation moved from USD 684.5 million during 2025 to USD 717.4 million for 2026 and is forecast to reach USD 1,146.5 million by 2036.
What is the CAGR for the sandbags market from 2026 to 2036?
Global sandbags demand advances at a 4.8% CAGR between 2026 and 2036, generating USD 429.1 million in net decade value expansion.
Which fabric material segment leads the sandbags market?
UV-Stabilized Woven Polypropylene holds 58.6% of fabric material demand in 2026 because circular-woven polymer tapes with hindered amine light stabilizers retain 96% tensile strength during outdoor flood deployment.
Which fill status segment leads the sandbags market?
Empty Tie-String Bulk Bales represent 67.4% of the fill status category in 2026 as emergency depots warehouse compressed 1,000-bag pallets at low freight cost and fill them locally during storm warnings.
Which country has a notable growth outlook during the assessment period?
India ranks first in country-level growth at a 5.4% CAGR through 2036, supported by annual monsoon embankment reinforcement and captive domestic polypropylene and jute weaving mills.
Who are the key players in the market?
Hesco Bastion Ltd, United Bags, Inc., Norseman Inc., Sandbaggy LLC, lcpackaging International B.V., Emmbi Industries Limited, Mondi plc, Maccaferri S.p.A., Berry Global Inc., and Conwed Plastics LLC lead commercial supply.
Preview the report firsthand - request a free sample
Get SampleGet the brochure for pricing and purchase details.
Get PDF
