Silanes Market
Market Insights on Silanes covering sales outlook, demand forecast & up-to-date key trends
Silanes Market By Product Type (Organo-functional Silanes, Mono/Chloro Silanes), Application (Rubber, Plastic, Nylon, Adhesives & Sealants, Fibreglass & Composites, Paint, Ink & Coatings), End Use (Building and Construction, Oil & Gas, Electrical & Electronics) & Region - Forecast 2022 - 2030
Silanes Market Snapshot
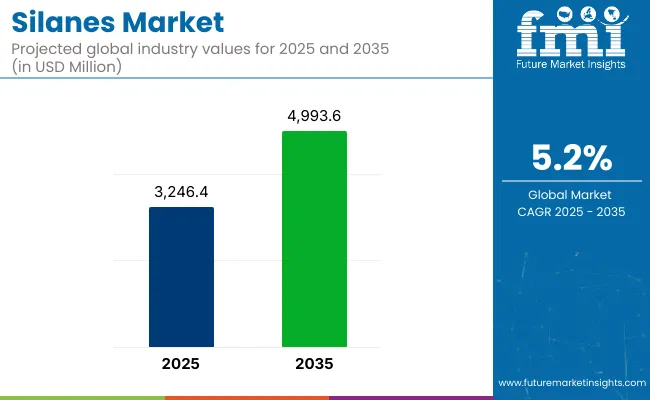
[344 Pages] Expanding at a year on year of 4.2% the global sales of silanes is expected to increase from a valuation of US$ 2,725.9 Mn in 2021 to US$ 2,839.0 Mn by the end of 2022.
Silanes Market Value (2021A) |
US$ 2,725.9 Mn |
Silanes Market Estimation (2022E) |
US$ 2,839.0 Mn |
Silanes Market Projection (2030F) |
US$ 4,043.2 Mn |
Value CAGR (2022-2030) |
4.5% |
Collective Value Share: Top 3 Countries (2022E) |
50.4% |
Silanes, the starting material in the production of silicones, can be functionalized and are used for a wide variety of other applications. Silane are used as primers and tackifiers in the coating industry. Main function of primer is to increase the bond between resin coating and protected substrate. Considering all these, FMI has forecast the silanes market to reach a value of US$ 4,043.2 Mn by 2030 end.
Let us know your requirement to get
100% FREE customization
How The Market Progressed Till June 2022?
Market Statistics |
Details |
H1,2021 (A) |
4.0% |
H1,2022 Projected (P) |
4.3% |
H1,2022 Outlook (O) |
4.4% |
BPS Change : H1,2022 (O) - H1,2022 (P) |
(-) 10 ↓ |
BPS Change : H1,2022 (O) - H1,2021 (A) |
(+) 40 ↑ |
Global Silanes sales growth is expected to increase by 4.0 percent in the first half of 2021. Because of the growing applications for semiconductors, including silanes, in other electronics sector, demand for silanes has expanded over the historical assessment period.
Increased demand for silanes from various applications such as, rubber and plastic, paint and coatings, and plastic and adhesive market, among others, is driving the worldwide silanes market.
Further, in the coating industry, silanes is used in a range of applications, including primers and pacifiers. When compared to the market's true growth, this has resulted in a 40 BPS point rise in first half 2022 as compare to 2021 actual data. The market, on the other hand, predicts a 10-basis-point hike in the first half of 2022 in comparison with earlier projections for the same time frame.
FMI has conducted a half – yearly assessment and comparison for silanes market along with the recent developments witnessed in the market. The half yearly growth anticipation is done to better understand the industry's growth prospects in light of current market trends and key factors.
Along with the positive prospects, the market is expected to face certain challenges like increasing cost of raw materials, and production expenses may impede the market's overall expansion in the next years.
2015-2021 Silanes Market Outlook Compared To 2022-2030 Forecast
Over the period 2015-2021, global silanes sales grew at a CAGR of 4.4%. Around the last few years, the electronics industry has seen tremendous expansion all over the world.
Rising investments in electronics industry, as well as a high acceptance rate of electronics products among customers seeking a more convenient lifestyle, are driving the electronic industry's growth pace. The demand for silanes has increased over the historical assessment period due to the vast range of uses of semiconductors, including silanes, in the electronics sector.
However, the growth pattern is expected to be carried by electronics and other end-use industries over forecast period. Considering this factor, Future Market Insights is projecting the global Silanes market to expand at a CAGR of 4.5% over the upcoming assessment period of 2022-2030.
How Demand From Paints & Coatings Are Bolstering Silanes Market Growth?
Silane are used as primers and tackifiers in the coating industry. Key function of primer is to increase the bond between resin coating and protected substrate. Main component of primer is silane coupling agent, which can be combined with a certain film forming agent, catalyst, and pigments. The bottom coating is made by solvent dilution, which is formed by solvent evaporation, hydrolysis, and condensation of water in the air.
For fillers and pigments used in oil-based and waterborne coatings, wettability and dispersion of inorganic pigments and fillers in the coating phase can be significantly improved after treatment with silanes or additives. The viscosity of coatings can be greatly reduced.
The paints and coatings industry has moved its attention from solvent-borne to water-borne coatings, owing to which the use of silanes in coatings has increased. Epoxy silane can help water-borne clear coatings enhance their block resistance and sanding qualities, which is projected to drive demand for silanes in the coming years.
Like functions in adhesives and sealants, silanes terminated polyether polymers can act as basic materials in coatings and paints. Several polymers and oligomers with a wide range of viscosities can be introduced to this application area. Over the coming years, the paints & coating industry is expected to be the prominent end user of colloidal silica.
Find your sweet spots for generating winning opportunities in this market.
Talk to AnalystWhich Is One Of The Key Challenges Faced By Silanes Manufacturers?
The VOCs released from silanes during crosslinking are commonly toxic and harmful for the environment, as well as for human. For instance, amines and acids released from aminosilanes and acetoxysilanes are severe irritants to the skin, eyes, and mucous membranes, and they are also corrosive to metal, stone or mortar.
Alcohols, especially methanol, released from commercially available alkoxysilanes, may cause blurred vision, headache, dizziness and nausea. Oximes released from another commonly used oximosilanes, especially vinyltris (methylethylketoximino) silane, can cause serious eye irritation.
Moreover, all silanes mentioned above are disadvantageous that are released VOCs during crosslinking have unpleasant or irritating odors, and sometimes smell extremely awful, resulting in great discomfort, especially when working with them in a closed space. Owing to which the silanes are unable to adhere with rising stringent environment regulations especially in developed economies such as North America and Europe. Which is expected to be key deteriorating factor for overall growth of global silanes market.
How Silanes Market Was Impacted By Covid-19 Pandemic?
Demand for silanes has been impacted by novel coronavirus breakdown in 2020. The global market was impacted moderately owing to the muted demand from several end-use industries including the construction, automotive, electrical and electronics and various others.
The demand was hampered owing to the disruptions in supply chain networks and restrictions on production, transportation, travel and other related activities that occurred worldwide due to governmental restrictions and nationwide lockdowns.

A unified Market Research Subscription Platform, built for today's disparate research needs.
Country-Wise Insights
What is the Demand Outlook for Silanes in the U.S.?
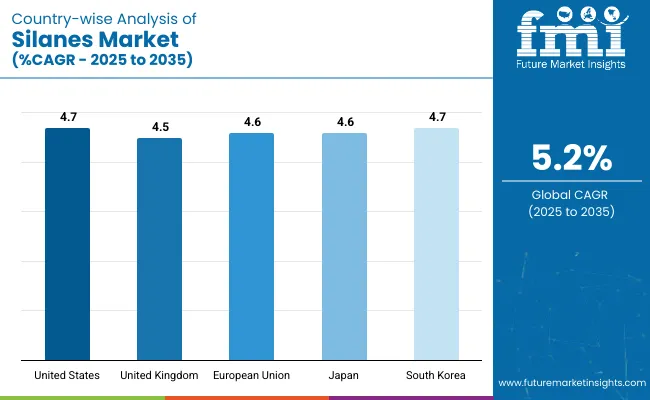
As per FMI, the U.S. is projected to account for a significant share in the global Silanes market. Over the projection period, the United States is expected to dominate the North American Silanes market, with a substantial value share in terms of consumption. The market of silanes is expected to reach a value of US$ 779.8 Mn by the end of the forecast period.
Due to the sheer presence of market leaders in the region, as well as high consumption rates from increasing end users such as the construction and healthcare sectors, the United States is likely to dominate the silanes industry.
The introduction of large-scale uses for silanes, particularly in silica-filled rubber tyres, has resulted in a significant increase in manufacturing volume and capacity, as well as a reduction in silane prices. The United States has played a critical role in silane production.
What Is Growth Outlook of Silanes Market In China?
China is projected reach create an incremental market opportunity of US$ 223.1 Mn in between 2022 and 2030. China is expected to be among the key consumers of silanes all over the globe owing to substantial growth in the end-use industries.
Traditionally, Europe and North America led the silanes industry, but this has changed in recent years due to a rapid expansion in the China’s end use industries. The rapid growth of the country's electronics, construction, and automotive industries has pushed the need for silanes to new heights.
Given the aforementioned development reasons, Future Market Insights expects China will overtake the United States as the world's biggest silane consumer in the near future.
Category-Wise Insights
Which is a key Product Type in the Silanes Market?
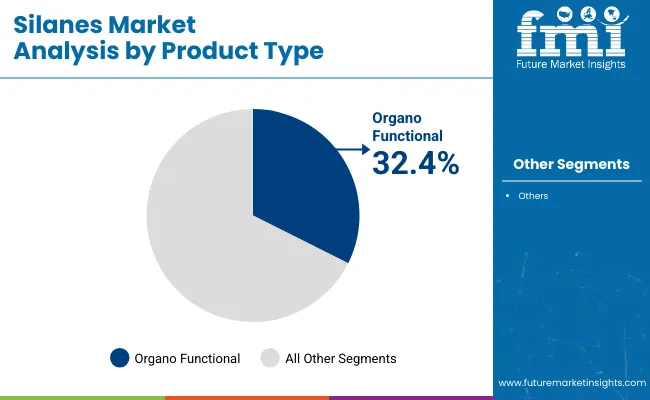
The organo-functional silanes sector of the global silanes market is estimated to account for more than 50% of the market due to its wide range of applications in industries such as construction, electrical and electronics, automotive and aerospace, among others.
Organo-functional silanes are further separated into numerous types of silanes, each of which has a significant impact on demand. Consumer preferences for higher-quality products and the simplicity with which new products can be synthesised are expected to drive demand for organo-functional silanes over the forecast period.
What Role Do Adhesives And Sealants Play In Silanes Market Growth?
Silane coupling agents can be used for the surface treatment of inorganic fillers. Inorganic fillers and pigments treated by silane products have better dispensability in adhesives and sealant system. The adhesives and sealants segment is expected to create a valuation of US$ 378.7 Mn by 2030 end in the region of East Asia.
Key industries such as automobiles and construction have seen a major shift towards adhesive bonding, swerving away from the traditional mechanical fastening and welding methods for joining two different materials. This is primarily due to the various advantages adhesive bonding possesses over welding. Adhesive bonding can join dissimilar metals, reduce stress concentration points, avoids distortion, and are cost effective when compared to welding techniques.
How Is The Boom In The Electronics Industry Affecting The Demand?
Silanes, the starting material in the production of silicones, can be functionalized and are used for a wide variety of other applications. Silanes are indispensable for production of electronic grade silicon, which requires silicon purity of up to 99.9999999% (9N), and are key component in the production of semiconductors.
In the electronics sector, silanes are essential for the production of solar grade silicon, which requires silicon of high purity. Around 90% of solar (photovoltaic) cells are based on silicon. Silicones provide good electrical insulation and serve as a stable base for conductive adhesives that are used in solar panels.
Without silanes, it would not be possible to produce silicon of sufficient purity for solar grade silicon. They aid durability and functionality, providing durable bonds and seals alongside electrical insulation.
For the growth of the photovoltaic industry, it is expected to create an independent feedstock supply with solar grade high-purity silicon, as the availability of hitherto used by-products in the electronic silicon industry is limited and will not increase reasonably within the next 10–15 years.
Competitive Landscape
Manufacturers are introducing new products for various application to stay ahead of the competition. Manufacturers are innovating products to curb VOC emissions.
- Functional organosilanes are used as coupling agents in the rubber industry in a variety of products together with white fillers. They provide improved physical properties of final products and also simplify considerably the processability of rubber compounds during mixing and extrusion.
- Innovative mercapto silanes emit 80% less volatile organic compounds (VOC). Si 363® decreases potential emissions by 80% and reduces rolling resistance of tires by 15 %. Rolling resistance reduction hence reduce fuel consumption in combination with drastically lower VOC emission during processing protect the environment.
- The “green” tires that are made with the help of Silica/Silane technology, save fuel. They also keep vehicles safe on the road, even under extreme weather conditions.
“Future Market Insights has given a brief overview on such developments by the key market players in its latest report.”
Scope Of Report
Attribute |
Details |
Forecast Period |
2022-2030 |
Historical Data Available for |
2015-2021 |
Market Analysis |
USD Million for Value and Tons for Volume |
Key Regions Covered |
North America, Latin America, Europe, East Asia, South Asia, MEA, Oceania. |
Key Countries Covered |
US, Canada, Germany, U.K., France, Italy, Spain, Russia, Poland, China, Japan, India, ANZ, S. Korea, ASEAN, Brazil, Mexico, GCC Countries, Egypt, South Africa |
Key Segments Covered |
Product Type, Application, End Use, and Region |
Key Companies Profiled |
|
Report Coverage |
Market Forecast, Company Share Analysis, Competition Intelligence, DROT Analysis, Market Dynamics and Challenges, and Strategic Growth Initiatives |
Customization & Pricing |
Available upon Request |
Silanes Market By Category
By Product Type, the Silanes market is segmented as :
- Organo Functional Silanes
- Vinyl Silanes
- Amino Silanes
- Epoxy Silanes
- Methacryloxy Silanes
- Styryl Silanes
- Acryloxy Silanes
- Amino Silanes
- Others
- Mono/Chloro Silanes
- Others
By Application, the Silanes market is segmented as :
- Rubber
- Tire Rubbers
- Polyester
- Nylon
- Rayon
- Others
- Non Tire Rubbers
- Ethylene-propylene
- Nitrile Butadiene Rubber
- Styrene Butadiene Rubber
- Polybutadiene
- Natural Rubber
- Others
- Tire Rubbers
- Plastics
- Nylons
- Polycarbonate
- Polystyrene
- Poly Vinyl Chloride
- Others
- Adhesives & Sealants
- Fiberglass and Composites
- Paint, Ink, and Coatings
- Electronics
- Mineral and Filler Treatment
- Surface Protection
- Others
By End Use, the Silanes market is segmented as :
- Building and Construction
- Oil & Gas
- Electrical and Electronics
- Automotive and Aerospace
- Medical and Pharmaceuticals
- Chemical and Other Industries
By Region, the Silanes market is segmented as :
- North America
- Latin America
- Europe
- East Asia
- South Asia
- MEA
- Oceania
Frequently Asked Questions
The Silanes market is expected to total US$ 2,839.0 Mn in 2022.
The Silanes market has been estimated to exhibit growth rate of 4.5% between 2022 and 2030 on value basis.
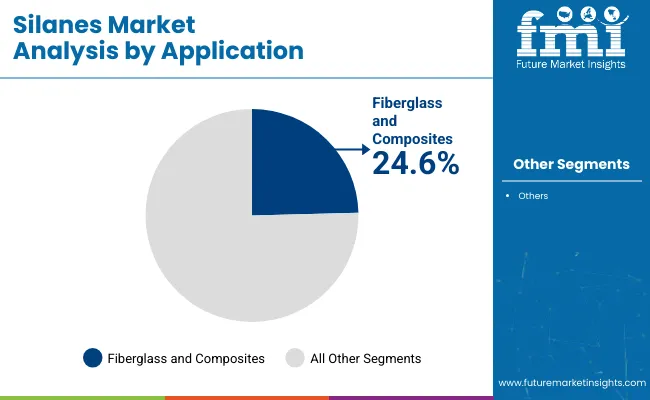
Adhesives and Sealants segment is expected to contribute significantly to the overall market in 2022.
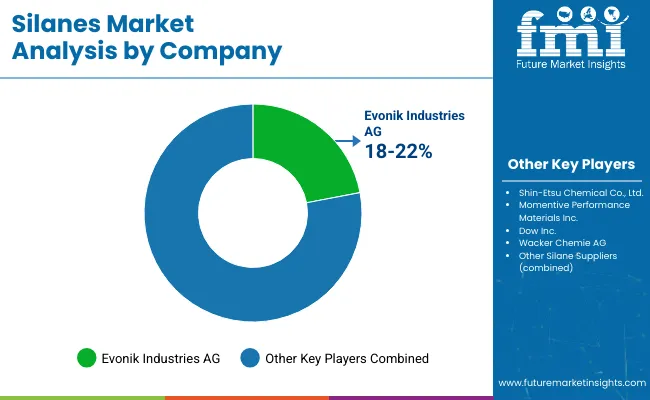
KCC Corporation, OCI Company Ltd, Dow Inc., Momentive Performance Materials Inc., Evonik Industries AG, Wacker Chemie AG, Shin-Etsu Chemical Co. Ltd., China Bluestar International Chemical Co. Ltd, and others are the leading market players.
The demand in U.S. is expected to increase by 4.4% CAGR between 2022 and 2030 on value basis.
Table of Content
1. Executive Summary
1.1. Global Market Outlook
1.2. Demand Side Trends
1.3. Supply Side Trends
1.4. Analysis and Recommendations
2. Market Overview
2.1. Market Taxonomy
2.2. Market Definition
3. Key Market Trends
3.1. Development Trends
3.2. Key Trend Impacting Market Growth
4. Key Success Factors
4.1. Strategic Promotional Strategies
5. Global Silanes Market Demand Analysis 2015 – 2021 and Forecast, 2022 – 2030
5.1. Historical Market Volume Analysis, 2015 – 2021
5.2. Current and Future Market Volume Projections, 2022 – 2030
5.3. Y-o-Y Growth Trend Analysis
6. Global Silanes Market Pricing Analysis
6.1. Regional Pricing Analysis End Use
6.2. Pricing Break-up
6.2.1. Manufacturer Level Pricing
6.2.2. Distributor Level Pricing
6.3. Global Average Pricing Analysis Benchmark
7. Global Market Demand (US$ Mn) Analysis 2015 – 2021 and Forecast, 2022 – 2030
7.1. Historical Market Value (US$ Mn) Analysis, 2015 – 2021
7.2. Current and Future Market Value (US$ Mn) Projections, 2022 – 2030
7.2.1. Y-o-Y Growth Trend Analysis
7.2.2. Absolute $ Opportunity Analysis
8. Market Background
8.1. Macro-Economic Factors
8.2. Forecast Factors - Relevance & Impact
8.3. Production Process Overview
8.4. Parent Market Overview
8.5. Value Chain
8.6. Supply Demand Analysis
8.7. Market Dynamics
8.7.1. Drivers
8.7.2. Restraints
8.7.3. Opportunity Analysis
8.8. Impact of COVID – 19 Crisis
8.8.1. Current Statistics
8.8.2. Expected Recovery and Comparison with Sub-Prime Crisis
8.8.3. World Economy / Cluster Projections
8.9. Potential of Impact by Taxonomy
8.10. 2022 Market Size
8.10.1. Recovery by Quarters
8.10.2. Recovery Scenario (Short, Mid and Long term)
8.11. Long Term Projections
9. Global Silanes Market Analysis 2015 – 2021 and Forecast 2022 – 2030, By Product Type
9.1. Introduction / Key Findings
9.2. Historical Market Size (US$ Mn) and Volume Analysis By Product Type, 2015 – 2021
9.3. Current and Future Market Size (US$ Mn) and Volume Analysis and Forecast by Product Type, 2022 – 2030
9.3.1. Organo-functional Silanes
9.3.1.1. Vinyl Silanes
9.3.1.2. Amino Silanes
9.3.1.3. Epoxy Silanes
9.3.1.4. Methacryloxy Silanes
9.3.1.5. Styryl
9.3.1.6. Acryloxy
9.3.1.7. Isocynate
9.3.1.8. Others
9.3.2. Mono/Chloro Silanes
9.3.3. Others
9.4. Market Attractiveness Analysis by Product Type
10. Global Silanes Market Analysis 2015 – 2021 and Forecast 2022 – 2030, By Application
10.1. Introduction / Key Findings
10.2. Historical Market Size (US$ Mn) and Volume Analysis By Application, 2015 – 2021
10.3. Current and Future Market Size (US$ Mn) and Volume Analysis and Forecast by Application, 2022 – 2030
10.3.1. Rubber
10.3.1.1. Tire Rubber
10.3.1.1.1. Polyester
10.3.1.1.2. Nylon
10.3.1.1.3. Rayon
10.3.1.1.4. Others
10.3.1.2. Non Tire Rubber
10.3.1.2.1. Ethylene-propylene
10.3.1.2.2. Nitrile Butadiene Rubber
10.3.1.2.3. Styrene Butadiene Rubber
10.3.1.2.4. Polybutadiene
10.3.1.2.5. Natural Rubber
10.3.1.2.6. Others
10.3.2. Plastics
10.3.3. Nylon
10.3.3.1. Polycarbonate
10.3.3.2. Polystyrene
10.3.3.3. Poly Vinyl Chloride
10.3.3.4. Others
10.3.4. Adhesives & Sealants
10.3.5. Fiberglass and Composites
10.3.6. Paint, Ink and Coatings
10.3.7. Electronics
10.3.8. Mineral and Filler Treatment
10.3.9. Surface tension
10.3.10. Others
10.4. Market Attractiveness Analysis by Application
11. Global Silanes Market Analysis 2015 – 2021 and Forecast 2022 – 2030, By End Use
11.1. Introduction / Key Findings
11.2. Historical Market Size (US$ Mn) and Volume Analysis By End Use, 2015 – 2021
11.3. Current and Future Market Size (US$ Mn) and Volume Analysis and Forecast By End Use, 2022 – 2030
11.3.1. Building and Construction
11.3.2. Oil & Gas
11.3.3. Electrical and Electronics
11.3.4. Automotive and Aerospace
11.3.5. Medical and Pharmaceutical
11.3.6. Chemical and Other Industries
11.4. Market Attractiveness Analysis By End Use
12. Global Silanes Market Analysis 2015 – 2021 and Forecast 2022 – 2030, by Region
12.1. Introduction
12.2. Historical Market Size (US$ Mn) and Volume Analysis By Region, 2015 – 2021
12.3. Current Market Size (US$ Mn) and Volume Analysis and Forecast By Region, 2022 – 2030
12.3.1. North America
12.3.2. Latin America
12.3.3. Europe
12.3.4. East Asia
12.3.5. South Asia
12.3.6. Oceania
12.3.7. Middle East and Africa (MEA)
12.4. Market Attractiveness Analysis By Region
13. North America Silanes Market Analysis 2015 – 2021 and Forecast 2022 – 2030
13.1. Introduction
13.2. Historical Market Size (US$ Mn) and Volume Trend Analysis By Market Taxonomy, 2015 – 2021
13.3. Market Size (US$ Mn) and Volume Forecast By Market Taxonomy, 2018 - 2028
13.3.1. By Country
13.3.1.1. U.S.
13.3.1.2. Canada
13.3.2. By Product Type
13.3.3. End Use
13.3.4. By Application
13.4. Market Attractiveness Analysis
13.4.1. By Country
13.4.2. By Product Type
13.4.3. End Use
13.4.4. By Application
13.5. Drivers and Restraints - Impact Analysis
14. Latin America Silanes Market Analysis 2015 – 2021 and Forecast 2022 – 2030
14.1. Introduction
14.2. Historical Market Size (US$ Mn) and Volume Trend Analysis By Market Taxonomy, 2015 – 2021
14.3. Market Size (US$ Mn) and Volume Forecast By Market Taxonomy, 2018 - 2028
14.3.1. By Country
14.3.1.1. Brazil
14.3.1.2. Mexico
14.3.1.3. Rest of Latin America
14.3.2. By Product Type
14.3.3. End Use
14.3.4. By Application
14.4. Market Attractiveness Analysis
14.4.1. By Country
14.4.2. By Product Type
14.4.3. End Use
14.4.4. By Application
14.5. Drivers and Restraints - Impact Analysis
15. Europe Silanes Market Analysis 2015 – 2021 and Forecast 2022 – 2030
15.1. Introduction
15.2. Historical Market Size (US$ Mn) and Volume Trend Analysis By Market Taxonomy, 2015 – 2021
15.3. Market Size (US$ Mn) and Volume Forecast By Market Taxonomy, 2018 - 2028
15.3.1. By Country
15.3.1.1. Germany
15.3.1.2. Italy
15.3.1.3. France
15.3.1.4. U.K.
15.3.1.5. Spain
15.3.1.6. Russia
15.3.1.7. Rest of Europe
15.3.2. End Use
15.3.3. By Product Type
15.3.4. By Application
15.4. Market Attractiveness Analysis
15.4.1. By Country
15.4.2. End Use
15.4.3. By Product Type
15.4.4. By Application
15.5. Drivers and Restraints - Impact Analysis
16. East Asia Silanes Market Analysis 2015 – 2021 and Forecast 2022 – 2030
16.1. Introduction
16.2. Historical Market Size (US$ Mn) and Volume Trend Analysis By Market Taxonomy, 2015 – 2021
16.3. Market Size (US$ Mn) and Volume Forecast By Market Taxonomy, 2018 - 2028
16.3.1. By Country
16.3.1.1. China
16.3.1.2. Japan
16.3.1.3. Korea
16.3.2. By Product Type
16.3.3. End Use
16.3.4. By Application
16.4. Market Attractiveness Analysis
16.4.1. By Country
16.4.2. By Product Type
16.4.3. End Use
16.4.4. By Application
16.5. Drivers and Restraints - Impact Analysis
17. South Asia Silanes Market Analysis 2015 – 2021 and Forecast 2022 – 2030
17.1. Introduction
17.2. Historical Market Size (US$ Mn) and Volume Trend Analysis By Market Taxonomy, 2015 – 2021
17.3. Market Size (US$ Mn) and Volume Forecast By Market Taxonomy, 2018 - 2028
17.3.1. By Country
17.3.1.1. India
17.3.1.2. ASEAN Countries
17.3.1.3. Rest of South Asia
17.3.2. By Product Type
17.3.3. End Use
17.3.4. By Application
17.4. Market Attractiveness Analysis
17.4.1. By Country
17.4.2. By Product Type
17.4.3. End Use
17.4.4. By Application
17.5. Drivers and Restraints - Impact Analysis
18. Oceania Silanes Market Analysis 2015 – 2021 and Forecast 2022 – 2030
18.1. Introduction
18.2. Historical Market Size (US$ Mn) and Volume Trend Analysis By Market Taxonomy, 2015 – 2021
18.3. Market Size (US$ Mn) and Volume Forecast By Market Taxonomy, 2018 - 2028
18.3.1. By Country
18.3.1.1. Australia
18.3.1.2. New Zealand
18.3.2. By Product Type
18.3.3. End Use
18.3.4. By Application
18.4. Market Attractiveness Analysis
18.4.1. By Country
18.4.2. By Product Type
18.4.3. End Use
18.4.4. By Application
18.5. Drivers and Restraints - Impact Analysis
19. Middle East and Africa Silanes Market Analysis 2015 – 2021 and Forecast 2022 – 2030
19.1. Introduction
19.2. Pricing Analysis
19.3. Historical Market Size (US$ Mn) and Volume Trend Analysis By Market Taxonomy, 2015 – 2021
19.4. Market Size (US$ Mn) and Volume Forecast By Market Taxonomy, 2018 - 2028
19.4.1. By Country
19.4.1.1. GCC Countries
19.4.1.2. Turkey
19.4.1.3. North Africa
19.4.1.4. South Africa
19.4.1.5. Rest of Middle East and Africa
19.4.2. By Product Type
19.4.3. End Use
19.4.4. By Application
19.5. Market Attractiveness Analysis
19.5.1. By Country
19.5.2. By Product Type
19.5.3. By Application
19.5.4. By Application
19.6. Drivers and Restraints - Impact Analysis
20. Key & Emerging Countries Silanes Market Analysis 2015 – 2021 and Forecast 2022 – 2030
20.1. U.S. Silanes Market Analysis
20.1.1. By Product Type
20.1.2. By Application
20.1.3. By End Use
20.2. Canada Silanes Market Analysis
20.2.1. By Product Type
20.2.2. By Application
20.2.3. By End Use
20.3. Mexico Silanes Market Analysis
20.3.1. By Product Type
20.3.2. By Application
20.3.3. By End Use
20.4. Brazil Silanes Market Analysis
20.4.1. By Product Type
20.4.2. By Application
20.4.3. By End Use
20.5. Germany Silanes Market Analysis
20.5.1. By Product Type
20.5.2. By Application
20.5.3. By End Use
20.6. Italy Silanes Market Analysis
20.6.1. By Product Type
20.6.2. By Application
20.6.3. By End Use
20.7. France Silanes Market Analysis
20.7.1. By Product Type
20.7.2. By Application
20.7.3. By End Use
20.8. U.K. Silanes Market Analysis
20.8.1. By Product Type
20.8.2. By Application
20.8.3. By End Use
20.9. Spain Silanes Market Analysis
20.9.1. By Product Type
20.9.2. By Application
20.9.3. By End Use
20.10. Russia Silanes Market Analysis
20.10.1. By Product Type
20.10.2. By Application
20.10.3. By End Use
20.11. China Silanes Market Analysis
20.11.1. By Product Type
20.11.2. By Application
20.11.3. By End Use
20.12. Japan Silanes Market Analysis
20.12.1. By Product Type
20.12.2. By Application
20.12.3. By End Use
20.13. Korea Silanes Market Analysis
20.13.1. By Product Type
20.13.2. By Application
20.13.3. By End Use
20.14. India Silanes Market Analysis
20.14.1. By Product Type
20.14.2. By Application
20.14.3. By End Use
20.15. ASEAN Silanes Market Analysis
20.15.1. By Product Type
20.15.2. By Application
20.15.3. By End Use
20.16. Australia Silanes Market Analysis
20.16.1. By Product Type
20.16.2. By Application
20.16.3. By End Use
20.17. New Zealand Silanes Market Analysis
20.17.1. By Product Type
20.17.2. By Application
20.17.3. By End Use
20.18. GCC Countries Silanes Market Analysis
20.18.1. By Product Type
20.18.2. By Application
20.18.3. By End Use
20.19. Turkey Silanes Market Analysis
20.19.1. By Product Type
20.19.2. By Application
20.19.3. By End Use
20.20. North Africa Silanes Market Analysis
20.20.1. By Product Type
20.20.2. By Application
20.20.3. By End Use
20.21. South Africa Silanes Market Analysis
20.21.1. By Product Type
20.21.2. By Application
20.21.3. By End Use
21. Market Structure Analysis
21.1. Market Analysis by Tier of Companies (Silanes market glass making)
21.2. Market Concentration
21.3. Market Share Analysis of Key Players
21.4. Market Presence Analysis
21.4.1. By Regional footprint of Players
21.4.2. Product foot print by Players
21.4.3. Channel Foot Print by Players
22. Competition Analysis
22.1. Competition Dashboard
22.2. Pricing Analysis by Competition
22.3. Competition Benchmarking
22.4. Competition Deep Dive
22.4.1. KCC Corporation
22.4.1.1. Overview
22.4.1.2. Product Portfolio
22.4.1.3. Profitability by Market Segments (Product/Channel/Region)
22.4.1.4. Sales Footprint
22.4.1.5. Strategy Overview
22.4.1.5.1. Marketing Strategy
22.4.1.5.2. Product Strategy
22.4.1.5.3. Channel Strategy
22.4.2. OCI Company Ltd
22.4.2.1. Overview
22.4.2.2. Product Portfolio
22.4.2.3. Profitability by Market Segments (Product/Channel/Region)
22.4.2.4. Sales Footprint
22.4.2.5. Strategy Overview
22.4.2.5.1. Marketing Strategy
22.4.2.5.2. Product Strategy
22.4.2.5.3. Channel Strategy
22.4.3. The Dow Chemical Company
22.4.3.1. Overview
22.4.3.2. Product Portfolio
22.4.3.3. Profitability by Market Segments (Product/Channel/Region)
22.4.3.4. Sales Footprint
22.4.3.5. Strategy Overview
22.4.3.5.1. Marketing Strategy
22.4.3.5.2. Product Strategy
22.4.3.5.3. Channel Strategy
22.4.4. Momentive Performance Materials Inc.
22.4.4.1. Overview
22.4.4.2. Product Portfolio
22.4.4.3. Profitability by Market Segments (Product/Channel/Region)
22.4.4.4. Sales Footprint
22.4.4.5. Strategy Overview
22.4.4.5.1. Marketing Strategy
22.4.4.5.2. Product Strategy
22.4.4.5.3. Channel Strategy
22.4.5. Evonik Industries AG
22.4.5.1. Overview
22.4.5.2. Product Portfolio
22.4.5.3. Profitability by Market Segments (Product/Channel/Region)
22.4.5.4. Sales Footprint
22.4.5.5. Strategy Overview
22.4.5.5.1. Marketing Strategy
22.4.5.5.2. Product Strategy
22.4.5.5.3. Channel Strategy
22.4.6. Wacker Chemie AG
22.4.6.1. Overview
22.4.6.2. Product Portfolio
22.4.6.3. Profitability by Market Segments (Product/Channel/Region)
22.4.6.4. Sales Footprint
22.4.6.5. Strategy Overview
22.4.6.5.1. Marketing Strategy
22.4.6.5.2. Product Strategy
22.4.6.5.3. Channel Strategy
22.4.7. Shin-Etsu Chemical Co., Ltd.
22.4.7.1. Overview
22.4.7.2. Product Portfolio
22.4.7.3. Profitability by Market Segments (Product/Channel/Region)
22.4.7.4. Sales Footprint
22.4.7.5. Strategy Overview
22.4.7.5.1. Marketing Strategy
22.4.7.5.2. Product Strategy
22.4.7.5.3. Channel Strategy
22.4.8. China Bluestar International Chemical Co., Ltd
22.4.8.1. Overview
22.4.8.2. Product Portfolio
22.4.8.3. Profitability by Market Segments (Product/Channel/Region)
22.4.8.4. Sales Footprint
22.4.8.5. Strategy Overview
22.4.8.5.1. Marketing Strategy
22.4.8.5.2. Product Strategy
22.4.8.5.3. Channel Strategy
22.4.9. Dalian Onichem Co., Ltd
22.4.9.1. Overview
22.4.9.2. Product Portfolio
22.4.9.3. Profitability by Market Segments (Product/Channel/Region)
22.4.9.4. Sales Footprint
22.4.9.5. Strategy Overview
22.4.9.5.1. Marketing Strategy
22.4.9.5.2. Product Strategy
22.4.9.5.3. Channel Strategy
22.4.10. Tokuyama Corporation
22.4.10.1. Overview
22.4.10.2. Product Portfolio
22.4.10.3. Profitability by Market Segments (Product/Channel/Region)
22.4.10.4. Sales Footprint
22.4.10.5. Strategy Overview
22.4.10.5.1. Marketing Strategy
22.4.10.5.2. Product Strategy
22.4.10.5.3. Channel Strategy
22.4.11. Power Chemical Corporation
22.4.11.1. Overview
22.4.11.2. Product Portfolio
22.4.11.3. Profitability by Market Segments (Product/Channel/Region)
22.4.11.4. Sales Footprint
22.4.11.5. Strategy Overview
22.4.11.5.1. Marketing Strategy
22.4.11.5.2. Product Strategy
22.4.11.5.3. Channel Strategy
22.4.12. Nanjing Shuguang Silane Chemical Co. Ltd
22.4.12.1. Overview
22.4.12.2. Product Portfolio
22.4.12.3. Profitability by Market Segments (Product/Channel/Region)
22.4.12.4. Sales Footprint
22.4.12.5. Strategy Overview
22.4.12.5.1. Marketing Strategy
22.4.12.5.2. Product Strategy
22.4.12.5.3. Channel Strategy
22.4.13. BRB International B.V.
22.4.13.1. Overview
22.4.13.2. Product Portfolio
22.4.13.3. Profitability by Market Segments (Product/Channel/Region)
22.4.13.4. Sales Footprint
22.4.13.5. Strategy Overview
22.4.13.5.1. Marketing Strategy
22.4.13.5.2. Product Strategy
22.4.13.5.3. Channel Strategy
22.4.14. Nanjing Union Silicon Chemical Co., Ltd
22.4.14.1. Overview
22.4.14.2. Product Portfolio
22.4.14.3. Profitability by Market Segments (Product/Channel/Region)
22.4.14.4. Sales Footprint
22.4.14.5. Strategy Overview
22.4.14.5.1. Marketing Strategy
22.4.14.5.2. Product Strategy
22.4.14.5.3. Channel Strategy
22.4.15. Nanjing Wanda Chemical Co., Ltd.
22.4.15.1. Overview
22.4.15.2. Product Portfolio
22.4.15.3. Profitability by Market Segments (Product/Channel/Region)
22.4.15.4. Sales Footprint
22.4.15.5. Strategy Overview
22.4.15.5.1. Marketing Strategy
22.4.15.5.2. Product Strategy
22.4.15.5.3. Channel Strategy
22.4.16. Milliken Chemical
22.4.16.1. Overview
22.4.16.2. Product Portfolio
22.4.16.3. Profitability by Market Segments (Product/Channel/Region)
22.4.16.4. Sales Footprint
22.4.16.5. Strategy Overview
22.4.16.5.1. Marketing Strategy
22.4.16.5.2. Product Strategy
22.4.16.5.3. Channel Strategy
22.4.17. Supreme Silicones
22.4.17.1. Overview
22.4.17.2. Product Portfolio
22.4.17.3. Profitability by Market Segments (Product/Channel/Region)
22.4.17.4. Sales Footprint
22.4.17.5. Strategy Overview
22.4.17.5.1. Marketing Strategy
22.4.17.5.2. Product Strategy
22.4.17.5.3. Channel Strategy
22.4.18. Air Liquide Advanced Materials Inc.
22.4.18.1. Overview
22.4.18.2. Product Portfolio
22.4.18.3. Profitability by Market Segments (Product/Channel/Region)
22.4.18.4. Sales Footprint
22.4.18.5. Strategy Overview
22.4.18.5.1. Marketing Strategy
22.4.18.5.2. Product Strategy
22.4.18.5.3. Channel Strategy
22.4.19. Qufu Chenguang Chemical Co., Ltd
22.4.19.1. Overview
22.4.19.2. Product Portfolio
22.4.19.3. Profitability by Market Segments (Product/Channel/Region)
22.4.19.4. Sales Footprint
22.4.19.5. Strategy Overview
22.4.19.5.1. Marketing Strategy
22.4.19.5.2. Product Strategy
22.4.19.5.3. Channel Strategy
22.4.20. Nitrochemie AG
22.4.20.1. Overview
22.4.20.2. Product Portfolio
22.4.20.3. Profitability by Market Segments (Product/Channel/Region)
22.4.20.4. Sales Footprint
22.4.20.5. Strategy Overview
22.4.20.5.1. Marketing Strategy
22.4.20.5.2. Product Strategy
22.4.20.5.3. Channel Strategy
22.4.21. GELEST, INC
22.4.21.1. Overview
22.4.21.2. Product Portfolio
22.4.21.3. Profitability by Market Segments (Product/Channel/Region)
22.4.21.4. Sales Footprint
22.4.21.5. Strategy Overview
22.4.21.5.1. Marketing Strategy
22.4.21.5.2. Product Strategy
22.4.21.5.3. Channel Strategy
22.4.22. WD SILICONE CO., LTD
22.4.22.1. Overview
22.4.22.2. Product Portfolio
22.4.22.3. Profitability by Market Segments (Product/Channel/Region)
22.4.22.4. Sales Footprint
22.4.22.5. Strategy Overview
22.4.22.5.1. Marketing Strategy
22.4.22.5.2. Product Strategy
22.4.22.5.3. Channel Strategy
23. Assumption & Acronyms Used
24. Research Methodology
Let us know your requirement to get
100% FREE customization
List of Tables
Table 01: Global Silanes Market Size Volume (KT) Forecast by Product Type, 2015–2030
Table 02: Global Silanes Market Size (US$ Mn) and Forecast by Product Type, 2015–2030
Table 03: Global Silanes Market Size Volume (KT) Forecast by Application, 2015–2030
Table 04: Global Silanes Market Size Volume (KT) Forecast by Application, 2015–2030
Table 05: Global Silanes Market Size Value (US$ Mn) Forecast by Application, 2015–2030
Table 06: Global Silanes Market Size Value (US$ Mn) Forecast by Application, 2015–2030
Table 07: Global Silanes Market Size Value (US$ Mn) and Volume (KT) Forecast by Product Type, 2015–2030
Table 08: Global Silanes Market Size Volume (KT) Forecast by Region, 2015–2030
Table 09: North America Silanes Market Size (US$ Mn) and Volume (Tons) Forecast by Country, 2015–2030
Table 10: North America Silanes Market Size Volume (Tons) Forecast by Product Type, 2015–2030
Table 11: North America Silanes Market Size (US$ Mn) and Forecast by Product Type, 2015–2030
Table 12: North America Silanes Market Size Volume (Tons) Forecast by Application, 2015–2030
Table 13: North America Silanes Market Size Volume (Tons) Forecast by Application, 2015–2030
Table 14: North America Silanes Market Size Value (US$ Mn) Forecast by Application, 2015–2030
Table 15: North America Silanes Market Size Value (US$ Mn) Forecast by Application, 2015–2030
Table 16: North America Silanes Market Size Value (US$ Mn) and Volume (Tons) Forecast by Product Type, 2015–2030
Table 17: Latin America Silanes Market Size (US$ Mn) and Volume (Tons) Forecast by Country, 2015–2030
Table 18: Latin America Silanes Market Size Volume (Tons) Forecast by Product Type, 2015–2030
Table 19: Latin America Silanes Market Size (US$ Mn) and Forecast by Product Type, 2015–2030
Table 20: Latin America Silanes Market Size Volume (Tons) Forecast by Application, 2015–2030
Table 21: Latin America Silanes Market Size Volume (Tons) Forecast by Application, 2015–2030
Table 22: Latin America Silanes Market Size Value (US$ Mn) Forecast by Application, 2015–2030
Table 23: North America Silanes Market Size Value (US$ Mn) Forecast by Application, 2015–2030
Table 24: Latin America Silanes Market Size Value (US$ Mn) and Volume (Tons) Forecast by Product Type, 2015–2030
Table 25: Europe Silanes Market Size (US$ Mn) and Volume (Tons) Forecast by Country, 2015–2030
Table 26: Europe Silanes Market Size Volume (Tons) Forecast by Product Type, 2015–2030
Table 27: Europe Silanes Market Size (US$ Mn) and Forecast by Product Type, 2015–2030
Table 28: Europe Silanes Market Size Volume (Tons) Forecast by Application, 2015–2030
Table 29: Europe Silanes Market Size Volume (Tons) Forecast by Application, 2015–2030
Table 30: Europe Silanes Market Size Value (US$ Mn) Forecast by Application, 2015–2030
Table 31: Europe Silanes Market Size Value (US$ Mn) Forecast by Application, 2015–2030
Table 32: Europe Silanes Market Size Value (US$ Mn) and Volume (Tons) Forecast by Product Type, 2015–2030
Table 33: East Asia Silanes Market Size (US$ Mn) and Volume (Tons) Forecast by Country, 2015–2030
Table 34: East Asia Silanes Market Size Volume (Tons) Forecast by Product Type, 2015–2030
Table 35: East Asia Silanes Market Size (US$ Mn) and Forecast by Product Type, 2015–2030
Table 36: East Asia Silanes Market Size Volume (Tons) Forecast by Application, 2015–2030
Table 37: East Asia Silanes Market Size Volume (Tons) Forecast by Application, 2015–2030
Table 38: East Asia Silanes Market Size Value (US$ Mn) Forecast by Application, 2015–2030
Table 39: East Asia Silanes Market Size Value (US$ Mn) Forecast by Application, 2015–2030
Table 40: East Asia Silanes Market Size Value (US$ Mn) and Volume (Tons) Forecast by Product Type, 2015–2030
Table 41 : South Asia Silanes Market Size (US$ Mn) and Volume (Tons) Forecast by Country, 2015–2030
Table 42: South Asia Silanes Market Size Volume (Tons) Forecast by Product Type, 2015–2030
Table 43: South Asia Silanes Market Size (US$ Mn) and Forecast by Product Type, 2015–2030
Table 44: South Asia Silanes Market Size Volume (Tons) Forecast by Application, 2015–2030
Table 45: South Asia Silanes Market Size Volume (Tons) Forecast by Application, 2015–2030
Table 46: South Asia Silanes Market Size Value (US$ Mn) Forecast by Application, 2015–2030
Table 47: South Asia Silanes Market Size Value (US$ Mn) Forecast by Application, 2015–2030
Table 48: South Asia Silanes Market Size Value (US$ Mn) and Volume (Tons) Forecast by Product Type, 2015–2030
Table 49: Oceania Silanes Market Size (US$ Mn) and Volume (Tons) Forecast by Country, 2015–2030
Table 50: Oceania Silanes Market Size Volume (Tons) Forecast by Product Type, 2015–2030
Table 51: Oceania Silanes Market Size (US$ Mn) and Forecast by Product Type, 2015–2030
Table 52: Oceania Silanes Market Size Volume (Tons) Forecast by Application, 2015–2030
Table 53: Oceania Silanes Market Size Volume (Tons) Forecast by Application, 2015–2030
Table 54: Oceania Silanes Market Size Value (US$ Mn) Forecast by Application, 2015–2030
Table 55: Oceania Silanes Market Size Value (US$ Mn) Forecast by Application, 2015–2030
Table 56: Oceania Silanes Market Size Value (US$ Mn) and Volume (Tons) Forecast by Product Type, 2015–2030
Table 57: MEA Silanes Market Size (US$ Mn) and Volume (Tons) Forecast by Country, 2015–2030
Table 58: MEA Silanes Market Size Volume (Tons) Forecast by Product Type, 2015–2030
Table 59: MEA Silanes Market Size (US$ Mn) and Forecast by Product Type, 2015–2030
Table 60: MEA Silanes Market Size Volume (Tons) Forecast by Application, 2015–2030
Table 62: MEA Silanes Market Size Volume (Tons) Forecast by Application, 2015–2030
Table 63: MEA Silanes Market Size Value (US$ Mn) Forecast by Application, 2015–2030
Table 64: MEA Silanes Market Size Value (US$ Mn) Forecast by Application, 2015–2030
Table 65: MEA Silanes Market Size Value (US$ Mn) and Volume (Tons) Forecast by Product Type, 2015–2030
Find your sweet spots for generating winning opportunities in this market.
Talk to AnalystList of Charts
Figure 01: Global Historical, Current, and forecast Market Volume (KT) Analysis, 2015 – 2030
Figure 02: Global Market Volume (KT) and Y-o-Y Growth Analysis, 2021–2030
Figure 03: Global Historical, Current, and forecast Market Value (US$ Mn) – Volume (KT) Analysis, 2015 – 2030
Figure 04: Global Market Value (US$ Mn) and Y-o-Y Growth Analysis, 2021–20
Figure 05: Global Silanes Market Share and BPS Analysis by Product Type– 2022 & 2030
Figure 06: Global Silanes Market Y-o-Y Growth Projections by Product Type, 2022 - 2030
Figure 07: Global Silanes Market Absolute $ Opportunity by Organo-functional Silanes Segment
Figure 08: Global Silanes Market Absolute $ Opportunity by Mono/Chloro Silanes Segment
Figure 09: Global Silanes Market Absolute $ Opportunity by Others Segment
Figure 10: Global Silanes Market Attractiveness Analysis by Product Type, 2022-2030
Figure 11: Global Silanes Market Share and BPS Analysis by Application– 2022 & 2030
Figure 12: Global Silanes Market Y-o-Y Growth Projections by Application, 2022 - 2030
Figure 13: Global Silanes Market Absolute $ Opportunity by Rubber Segment
Figure 14: Global Silanes Market Absolute $ Opportunity by Plastics Segment
Figure 15: Global Silanes Market Absolute $ Opportunity by Nylon Segment
Figure 16: Global Silanes Market Absolute $ Opportunity by Adhesives & Sealants Segment
Figure 17: Global Silanes Market Absolute $ Opportunity by Fiberglass and Composites Segment
Figure 18: Global Silanes Market Absolute $ Opportunity by Paint, Ink and Coatings Segment
Figure 19: Global Silanes Market Absolute $ Opportunity by Electronics Segment
Figure 20: Global Silanes Market Absolute $ Opportunity by Mineral and Filler Treatment Segment
Figure 21: Global Silanes Market Absolute $ Opportunity by Surface Protection Segment
Figure 22: Global Silanes Market Absolute $ Opportunity by Others Segment
Figure 23: Global Silanes Market Attractiveness Analysis by Application, 2022-2030
Figure 24: Global Silanes Market Share and BPS Analysis by End Use– 2022 & 2030
Figure 25: Global Silanes Market Y-o-Y Growth Projections by End Use, 2022 - 2030
Figure 26: Global Silanes Market Absolute $ Opportunity by Building and Construction Segment
Figure 27: Global Silanes Market Absolute $ Opportunity by Oil & Gas Segment
Figure 28: Global Silanes Market Absolute $ Opportunity by Electrical and Electronics Segment
Figure 29: Global Silanes Market Absolute $ Opportunity by Automotive and Aerospace Segment
Figure 30: Global Silanes Market Absolute $ Opportunity by Medical and Pharmaceutical Segment
Figure 31: Global Silanes Market Absolute $ Opportunity by Chemical and Other Industries Segment
Figure 32: Global Silanes Market Attractiveness Analysis by End Use, 2022-2030
Figure 33: Global Silanes Market Share and BPS Analysis by Region– 2022 & 2030
Figure 34: Global Silanes Market Y-o-Y Growth Projections by Region, 2022 - 2030
Figure 35: Global Silanes Market Absolute $ Opportunity by North America Segment
Figure 36: Global Silanes Market Absolute $ Opportunity by Latin America Segment
Figure 37: Global Silanes Market Absolute $ Opportunity by Europe Segment
Figure 38: Global Silanes Market Absolute $ Opportunity by East Asia Segment
Figure 39: Global Silanes Market Absolute $ Opportunity by South Asia Segment
Figure 40: Global Silanes Market Absolute $ Opportunity by Oceania Segment
Figure 41: Global Silanes Market Absolute $ Opportunity by MEA Segment
Figure42: Global Silanes Market Attractiveness Analysis by Region, 2022-2030
Figure 43: North America Silanes Market Share and BPS Analysis by Country– 2022 & 2030
Figure 44: North America Silanes Market Y-o-Y Growth Projections by Country, 2022 - 2030
Figure 45: North America Silanes Market Attractiveness Analysis by Country, 2022-2030
Figure 46: North America Silanes Market Share and BPS Analysis by Product Type– 2022 & 2030
Figure 47: North America Silanes Market Y-o-Y Growth Projections by Product Type, 2022 - 2030
Figure 48: North America Silanes Market Attractiveness Analysis by Product Type, 2022-2030
Figure 49: North America Silanes Market Share and BPS Analysis by Application– 2022 & 2030
Figure 50: North America Silanes Market Y-o-Y Growth Projections by Application, 2022 - 2030
Figure 51: North America Silanes Market Attractiveness Analysis by Application, 2022-2030
Figure 52: North America Silanes Market Share and BPS Analysis by End Use – 2022 & 2030
Figure 53: North America Silanes Market Y-o-Y Growth Projections by End Use, 2022 - 2030
Figure 54: North America Silanes Market Attractiveness Analysis by End Use, 2022-2030
Figure 55: Latin America Silanes Market Share and BPS Analysis by Country– 2022 & 2030
Figure 56: Latin America Silanes Market Y-o-Y Growth Projections by Country, 2022 - 2030
Figure 57: Latin America Silanes Market Attractiveness Analysis by Country, 2022-2030
Figure 58: Latin America Silanes Market Share and BPS Analysis by Product Type– 2022 & 2030
Figure 59: Latin America Silanes Market Y-o-Y Growth Projections by Product Type, 2022 - 2030
Figure 60: Latin America Silanes Market Attractiveness Analysis by Product Type, 2022-2030
Figure 61: Latin America Silanes Market Share and BPS Analysis by Application– 2022 & 2030
Figure 62: Latin America Silanes Market Y-o-Y Growth Projections by Application, 2022 - 2030
Figure 63: Latin America Silanes Market Attractiveness Analysis by Application, 2022-2030
Figure 64: Latin America Silanes Market Share and BPS Analysis by End Use – 2022 & 2030
Figure 65: Latin America Silanes Market Y-o-Y Growth Projections by End Use, 2022 - 2030
Figure 66: Latin America Silanes Market Attractiveness Analysis by End Use, 2022-2030
Figure 67: Europe Silanes Market Share and BPS Analysis by Country– 2022 & 2030
Figure 68: Europe Silanes Market Y-o-Y Growth Projections by Country, 2022 - 2030
Figure 69: Europe Silanes Market Attractiveness Analysis by Country, 2022-2030
Figure 70: Europe Silanes Market Share and BPS Analysis by Product Type– 2022 & 2030
Figure 71: Europe Silanes Market Y-o-Y Growth Projections by Product Type, 2022 - 2030
Figure 72: Europe Silanes Market Attractiveness Analysis by Product Type, 2022-2030
Figure 73: Europe Silanes Market Share and BPS Analysis by Application– 2022 & 2030
Figure 74: Europe Silanes Market Y-o-Y Growth Projections by Application, 2022 - 2030
Figure 75: Europe Silanes Market Attractiveness Analysis by Application, 2022-2030
Figure 76: Europe Silanes Market Share and BPS Analysis by End Use – 2022 & 2030
Figure 77: Europe Silanes Market Y-o-Y Growth Projections by End Use, 2022 - 2030
Figure 78: Europe Silanes Market Attractiveness Analysis by End Use, 2022-2030
Figure 79: East Asia Silanes Market Share and BPS Analysis by Country– 2022 & 2030
Figure 80: East Asia Silanes Market Y-o-Y Growth Projections by Country, 2022 - 2030
Figure 81: East Asia Silanes Market Attractiveness Analysis by Country, 2022-2030
Figure 82: East Asia Silanes Market Share and BPS Analysis by Product Type– 2022 & 2030
Figure 83: East Asia Silanes Market Y-o-Y Growth Projections by Product Type, 2022 - 2030
Figure 84: East Asia Silanes Market Attractiveness Analysis by Product Type, 2022-2030
Figure 85: East Asia Silanes Market Share and BPS Analysis by Application– 2022 & 2030
Figure 86: East Asia Silanes Market Y-o-Y Growth Projections by Application, 2022 - 2030
Figure 87: East Asia Silanes Market Attractiveness Analysis by Application, 2022-2030
Figure 88: East Asia Silanes Market Share and BPS Analysis by End Use – 2022 & 2030
Figure 89: East Asia Silanes Market Y-o-Y Growth Projections by End Use, 2022 - 2030
Figure 90: East Asia Silanes Market Attractiveness Analysis by End Use, 2022-2030
Figure 91: South Asia Silanes Market Share and BPS Analysis by Country– 2022 & 2030
Figure 92: South Asia Silanes Market Y-o-Y Growth Projections by Country, 2022 - 2030
Figure 93: South Asia Silanes Market Attractiveness Analysis by Country, 2022-2030
Figure 94: South Asia Silanes Market Share and BPS Analysis by Product Type– 2022 & 2030
Figure 95: South Asia Silanes Market Y-o-Y Growth Projections by Product Type, 2022 - 2030
Figure 96: South Asia Silanes Market Attractiveness Analysis by Product Type, 2022-2030
Figure 97: South Asia Silanes Market Share and BPS Analysis by Application– 2022 & 2030
Figure 98: South Asia Silanes Market Y-o-Y Growth Projections by Application, 2022 - 2030
Figure 99: South Asia Silanes Market Attractiveness Analysis by Application, 2022-2030
Figure 100: South Asia Silanes Market Share and BPS Analysis by End Use – 2022 & 2030
Figure 101: South Asia Silanes Market Y-o-Y Growth Projections by End Use, 2022 - 2030
Figure 102: South Asia Silanes Market Attractiveness Analysis by End Use, 2022-2030
Figure 103: Oceania Silanes Market Share and BPS Analysis by Country– 2022 & 2030
Figure 104: Oceania Silanes Market Y-o-Y Growth Projections by Country, 2022 - 2030
Figure 105: Oceania Silanes Market Attractiveness Analysis by Country, 2022-2030
Figure 106: Oceania Silanes Market Share and BPS Analysis by Product Type– 2022 & 2030
Figure 107: Oceania Silanes Market Y-o-Y Growth Projections by Product Type, 2022 - 2030
Figure 108: Oceania Silanes Market Attractiveness Analysis by Product Type, 2022-2030
Figure 109: Oceania Silanes Market Share and BPS Analysis by Application– 2022 & 2030
Figure 110: Oceania Silanes Market Y-o-Y Growth Projections by Application, 2022 - 2030
Figure 111: Oceania Silanes Market Attractiveness Analysis by Application, 2022-2030
Figure 112: Oceania Silanes Market Share and BPS Analysis by End Use – 2022 & 2030
Figure 113: Oceania Silanes Market Y-o-Y Growth Projections by End Use, 2022 - 2030
Figure 114: Oceania Silanes Market Attractiveness Analysis by End Use, 2022-2030
Figure 115: MEA Silanes Market Share and BPS Analysis by Country– 2022 & 2030
Figure 116: MEA Silanes Market Y-o-Y Growth Projections by Country, 2022 - 2030
Figure 117: MEA Silanes Market Attractiveness Analysis by Country, 2022-2030
Figure 118: MEA Silanes Market Share and BPS Analysis by Product Type– 2022 & 2030
Figure 119: MEA Silanes Market Y-o-Y Growth Projections by Product Type, 2022 - 2030
Figure 120: MEA Silanes Market Attractiveness Analysis by Product Type, 2022-2030
Figure 121: MEA Silanes Market Share and BPS Analysis by Application– 2022 & 2030
Figure 122: MEA Silanes Market Y-o-Y Growth Projections by Application, 2022 - 2030
Figure 123: MEA Silanes Market Attractiveness Analysis by Application, 2022-2030
Figure 124: MEA Silanes Market Share and BPS Analysis by End Use – 2022 & 2030
Figure 125: MEA Silanes Market Y-o-Y Growth Projections by End Use, 2022 - 2030
Figure 126: MEA Silanes Market Attractiveness Analysis by End Use, 2022-2030
Need specific information?
Request CustomizationExplore Chemicals & Materials Insights
View Reports