Skull Clamp Market Outlooks (2023 to 2033)

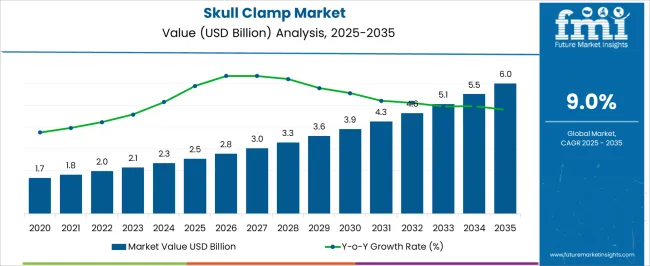
The skull clamp market is likely to capture a valuation of US$ 2.14 billion in 2023 and is predicted to reach US$ 5.07 billion by 2033. The market is registering a CAGR of 9% during the forecast period.

A skull clamp is a medical device used in neurosurgery to secure a patient's head during surgical procedures. The demand for skull clamps depends on several factors, including:

  • Prevalence of Neurological Disorders: Neurological disorders such as brain tumors, head injuries, and stroke are increasing globally. It has led to several neurosurgical procedures being performed, which drives the demand for skull clamps.
  • Advanced in Technology: The development of new technologies in the field of neurosurgery, such as minimally invasive surgery and 3D-printed implants, raises the demand for skull clamps. These technological tools are easy to use and are more precise.
  • Demographics: The aging population is increasing worldwide, leading to a higher incidence of neurological disorders increase the demand for neurological procedures.
  • Healthcare Infrastructure: The availability and quality of healthcare infrastructure in a region can affect the demand for skull clamps. Regions with better healthcare infrastructure may have a higher demand for advanced skull clamps by skilled surgeons.
  • Regulations: Regulations set by the government and non-governmental organizations can affect the skull clamp market. For example, stricter regulations for medical devices can lead to a decrease in the availability of new products in the market.

The Popularity of Skull Clamps in the Healthcare Sector Raises Market Growth

The demand for skull clamps is rapidly surging in the healthcare sector, fueling market revenue. The skull clamp devices are used to immobilize the head during surgical procedures. They are designed to securely hold the patient's head in place while allowing the surgeon to access the brain without risk.

The technology in skull clamp design to improve accuracy which has further propelled market growth. However, it is important to note that using a skull clamp can pose certain risks, including infection, nerve damage, and pressure ulcers. As such, healthcare professionals follow strict guidelines when using skull clamps to ensure patients' safety.

Overall, the popularity of skull clamps may be rising in the healthcare sector with its potential benefits and risks and ensure appropriate use.

Attributes Details
Market CAGR (2023 to 2033) 9%
Market Valuation (2023) US$ 2.14 billion
Market Valuation (2033) US$ 5.07 billion

Don't pay for what you don't need

Customize your report by selecting specific countries or regions and save 30%!

The Skull Clamp Market, 2018 to 2022 Historical Sales, Compared to 2023 to 2033 Future Outlook

The rising demand for minimally invasive surgeries and the increasing prevalence of neurological disorders drive market growth. According to a report by Future Market Insights, the global market was valued at around US$ 1.39 billion in 2018. The increasing healthcare sector, advanced surgical devices, with the availability of resources fuel the market revenue.

  • Short Term (2023 to 2026): The surge in neurological disorders and other chronic diseases is increasing the demand for skull clamps in this time frame. Asian countries are advancing the market size by establishing new entrants. Moreover, the rise in geriatric patients and changing lifestyles are advancing the market growth.
  • Medium Term (2026 to 2029): Growing advanced technologies, innovation of products, and growing concerns towards a healthy lifestyle. The growing healthcare sector, implementing government regulations, and changing consumer preferences drive market size. Increasing demand for better alternative tools for patient treatment is raising the adoption of skull clamp devices.
  • Long Term (2029 to 2033): Rising research and development activities in medical institutions, growing advanced technologies with several healthcare professionals. Rising disposable income and innovation in treatment devices in the healthcare industry are driving market opportunities.

The Top Categories Drives the Global Market Revenue are

Which Product Segment Dominates the Global Market?

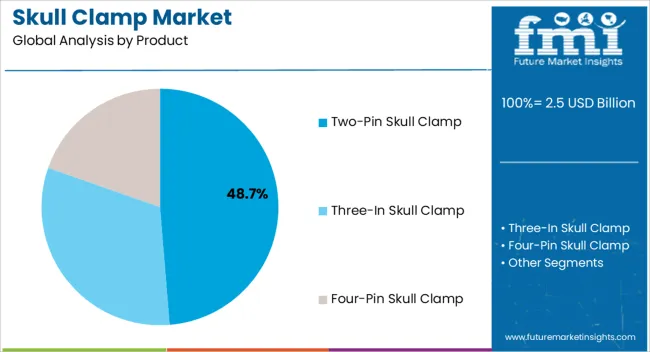
Based on the product, the three-pin skull clamp is dominating the global market by securing a higher share by 2033. The three-pin segment is a popular type of segment commonly used in neurosurgery. It consists of three pins screwed into the patient's skull and attached to a rigid frame to provide stable support to patients during surgery. This type of skull clamp is known for its versatility and ease to use.

The choice of a three-pin skull clamp depends on the specific surgical procedures, preferences, and patients' needs. This skull clamp includes a C-shaped frame or partial circle that helps in neurosurgery by healthcare experts. Overall, the three-ping segment is anticipated to capture huge market expansion during the forecast period.

Hospital Segment Leads the Global Market

Based on end-use, the hospital segment is leading the global market by registering a maximum share by 2033. Hospitals perform a significant portion of neurological procedures. Various patients prefer to visit the hospital for their chronic diseases, regular check-ups, and treat their diseases through healthcare specialists.

Ambulatory surgical centers and specialty clinics are dominant end users, particularly in outpatient procedures. The small-sized manufacturers, online distributors, and suppliers also capture relevant share that upsurges the market growth.
Sabyasachi Ghosh
Sabyasachi Ghosh

Principal Consultant

Talk to Analyst

Find your sweet spots for generating winning opportunities in this market.

Overview of Top Countries in the Global Market

Rising Neurosurgical Procedures Upsurge the United States Market

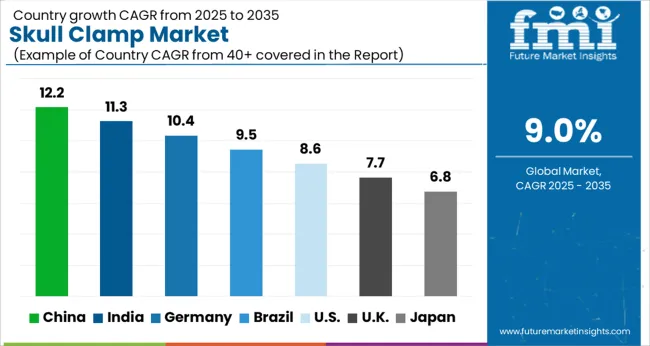
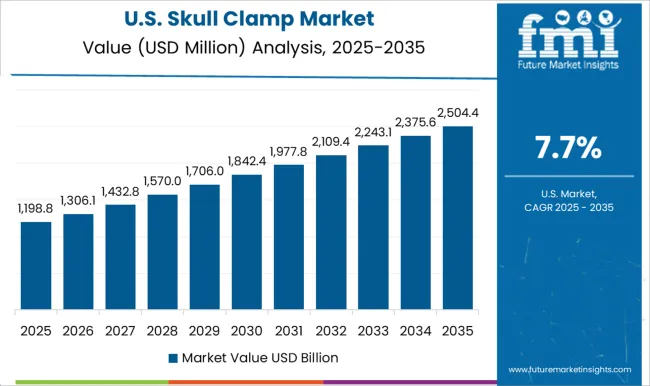
The United States is anticipated to dominate the global market by capturing a maximum share by 2033. The rising manufacturers and production of skull clamp devices are upsurging the United States skull clamp market. The rising new market entrance and launching of innovative products are accelerating the demand for skull clamps in the country.

Rising neurosurgical procedures, growing key players, and the presence of medical device manufacturers are surging the market size. These manufacturers develop advanced healthcare infrastructure with innovative medical devices to meet patients' requirements. The government of the United States is initiating several regulations and policies to advance the healthcare sector during the forecast period.

Increases Export of Skull Clamp Devices Drive China Market

China is anticipated to be one of the leading players in the global market due to the growing medical device industry by 2033. China’s skull clamp market captures a significant market share globally, by investing heavily in research and development activities. Chinese companies are developing a new type of skull clamp that is more effective, safe, and easier to use. They are also working to make these devices more affordable, which can increase access to neurosurgery in developing countries.

China's market is expanding by exporting skull clamp devices to other countries. Chinese companies are offering their products at competitive prices and are targeting emerging markets. Their strategies are helping to expand the market share in China. Clinical settings trial the devices developed by manufacturers and, after it, exported to the international level.

How is India Contributing to the Global Market?

India is playing a crucial role in the global market and contributing in several ways:

  • Manufacturing: India has several manufacturers who produce high-quality skull clamps at competitive prices. These manufacturers cater to the domestic market and export to other countries.
  • Innovation: Indian companies are constantly innovating and improving the design of skull clamps to make them more effective and user-friendly. They developed new products and added advanced features.
  • Research and Development: India has a robust research and development infrastructure in the healthcare sector, and numerous companies are investing in improving their products. It led to better materials, advanced manufacturing techniques, and innovative designs.
  • Cost-effective Solutions: Indian manufacturing companies produce high-quality products at affordable prices compared to other countries with co-effective solutions.

Overall, the Indian skull clamp market plays a significant role in driving the global market.

Growing Manufacturing Companies Expand the United Kingdom Market

The United Kingdom market is anticipated to be highly competitive, with prominent players and manufacturing companies by 2033. The rising development of advanced skull clamp by these companies and other related medical devices are fueling the market size in the country. The rise in neurosurgical disorders patients increases the development of neurosurgical instruments by manufacturing companies in the country.

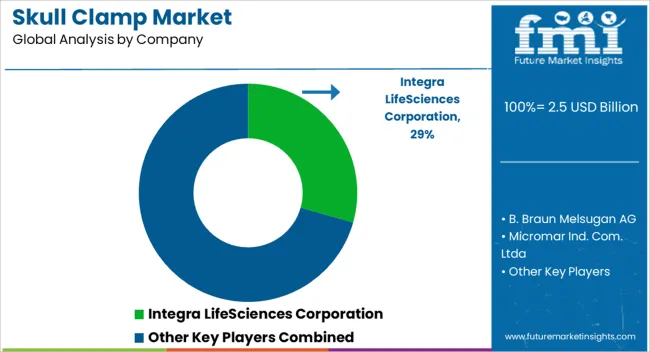
There are several established players in the United Kingdom, such as Integra LifeSciences, B. Braun Melsungen AG, and DePuy Synthes, among others. The United States skull clamp market is one of the higher contributors in the global market to medical research and innovations. The country has various world-renowned medical research institutions, such as the University of Oxford and the University of Cambridge. These institutes develop new technologies, various medical conditions, and treatments.
Competitive Landscape

The present key players in the market adopt several marketing methodologies to uplift the market to another height. Their commonly adopted marketing strategies are partnerships, acquisitions, product launches, collaborations, and mergers. The leading manufacturing companies in the market include:

  • Integra LifeSciences: Integra LifeSciences is a leading medical technology company that offers a range of neurosurgical products, including skull clamps, cranial stabilization systems, and others.
  • Micromar: Micromar is a Brazilian company specializing in developing and manufacturing neurosurgical instruments, including retraction systems and skull clamps.
  • Mizuho America: Mizuho America is a United States-based company that produces a variety of surgical instruments, including skull clamps, surgical navigation systems, and others.

Prominent Players in the Market are:

  • Integra LifeSciences Corporation
  • B. Braun Melsugan AG
  • Micromar Ind. Com. Ltda
  • Elekta AB
  • Red Leaf Medical Inc
  • Pro Med Instruments GmbH
  • PMT Corporation
  • Changzhou Huida Medical Equipment Co. Ltd
  • Mizuho Medical Co. Ltd
  • Aesculap Inc

Recent Developments in the Market are:

  • In 2021, Integra LifeSciences launched a new skull clamp called the MAYFIELD 7 QuickLatch. It is designed to improve neurosurgery procedures' efficiency and ease of use.
  • In 2020, Elekta AB announced the launch of their Leksell Vantage Stereotactic System, which includes a new skull clamp designed for precise and accurate targeting during brain surgery.
  • In 2020, B. Braun Melsugen AG launched its new product NeuroClipse Skull Clamp System. It is designed to provide secure and stable fixation during neurosurgery procedures.
  • In 2020, Pro Med Instruments GnbH introduced its new skull clamp, PMI Craniotomy Clamp. This device is designed to provide greater stability and control during brain surgery.
  • In 2018, Stryker Corporation launched its new Stryker Neuro Spine ENT Navigation System. This product provides real-time imaging and navigation during complex skull surgeries surgeons.

Get the data you need at a Fraction of the cost

Personalize your report by choosing insights you need
and save 40%!

Scope of Report

Attribute Details
Forecast Period 2023 to 2033
Historical Data Available for 2018 to 2022
Market Analysis US$ billion for Value
Key Regions Covered North America; Europe; Latin America; Asia Pacific; The Middle East Africa
Key Segments Covered Product, Application, Material, Accessories, End Use, Region
Key Companies Profiled Integra LifeSciences Corporation; B. Braun Melsugan AG; Micromar Ind. Com. Ltda; Elekta AB; Red Leaf Medical Inc; Pro Med Instruments GmbH; PMT Corporation; Changzhou Huida Medical Equipment Co. Ltd; Mizuho Medical Co. Ltd; Aesculap Inc
Report Coverage Market Forecast, Company Share Analysis, Competition Intelligence, DROT Analysis, Market Dynamics and Challenges, and Strategic Growth Initiatives
Customization & Pricing Available upon Request

Skull Clamp Market by Category

By Product:

  • Two-pin Skull Clamp
  • Three-in Skull Clamp
  • Four-pin Skull Clamp

By Application:

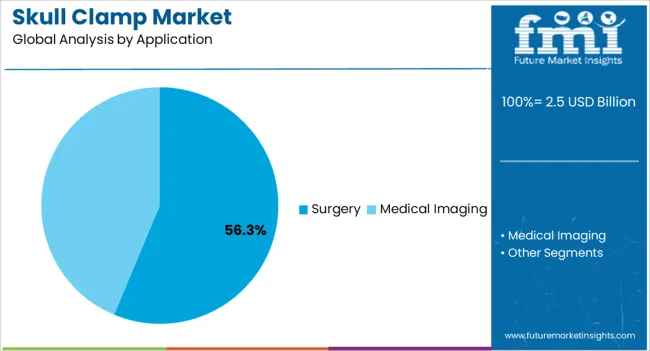
  • Surgery
  • Medical Imaging

By Material:

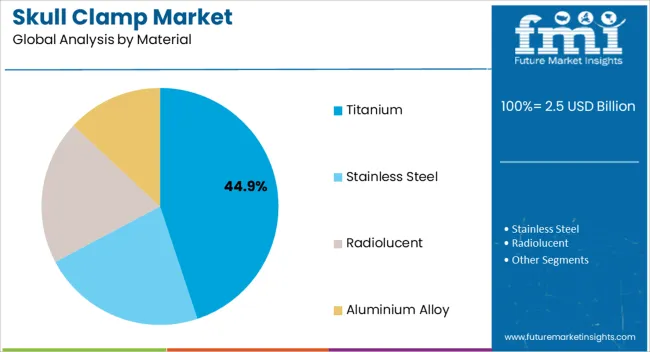
  • Titanium
  • Stainless Steel
  • Radiolucent
  • Aluminium Alloy

By Accessories:

  • Headrests
  • Skull Pins

By End Use:

  • Hospitals
  • Ambulatory Surgical Centers
  • Specialty Clinics

By Region:

  • North America
  • Europe
  • Latin America
  • Asia Pacific
  • Middle East Africa

Frequently Asked Questions

Which Product Segment Dominates the Skull Clamp Market?

The three-pin skull clamp is estimated to dominate the market by 2033.

What Drives China’s Skull Clamp Market?

Growth in the medical device industry drives China’s skull clamp market.

What is the Current Market Valuation?

The market is valued at US$ 2.14 billion in 2023.

Who are the Key Skull Clamp Market Players?

Elekta AB, PMT Corporation, and Aesculap Inc are the key market players.

What is the Growth Forecast for the Skull Clamp Market?

The market is forecast to register a CAGR of 9% through 2033.

Table of Content
1. Executive Summary | Skull Clamp Market
    1.1. Global Market Outlook
    1.2. Demand-side Trends
    1.3. Supply-side Trends
    1.4. Technology Roadmap Analysis
    1.5. Analysis and Recommendations
2. Market Overview
    2.1. Market Coverage / Taxonomy
    2.2. Market Definition / Scope / Limitations
3. Market Background
    3.1. Market Dynamics
        3.1.1. Drivers
        3.1.2. Restraints
        3.1.3. Opportunity
        3.1.4. Trends
    3.2. Scenario Forecast
        3.2.1. Demand in Optimistic Scenario
        3.2.2. Demand in Likely Scenario
        3.2.3. Demand in Conservative Scenario
    3.3. Opportunity Map Analysis
    3.4. Investment Feasibility Matrix
    3.5. PESTLE and Porter’s Analysis
    3.6. Regulatory Landscape
        3.6.1. By Key Regions
        3.6.2. By Key Countries
   3.4. Regional Parent Market Outlook
4. Global Market Analysis 2018 to 2022 and Forecast, 2023 to 2033
    4.1. Historical Market Size Value (US$ Million) Analysis, 2018 to 2022
   4.2. Current and Future Market Size Value (US$ Million) Projections, 2023 to 2033
        4.2.1. Y-o-Y Growth Trend Analysis
        4.2.2. Absolute $ Opportunity Analysis
5. Global Market Analysis 2018 to 2022 and Forecast, 2023 to 2033
    5.1. Historical Market Size Value (US$ Million) Analysis, 2018 to 2022
    5.2. Current and Future Market Size Value (US$ Million) Projections, 2023 to 2033
        5.2.1. Y-o-Y Growth Trend Analysis
        5.2.2. Absolute $ Opportunity Analysis
6. Global Market Analysis 2018 to 2022 and Forecast 2023 to 2033, By Product
    6.1. Introduction / Key Findings
    6.2. Historical Market Size Value (US$ Million) Analysis By Product, 2018 to 2022
    6.3. Current and Future Market Size Value (US$ Million) Analysis and Forecast By Product, 2023 to 2033
        6.3.1. Three-Pin Skull Clamp
        6.3.2. Four-Pin Skull Clamp
        6.3.3. Two-Pin Skull Clamp
    6.4. Y-o-Y Growth Trend Analysis By Product, 2018 to 2022
    6.5. Absolute $ Opportunity Analysis By Product, 2023 to 2033
7. Global Market Analysis 2018 to 2022 and Forecast 2023 to 2033, By Application
    7.1. Introduction / Key Findings
    7.2. Historical Market Size Value (US$ Million) Analysis By Application, 2018 to 2022
    7.3. Current and Future Market Size Value (US$ Million) Analysis and Forecast By Application, 2023 to 2033
        7.3.1. Surgery
        7.3.2. Medical Imaging
    7.4. Y-o-Y Growth Trend Analysis By Application, 2018 to 2022
    7.5. Absolute $ Opportunity Analysis By Application, 2023 to 2033
8. Global Market Analysis 2018 to 2022 and Forecast 2023 to 2033, By Material
    8.1. Introduction / Key Findings
    8.2. Historical Market Size Value (US$ Million) Analysis By Material, 2018 to 2022
    8.3. Current and Future Market Size Value (US$ Million) Analysis and Forecast By Material, 2023 to 2033
        8.3.1. Stainless Steel
        8.3.2. Aluminium Alloy
        8.3.3. Titanium
        8.3.4. Radiolucent
    8.4. Y-o-Y Growth Trend Analysis By Material, 2018 to 2022
    8.5. Absolute $ Opportunity Analysis By Material, 2023 to 2033
9. Global Market Analysis 2018 to 2022 and Forecast 2023 to 2033, By Accessories
    9.1. Introduction / Key Findings
    9.2. Historical Market Size Value (US$ Million) Analysis By Accessories, 2018 to 2022
    9.3. Current and Future Market Size Value (US$ Million) Analysis and Forecast By Accessories, 2023 to 2033
        9.3.1. Skull Pins
        9.3.2. Headrests
        9.3.3. Others
    9.4. Y-o-Y Growth Trend Analysis By Accessories, 2018 to 2022
    9.5. Absolute $ Opportunity Analysis By Accessories, 2023 to 2033
10. Global Market Analysis 2018 to 2022 and Forecast 2023 to 2033, By End User
    10.1. Introduction / Key Findings
    10.2. Historical Market Size Value (US$ Million) Analysis By End User, 2018 to 2022
    10.3. Current and Future Market Size Value (US$ Million) Analysis and Forecast By End User, 2023 to 2033
        10.3.1. Hospitals
        10.3.2. Specialty Clinics
        10.3.3. Ambulatory Surgical Centres
    10.4. Y-o-Y Growth Trend Analysis By End User, 2018 to 2022
    10.5. Absolute $ Opportunity Analysis By End User, 2023 to 2033
11. Global Market Analysis 2018 to 2022 and Forecast 2023 to 2033, By Region
    11.1. Introduction
    11.2. Historical Market Size Value (US$ Million) Analysis By Region, 2018 to 2022
    11.3. Current Market Size Value (US$ Million) Analysis and Forecast By Region, 2023 to 2033
        11.3.1. North America
        11.3.2. Latin America
        11.3.3. Europe
        11.3.4. South Asia
        11.3.5. East Asia
        11.3.6. Oceania
        11.3.7. MEA
    11.4. Market Attractiveness Analysis By Region
12. North America Market Analysis 2018 to 2022 and Forecast 2023 to 2033, By Country
    12.1. Historical Market Size Value (US$ Million) Trend Analysis By Market Taxonomy, 2018 to 2022
    12.2. Market Size Value (US$ Million) Forecast By Market Taxonomy, 2023 to 2033
        12.2.1. By Country
            12.2.1.1. USA
            12.2.1.2. Canada
        12.2.2. By Product
        12.2.3. By Application
        12.2.4. By Material
        12.2.5. By Accessories
        12.2.6. By End User
    12.3. Market Attractiveness Analysis
        12.3.1. By Country
        12.3.2. By Product
        12.3.3. By Application
        12.3.4. By Material
        12.3.5. By Accessories
        12.3.6. By End User
    12.4. Key Takeaways
13. Latin America Market Analysis 2018 to 2022 and Forecast 2023 to 2033, By Country
    13.1. Historical Market Size Value (US$ Million) Trend Analysis By Market Taxonomy, 2018 to 2022
    13.2. Market Size Value (US$ Million) Forecast By Market Taxonomy, 2023 to 2033
        13.2.1. By Country
            13.2.1.1. Brazil
            13.2.1.2. Mexico
            13.2.1.3. Rest of Latin America
        13.2.2. By Product
        13.2.3. By Application
        13.2.4. By Material
        13.2.5. By Accessories
        13.2.6. By End User
    13.3. Market Attractiveness Analysis
        13.3.1. By Country
        13.3.2. By Product
        13.3.3. By Application
        13.3.4. By Material
        13.3.5. By Accessories
        13.3.6. By End User
    13.4. Key Takeaways
14. Europe Market Analysis 2018 to 2022 and Forecast 2023 to 2033, By Country
    14.1. Historical Market Size Value (US$ Million) Trend Analysis By Market Taxonomy, 2018 to 2022
    14.2. Market Size Value (US$ Million) Forecast By Market Taxonomy, 2023 to 2033
        14.2.1. By Country
            14.2.1.1. Germany
            14.2.1.2. United Kingdom
            14.2.1.3. France
            14.2.1.4. Spain
            14.2.1.5. Italy
            14.2.1.6. Rest of Europe
        14.2.2. By Product
        14.2.3. By Application
        14.2.4. By Material
        14.2.5. By Accessories
        14.2.6. By End User
    14.3. Market Attractiveness Analysis
        14.3.1. By Country
        14.3.2. By Product
        14.3.3. By Application
        14.3.4. By Material
        14.3.5. By Accessories
        14.3.6. By End User
    14.4. Key Takeaways
15. South Asia Market Analysis 2018 to 2022 and Forecast 2023 to 2033, By Country
    15.1. Historical Market Size Value (US$ Million) Trend Analysis By Market Taxonomy, 2018 to 2022
    15.2. Market Size Value (US$ Million) Forecast By Market Taxonomy, 2023 to 2033
        15.2.1. By Country
            15.2.1.1. India
            15.2.1.2. Malaysia
            15.2.1.3. Singapore
            15.2.1.4. Thailand
            15.2.1.5. Rest of South Asia
        15.2.2. By Product
        15.2.3. By Application
        15.2.4. By Material
        15.2.5. By Accessories
        15.2.6. By End User
    15.3. Market Attractiveness Analysis
        15.3.1. By Country
        15.3.2. By Product
        15.3.3. By Application
        15.3.4. By Material
        15.3.5. By Accessories
        15.3.6. By End User
    15.4. Key Takeaways
16. East Asia Market Analysis 2018 to 2022 and Forecast 2023 to 2033, By Country
    16.1. Historical Market Size Value (US$ Million) Trend Analysis By Market Taxonomy, 2018 to 2022
    16.2. Market Size Value (US$ Million) Forecast By Market Taxonomy, 2023 to 2033
        16.2.1. By Country
            16.2.1.1. China
            16.2.1.2. Japan
            16.2.1.3. South Korea
        16.2.2. By Product
        16.2.3. By Application
        16.2.4. By Material
        16.2.5. By Accessories
        16.2.6. By End User
    16.3. Market Attractiveness Analysis
        16.3.1. By Country
        16.3.2. By Product
        16.3.3. By Application
        16.3.4. By Material
        16.3.5. By Accessories
        16.3.6. By End User
    16.4. Key Takeaways
17. Oceania Market Analysis 2018 to 2022 and Forecast 2023 to 2033, By Country
    17.1. Historical Market Size Value (US$ Million) Trend Analysis By Market Taxonomy, 2018 to 2022
    17.2. Market Size Value (US$ Million) Forecast By Market Taxonomy, 2023 to 2033
        17.2.1. By Country
            17.2.1.1. Australia
            17.2.1.2. New Zealand
        17.2.2. By Product
        17.2.3. By Application
        17.2.4. By Material
        17.2.5. By Accessories
        17.2.6. By End User
    17.3. Market Attractiveness Analysis
        17.3.1. By Country
        17.3.2. By Product
        17.3.3. By Application
        17.3.4. By Material
        17.3.5. By Accessories
        17.3.6. By End User
    17.4. Key Takeaways
18. MEA Market Analysis 2018 to 2022 and Forecast 2023 to 2033, By Country
    18.1. Historical Market Size Value (US$ Million) Trend Analysis By Market Taxonomy, 2018 to 2022
    18.2. Market Size Value (US$ Million) Forecast By Market Taxonomy, 2023 to 2033
        18.2.1. By Country
            18.2.1.1. GCC Countries
            18.2.1.2. South Africa
            18.2.1.3. Israel
            18.2.1.4. Rest of MEA
        18.2.2. By Product
        18.2.3. By Application
        18.2.4. By Material
        18.2.5. By Accessories
        18.2.6. By End User
    18.3. Market Attractiveness Analysis
        18.3.1. By Country
        18.3.2. By Product
        18.3.3. By Application
        18.3.4. By Material
        18.3.5. By Accessories
        18.3.6. By End User
    18.4. Key Takeaways
19. Key Countries Market Analysis
    19.1. USA
        19.1.1. Pricing Analysis
        19.1.2. Market Share Analysis, 2022
            19.1.2.1. By Product
            19.1.2.2. By Application
            19.1.2.3. By Material
            19.1.2.4. By Accessories
            19.1.2.5. By End User
    19.2. Canada
        19.2.1. Pricing Analysis
        19.2.2. Market Share Analysis, 2022
            19.2.2.1. By Product
            19.2.2.2. By Application
            19.2.2.3. By Material
            19.2.2.4. By Accessories
            19.2.2.5. By End User
    19.3. Brazil
        19.3.1. Pricing Analysis
        19.3.2. Market Share Analysis, 2022
            19.3.2.1. By Product
            19.3.2.2. By Application
            19.3.2.3. By Material
            19.3.2.4. By Accessories
            19.3.2.5. By End User
    19.4. Mexico
        19.4.1. Pricing Analysis
        19.4.2. Market Share Analysis, 2022
            19.4.2.1. By Product
            19.4.2.2. By Application
            19.4.2.3. By Material
            19.4.2.4. By Accessories
            19.4.2.5. By End User
    19.5. Germany
        19.5.1. Pricing Analysis
        19.5.2. Market Share Analysis, 2022
            19.5.2.1. By Product
            19.5.2.2. By Application
            19.5.2.3. By Material
            19.5.2.4. By Accessories
            19.5.2.5. By End User
    19.6. United Kingdom
        19.6.1. Pricing Analysis
        19.6.2. Market Share Analysis, 2022
            19.6.2.1. By Product
            19.6.2.2. By Application
            19.6.2.3. By Material
            19.6.2.4. By Accessories
            19.6.2.5. By End User
    19.7. France
        19.7.1. Pricing Analysis
        19.7.2. Market Share Analysis, 2022
            19.7.2.1. By Product
            19.7.2.2. By Application
            19.7.2.3. By Material
            19.7.2.4. By Accessories
            19.7.2.5. By End User
    19.8. Spain
        19.8.1. Pricing Analysis
        19.8.2. Market Share Analysis, 2022
            19.8.2.1. By Product
            19.8.2.2. By Application
            19.8.2.3. By Material
            19.8.2.4. By Accessories
            19.8.2.5. By End User
    19.9. Italy
        19.9.1. Pricing Analysis
        19.9.2. Market Share Analysis, 2022
            19.9.2.1. By Product
            19.9.2.2. By Application
            19.9.2.3. By Material
            19.9.2.4. By Accessories
            19.9.2.5. By End User
    19.10. India
        19.10.1. Pricing Analysis
        19.10.2. Market Share Analysis, 2022
            19.10.2.1. By Product
            19.10.2.2. By Application
            19.10.2.3. By Material
            19.10.2.4. By Accessories
            19.10.2.5. By End User
    19.11. Malaysia
        19.11.1. Pricing Analysis
        19.11.2. Market Share Analysis, 2022
            19.11.2.1. By Product
            19.11.2.2. By Application
            19.11.2.3. By Material
            19.11.2.4. By Accessories
            19.11.2.5. By End User
    19.12. Singapore
        19.12.1. Pricing Analysis
        19.12.2. Market Share Analysis, 2022
            19.12.2.1. By Product
            19.12.2.2. By Application
            19.12.2.3. By Material
            19.12.2.4. By Accessories
            19.12.2.5. By End User
    19.13. Thailand
        19.13.1. Pricing Analysis
        19.13.2. Market Share Analysis, 2022
            19.13.2.1. By Product
            19.13.2.2. By Application
            19.13.2.3. By Material
            19.13.2.4. By Accessories
            19.13.2.5. By End User
    19.14. China
        19.14.1. Pricing Analysis
        19.14.2. Market Share Analysis, 2022
            19.14.2.1. By Product
            19.14.2.2. By Application
            19.14.2.3. By Material
            19.14.2.4. By Accessories
            19.14.2.5. By End User
    19.15. Japan
        19.15.1. Pricing Analysis
        19.15.2. Market Share Analysis, 2022
            19.15.2.1. By Product
            19.15.2.2. By Application
            19.15.2.3. By Material
            19.15.2.4. By Accessories
            19.15.2.5. By End User
    19.16. South Korea
        19.16.1. Pricing Analysis
        19.16.2. Market Share Analysis, 2022
            19.16.2.1. By Product
            19.16.2.2. By Application
            19.16.2.3. By Material
            19.16.2.4. By Accessories
            19.16.2.5. By End User
    19.17. Australia
        19.17.1. Pricing Analysis
        19.17.2. Market Share Analysis, 2022
            19.17.2.1. By Product
            19.17.2.2. By Application
            19.17.2.3. By Material
            19.17.2.4. By Accessories
            19.17.2.5. By End User
    19.18. New Zealand
        19.18.1. Pricing Analysis
        19.18.2. Market Share Analysis, 2022
            19.18.2.1. By Product
            19.18.2.2. By Application
            19.18.2.3. By Material
            19.18.2.4. By Accessories
            19.18.2.5. By End User
    19.19. GCC Countries
        19.19.1. Pricing Analysis
        19.19.2. Market Share Analysis, 2022
            19.19.2.1. By Product
            19.19.2.2. By Application
            19.19.2.3. By Material
            19.19.2.4. By Accessories
            19.19.2.5. By End User
    19.20. South Africa
        19.20.1. Pricing Analysis
        19.20.2. Market Share Analysis, 2022
            19.20.2.1. By Product
            19.20.2.2. By Application
            19.20.2.3. By Material
            19.20.2.4. By Accessories
            19.20.2.5. By End User
    19.21. Israel
        19.21.1. Pricing Analysis
        19.21.2. Market Share Analysis, 2022
            19.21.2.1. By Product
            19.21.2.2. By Application
            19.21.2.3. By Material
            19.21.2.4. By Accessories
            19.21.2.5. By End User
20. Market Structure Analysis
    20.1. Competition Dashboard
    20.2. Competition Benchmarking
    20.3. Market Share Analysis of Top Players
        20.3.1. By Regional
        20.3.2. By Product
        20.3.3. By Application
        20.3.4. By Material
        20.3.5. By Accessories
        20.3.6. By End User
21. Competition Analysis
    21.1. Competition Deep Dive
        21.1.1. Black Forest Medical Group
            21.1.1.1. Overview
            21.1.1.2. Product Portfolio
            21.1.1.3. Profitability by Market Segments
            21.1.1.4. Sales Footprint
            21.1.1.5. Strategy Overview
                21.1.1.5.1. Marketing Strategy
        21.1.2. Integra LifeSciences Holdings Corp
            21.1.2.1. Overview
            21.1.2.2. Product Portfolio
            21.1.2.3. Profitability by Market Segments
            21.1.2.4. Sales Footprint
            21.1.2.5. Strategy Overview
                21.1.2.5.1. Marketing Strategy
        21.1.3. Hill Rom Holding Inc.
            21.1.3.1. Overview
            21.1.3.2. Product Portfolio
            21.1.3.3. Profitability by Market Segments
            21.1.3.4. Sales Footprint
            21.1.3.5. Strategy Overview
                21.1.3.5.1. Marketing Strategy
        21.1.4. Eschmann Technologies Ltd
            21.1.4.1. Overview
            21.1.4.2. Product Portfolio
            21.1.4.3. Profitability by Market Segments
            21.1.4.4. Sales Footprint
            21.1.4.5. Strategy Overview
                21.1.4.5.1. Marketing Strategy
        21.1.5. BD
            21.1.5.1. Overview
            21.1.5.2. Product Portfolio
            21.1.5.3. Profitability by Market Segments
            21.1.5.4. Sales Footprint
            21.1.5.5. Strategy Overview
                21.1.5.5.1. Marketing Strategy
        21.1.6. TeDan Surgical Innovations
            21.1.6.1. Overview
            21.1.6.2. Product Portfolio
            21.1.6.3. Profitability by Market Segments
            21.1.6.4. Sales Footprint
            21.1.6.5. Strategy Overview
                21.1.6.5.1. Marketing Strategy
        21.1.7. Herbert Thailand Co Ltd
            21.1.7.1. Overview
            21.1.7.2. Product Portfolio
            21.1.7.3. Profitability by Market Segments
            21.1.7.4. Sales Footprint
            21.1.7.5. Strategy Overview
                21.1.7.5.1. Marketing Strategy
        21.1.8. Medifa GmbH & Co KG
            21.1.8.1. Overview
            21.1.8.2. Product Portfolio
            21.1.8.3. Profitability by Market Segments
            21.1.8.4. Sales Footprint
            21.1.8.5. Strategy Overview
                21.1.8.5.1. Marketing Strategy
        21.1.9. Micromar Industria Com Ltda.
            21.1.9.1. Overview
            21.1.9.2. Product Portfolio
            21.1.9.3. Profitability by Market Segments
            21.1.9.4. Sales Footprint
            21.1.9.5. Strategy Overview
                21.1.9.5.1. Marketing Strategy
        21.1.10. Schaerer Medical AG
            21.1.10.1. Overview
            21.1.10.2. Product Portfolio
            21.1.10.3. Profitability by Market Segments
            21.1.10.4. Sales Footprint
            21.1.10.5. Strategy Overview
                21.1.10.5.1. Marketing Strategy
22. Assumptions & Acronyms Used
23. Research Methodology
Recommendations

Healthcare

Medical Protective Equipment Market

January 2023

REP-GB-11296

324 pages

Healthcare

Clamps Market

December 2024

REP-GB-1711

Upcoming

Explore Healthcare Insights

View Reports
Future Market Insights

Skull Clamp Market

Schedule a Call