Superconducting Magnets Market
A detailed analysis of Superconducting Magnets Market By Low Temperature Superconducting Magnets and High Temperature Superconducting Magnets
FMI Explores the Limitless Investment Opportunities in Superconducting Magnets Industry. Read the Full Market Report.
Superconducting Magnets Market Outlook (2023 to 2033)
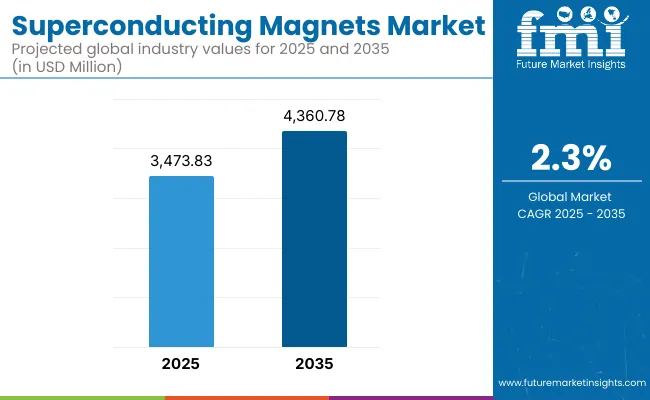
The superconducting magnets market size is projected to be worth US$ 3.3 billion in 2023. By 2033, the market is anticipated to reach US$ 4.3 billion at a CAGR of 2.6%. Superconducting magnet adoption has changed the game in several sectors, including healthcare, energy, and transportation.
One of the key factors propelling the market for superconducting magnets is the rising need for high-field superconducting magnets for MRI scanners, particle accelerators, and magnetic levitation (Maglev) trains. Other factors include the growing amount of money that important firms are investing in research and development to increase performance and lessen the cost of producing superconducting magnets.
The demand for superconducting magnets is expanding as a result of the increased need for renewable energy sources including wind and hydroelectric power production.
The market for superconducting magnets still confronts several difficulties, despite the industry's optimistic development forecasts. The complicated production process and the high cost of raw materials like rare earth metals result in key issues like the high manufacturing cost of superconducting magnets.
For businesses functioning in the sector, a significant barrier is the shortage of trained personnel and knowledge in producing and manipulating superconducting magnets. Another significant challenge is the intense competition for market share that exists in the industry, making it difficult for new competitors to establish themselves.
Opportunities in the Superconducting Magnets Industry:
- Growing demand for superconducting magnets in the healthcare, energy, and research sectors
- Potential for new applications and markets, such as space exploration and transportation
- Increasing investments in research and development of superconductor materials and manufacturing processes
- Collaboration and partnerships between industry players and research institutions
- Potential for mergers and acquisitions and consolidation of the industry
Latest Trends in the Superconducting Magnets Market:
- Development of high-temperature superconductors with better performance and lower costs
- Adoption of 3D printing and other additive manufacturing techniques for superconducting magnets
- The emergence of cryogen-free superconducting magnets that do not require liquid helium cooling
- Increasing use of artificial intelligence and machine learning for designing and optimizing superconducting magnets
- Integration of superconducting magnets with other technologies, such as quantum computing and high-speed transportation systems.
Attributes |
Details |
---|---|
Superconducting Magnets Market Size (2023) |
US$ 3.3 billion |
Superconducting Magnets Market Projected Size (2033) |
US$ 4.3 billion |
Value CAGR (2023 to 2033) |
2.6% |
Don't pay for what you don't need
Customize your report by selecting specific countries or regions and save 30%!
2018 to 2022 Superconducting Magnets Demand Outlook Compared to 2023 to 2033 Forecast
The demand for superconducting magnets expanded at a CAGR of 4.3% from 2018 to 2022, reaching US$ 3.3 billion in 2023. Due to the rising need for magnetic resonance imaging (MRI) in the healthcare sector, the superconducting magnets industry has seen notable expansion over the years.
The expansion of the aerospace and military industries, which employ superconducting magnets in a variety of applications has also helped the business. The demand for superconducting magnets in wind turbines and generators has also increased as a result of the spotlight being placed on renewable energy sources.
Future Forecast for Superconducting Magnets Industry
From 2023 to 2033, the global superconducting magnets industry is anticipated to expand at a CAGR of 2.6%. The market size is anticipated to reach US$ 4.3 billion during the projected period. The key drivers of development are anticipated to be the rising demand for MRI equipment and the expansion of the aerospace and military sectors.
Superconducting magnet utilization in energy storage systems and high-speed trains is also anticipated to contribute to the industry's continued development. The business is also anticipated to confront difficulties including a lack of rare earth resources and high production prices.
Manufacturers are anticipated to concentrate on creating alternate materials and investigating novel methods for the creation of superconducting magnets to overcome these difficulties. In addition, it is anticipated that increasing expenditure on research and development could spur industrial innovation and technical growth.
Comparative View of the Superconducting Magnets Market
Superconducting Magnets Market:
Attributes |
Superconducting Magnets Market |
---|---|
CAGR (2023 to 2033) |
2.6% |
Market Value (2033) |
US$ 4.3 billion |
Opportunity |
Growing demand for superconducting magnets in medical and healthcare applications. |
Key Trends |
Increasing use of high-temperature superconducting (HTS) materials for superconducting magnets. |
Magnetic Separator Market:
Attributes |
Magnetic Separator Market |
---|---|
CAGR (2023 to 2033) |
3.5% |
Market Value (2033) |
US$ 2.1 billion |
Opportunity |
Growing demand for magnetic separators in mining and mineral industries. |
Key Trends |
Development of advanced magnetic separator technologies for efficient separation and purification. |
Superconducting Wire Market:
Attributes |
Superconducting Wire Market |
---|---|
CAGR (2023 to 2033) |
9.5% |
Market Value (2033) |
US$ 2.75 billion |
Opportunity |
Increasing adoption of superconducting wires in energy and power applications. |
Key Trends |
The adoption of high-temperature superconducting (HTS) materials for superconducting magnets is increasing. |
Country-Wise Insights
The United States Emerges as the Leader in Superconducting Magnets Industry with 2.6% CAGR by 2033
Country |
Market Size (US$ million) by End of Forecast Period (2033) |
---|---|
The United States |
US$ 776.3 million |
Country |
CAGR % 2023 to End of Forecast (2033) |
---|---|
The United States |
2.6% |
The United States is anticipated to continue its position as a prominent player in the superconducting magnets business, with a predicted market size of US$ 776.3 million by 2033. One of the main drivers fueling development in the area is the increasing need for superconducting magnets in medical and research applications.
The creation of cutting-edge technology and beneficial government programs are also accelerating industry expansion. The industry is expanding as a result of the rising use of hybrid electric cars and renewable energy technology.
The United Kingdom to Witness Steady Growth in Superconducting Magnets Industry, Projected to Reach US$ 160.1 million by 2033
Country |
Market Size (US$ million) by End of Forecast Period (2033) |
---|---|
The United Kingdom |
US$ 160.1 million |
Country |
CAGR % 2023 to End of Forecast (2033) |
---|---|
The United Kingdom |
2.3% |
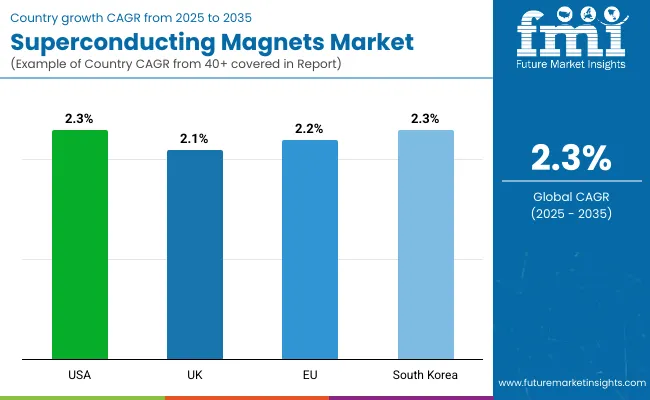
The United Kingdom market for superconducting magnets is anticipated to reach a market size of US$ 160.1 million by 2033, with a CAGR of 2.3% during the forecast period. The growth of the market is due to the factors such as
- The increasing demand for superconducting magnets in MRI and NMR machines.
- The rising number of research activities in the field of superconductivity.
The United Kingdom government's efforts to promote research and development activities and investments in renewable energy technologies are also contributing to the market's growth.
China's Robust Demand Projected to Drive Superconducting Magnets Industry to US$ 894.9 million by 2033
Country |
Market Size (US$ million) by End of Forecast Period (2033) |
---|---|
China |
US$ 894.9 million |
Country |
CAGR % 2023 to End of Forecast (2033) |
---|---|
China |
2.4% |
With a projected market size of US$ 894.9 million by 2033, China is expected to witness significant growth in the superconducting magnets industry. The increasing demand for superconducting magnets in various applications such as medical devices, transportation, and energy generation is driving the market growth. The government's efforts to promote clean energy and technological advancements are further fueling the growth of the market. In addition, the increasing adoption of electric vehicles in the country is also contributing to the expansion of the market.
Japan's Technological Advancements Likely to Boost Superconducting Magnets Market to US$ 763.2 million by 2033
Country |
Market Size (US$ million) by End of Forecast Period (2033) |
---|---|
Japan |
US$ 763.2 million |
Country |
CAGR % 2023 to End of Forecast (2033) |
---|---|
Japan |
2.6% |
The demand for superconducting magnets in Japan is estimated to attain a market size of US$ 763.2 million by 2033, with a CAGR of 2.6% during the projected period. The expansion of the industry is credited to the increasing demand for superconductive magnets in diverse medical uses, like MRI and NMR devices. The development of innovative technologies and favorable government initiatives to promote the adoption of renewable energy sources are also contributing to the market's growth.
South Korea's Thriving Electronics Industry to Propel Superconducting Magnets Market to US$ 183 million by 2033
Country |
Market Size (US$ million) by End of Forecast Period (2033) |
---|---|
South Korea |
US$ 183 million |
Country |
CAGR % 2023 to End of Forecast (2033) |
---|---|
South Korea |
2.3% |
With a projected market size of US$ 183 million by 2033, South Korea is expected to witness steady growth in the superconducting magnets industry. Factors driving the market growth in South Korea are:
- The increasing demand for superconducting magnets in various medical and research applications.
- The growing adoption of electric vehicles.
The development of innovative technologies and favorable government initiatives to promote the adoption of renewable energy sources are also contributing to the expansion of the market.
Get the data you need at a Fraction of the cost
Personalize your report by choosing insights you need
and save 40%!
Category-Wise Insights
Cutting-edge Innovations in Low-temperature Superconducting Magnets for Medical Technology
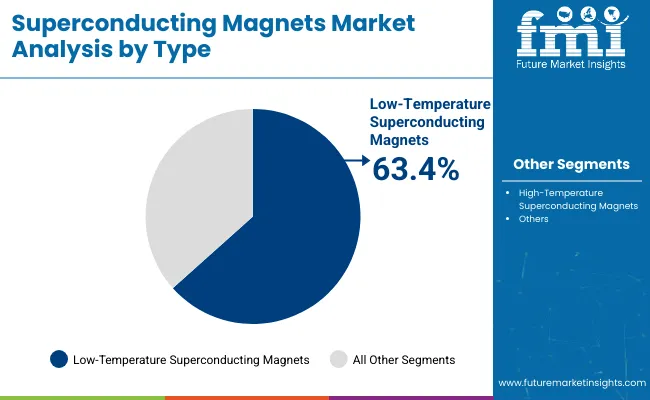
Low-temperature superconducting magnets are the industry's dominant sector, accounting for 57% of the market in 2023. This section is predicted to expand at a compound annual growth rate of 2.4% between 2023 and 2033. The primary factor propelling the expansion of this category is the increasing need for elevated magnetic forces in diverse uses like particle distributer, nuclear magnetic resonance, and magnetic separation. The rising funds allocated toward research and innovation to improve the effectiveness and productivity of these magnets are also aiding the expansion of this category.
Medical Devices & Equipment Application to Dominate the Superconducting Magnets Industry
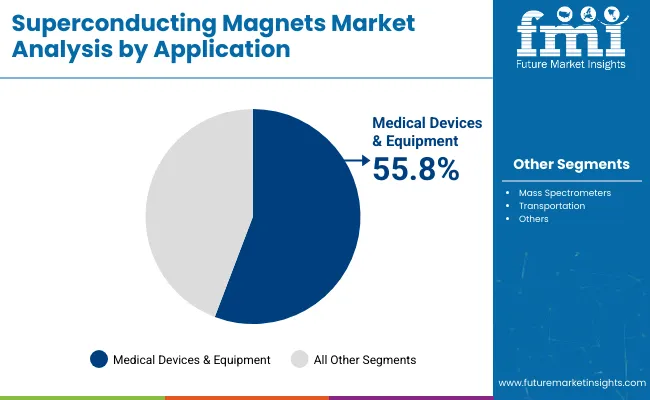
In terms of applications, medical devices & equipment is the dominating segment, holding a market share of 36% in 2023. This segment is anticipated to expand at a CAGR of 2.2% during the forecast period. The increasing adoption of superconducting magnets in medical imaging equipment such as MRI machines and proton therapy systems is driving the growth of this segment. The rising prevalence of chronic diseases and the increasing demand for early disease detection are also contributing to the growth of this segment.
How Key Players Stay Competitive in the Superconducting Magnets Industry?
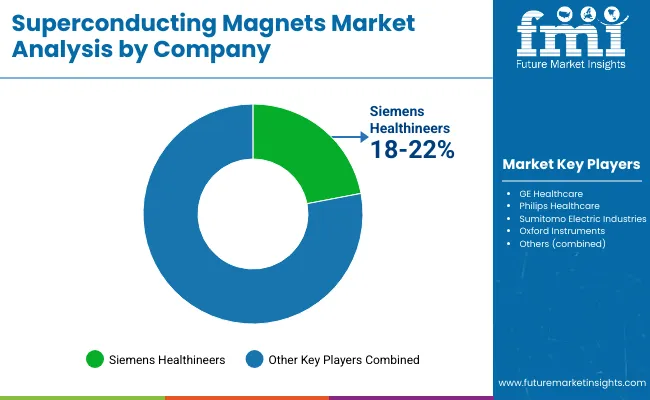
The superconducting magnets industry is highly competitive, with key players constantly innovating to maintain their position in the market. These players are focused on developing high-quality, reliable, and cost-effective products to meet the growing demand for superconducting magnets. Strategic collaborations and partnerships with research institutions and universities are also being pursued to develop new products and applications.
The superconducting magnets industry offers significant investment opportunities for new entrants despite the challenges. The increasing demand for superconducting magnets in various applications, including medical, scientific, and industrial, provides a favorable market landscape. New entrants can focus on developing innovative products and establishing strategic partnerships to expand their market presence.
Key Players in the Superconducting Magnets Industry
- Agilent Technologies, Inc.
- Bruker Corporation
- Fujikura Ltd.
- American Magnetics, Inc.
- ASG Superconductors SpA
How can Manufacturers/Service Providers Scale their Businesses in the Superconducting Magnets Market?
Strategies for Manufacturers/Service Providers to Scale Businesses in the Superconducting Magnets Industry |
---|
|
|
|
|
|
|
|
|
|
Key Developments in the Superconducting Magnets Market:
- Agilent Technologies, Inc. created a superconducting magnet system for use in their 9500 series gas chromatograph/mass spectrometer (GC/MS) systems, which offer high-performance analytical capabilities for a variety of applications.
- Bruker Corporation created a cryogen-free, superconducting magnet system for nuclear magnetic resonance (NMR) spectroscopy, removing the requirement for typical liquid helium-based cooling systems.
- Fujikura Co., Ltd. produced a high-temperature superconducting (HTS) wire with the best current carrying capacity and reduced power loss than ordinary copper wire, making it excellent for use in power transmission and medical applications.
Segmentation Analysis of the Superconducting Magnets Market
By Type:
- Low-temperature superconducting magnets
- High-temperature superconducting magnets
By Application:
- Medical Devices & Equipment
- Mass Spectrometers
- Transportation
- Others
By Region:
- North America
- Latin America
- Europe
- East Asia
- South Asia
- Oceania
- The Middle East & Africa
Frequently Asked Questions
What is the Historical Performance of the Market?
The market exhibited a 4.3% CAGR from 2018 to 2022.
What is the Growth Forecast for the Superconducting Magnets Market?
The market is forecast to register a CAGR of 2.6% through 2033.
What is the Top Trend in the Superconducting Magnets Market?
Development of high-temperature superconductors with better performance and lower costs.
What is the United Kingdom’s Market Growth Outlook?
The United Kingdom market is anticipated to record a CAGR of 2.3% from 2023 to 2033.
Which Region Dominates the Superconducting Magnets Market?
North America dominates the superconducting magnets market.
Table of Content
1. Executive Summary 1.1. Global Market Outlook 1.2. Demand-side Trends 1.3. Supply-side Trends 1.4. Technology Roadmap Analysis 1.5. Analysis and Recommendations 2. Market Overview 2.1. Market Coverage / Taxonomy 2.2. Market Definition / Scope / Limitations 3. Market Background 3.1. Market Dynamics 3.1.1. Drivers 3.1.2. Restraints 3.1.3. Opportunity 3.1.4. Trends 3.2. Scenario Forecast 3.2.1. Demand in Optimistic Scenario 3.2.2. Demand in Likely Scenario 3.2.3. Demand in Conservative Scenario 3.3. Opportunity Map Analysis 3.4. Product Life Cycle Analysis 3.5. Supply Chain Analysis 3.5.1. Supply Side Participants and their Roles 3.5.1.1. Producers 3.5.1.2. Mid-Level Participants (Traders/ Agents/ Brokers) 3.5.1.3. Wholesalers and Distributors 3.5.2. Value Added and Value Created at Node in the Supply Chain 3.5.3. List of Raw Material Suppliers 3.5.4. List of Existing and Potential Buyer’s 3.6. Investment Feasibility Matrix 3.7. Value Chain Analysis 3.7.1. Profit Margin Analysis 3.7.2. Wholesalers and Distributors 3.7.3. Retailers 3.8. PESTLE and Porter’s Analysis 3.9. Regulatory Landscape 3.9.1. By Key Regions 3.9.2. By Key Countries 3.10. Regional Parent Market Outlook 3.11. Production and Consumption Statistics 3.12. Import and Export Statistics 4. Global Market Analysis 2018 to 2022 and Forecast, 2023 to 2033 4.1. Historical Market Size Value (US$ Million) & Volume (Units) Analysis, 2018 to 2022 4.2. Current and Future Market Size Value (US$ Million) & Volume (Units) Projections, 2023 to 2033 4.2.1. Y-o-Y Growth Trend Analysis 4.2.2. Absolute $ Opportunity Analysis 5. Global Market Analysis 2018 to 2022 and Forecast 2023 to 2033, By Type 5.1. Introduction / Key Findings 5.2. Historical Market Size Value (US$ Million) & Volume (Units) Analysis By Type, 2018 to 2022 5.3. Current and Future Market Size Value (US$ Million) & Volume (Units) Analysis and Forecast By Type, 2023 to 2033 5.3.1. Low-temperature superconducting magnets 5.3.2. High-temperature superconducting magnets 5.4. Y-o-Y Growth Trend Analysis By Type, 2018 to 2022 5.5. Absolute $ Opportunity Analysis By Type, 2023 to 2033 6. Global Market Analysis 2018 to 2022 and Forecast 2023 to 2033, By Application 6.1. Introduction / Key Findings 6.2. Historical Market Size Value (US$ Million) & Volume (Units) Analysis By Application, 2018 to 2022 6.3. Current and Future Market Size Value (US$ Million) & Volume (Units) Analysis and Forecast By Application, 2023 to 2033 6.3.1. Medical Devices & Equipment 6.3.2. Mass Spectrometers 6.3.3. Transportation 6.3.4. Others 6.4. Y-o-Y Growth Trend Analysis By Application, 2018 to 2022 6.5. Absolute $ Opportunity Analysis By Application, 2023 to 2033 7. Global Market Analysis 2018 to 2022 and Forecast 2023 to 2033, By Region 7.1. Introduction 7.2. Historical Market Size Value (US$ Million) & Volume (Units) Analysis By Region, 2018 to 2022 7.3. Current Market Size Value (US$ Million) & Volume (Units) Analysis and Forecast By Region, 2023 to 2033 7.3.1. North America 7.3.2. Latin America 7.3.3. Europe 7.3.4. Asia Pacific 7.3.5. MEA 7.4. Market Attractiveness Analysis By Region 8. North America Market Analysis 2018 to 2022 and Forecast 2023 to 2033, By Country 8.1. Historical Market Size Value (US$ Million) & Volume (Units) Trend Analysis By Market Taxonomy, 2018 to 2022 8.2. Market Size Value (US$ Million) & Volume (Units) Forecast By Market Taxonomy, 2023 to 2033 8.2.1. By Country 8.2.1.1. USA 8.2.1.2. Canada 8.2.2. By Type 8.2.3. By Application 8.3. Market Attractiveness Analysis 8.3.1. By Country 8.3.2. By Type 8.3.3. By Application 8.4. Key Takeaways 9. Latin America Market Analysis 2018 to 2022 and Forecast 2023 to 2033, By Country 9.1. Historical Market Size Value (US$ Million) & Volume (Units) Trend Analysis By Market Taxonomy, 2018 to 2022 9.2. Market Size Value (US$ Million) & Volume (Units) Forecast By Market Taxonomy, 2023 to 2033 9.2.1. By Country 9.2.1.1. Brazil 9.2.1.2. Mexico 9.2.1.3. Rest of Latin America 9.2.2. By Type 9.2.3. By Application 9.3. Market Attractiveness Analysis 9.3.1. By Country 9.3.2. By Type 9.3.3. By Application 9.4. Key Takeaways 10. Europe Market Analysis 2018 to 2022 and Forecast 2023 to 2033, By Country 10.1. Historical Market Size Value (US$ Million) & Volume (Units) Trend Analysis By Market Taxonomy, 2018 to 2022 10.2. Market Size Value (US$ Million) & Volume (Units) Forecast By Market Taxonomy, 2023 to 2033 10.2.1. By Country 10.2.1.1. Germany 10.2.1.2. UK 10.2.1.3. France 10.2.1.4. Spain 10.2.1.5. Italy 10.2.1.6. Rest of Europe 10.2.2. By Type 10.2.3. By Application 10.3. Market Attractiveness Analysis 10.3.1. By Country 10.3.2. By Type 10.3.3. By Application 10.4. Key Takeaways 11. Asia Pacific Market Analysis 2018 to 2022 and Forecast 2023 to 2033, By Country 11.1. Historical Market Size Value (US$ Million) & Volume (Units) Trend Analysis By Market Taxonomy, 2018 to 2022 11.2. Market Size Value (US$ Million) & Volume (Units) Forecast By Market Taxonomy, 2023 to 2033 11.2.1. By Country 11.2.1.1. China 11.2.1.2. Japan 11.2.1.3. South Korea 11.2.1.4. Singapore 11.2.1.5. Thailand 11.2.1.6. Indonesia 11.2.1.7. Australia 11.2.1.8. New Zealand 11.2.1.9. Rest of Asia Pacific 11.2.2. By Type 11.2.3. By Application 11.3. Market Attractiveness Analysis 11.3.1. By Country 11.3.2. By Type 11.3.3. By Application 11.4. Key Takeaways 12. MEA Market Analysis 2018 to 2022 and Forecast 2023 to 2033, By Country 12.1. Historical Market Size Value (US$ Million) & Volume (Units) Trend Analysis By Market Taxonomy, 2018 to 2022 12.2. Market Size Value (US$ Million) & Volume (Units) Forecast By Market Taxonomy, 2023 to 2033 12.2.1. By Country 12.2.1.1. GCC Countries 12.2.1.2. South Africa 12.2.1.3. Israel 12.2.1.4. Rest of MEA 12.2.2. By Type 12.2.3. By Application 12.3. Market Attractiveness Analysis 12.3.1. By Country 12.3.2. By Type 12.3.3. By Application 12.4. Key Takeaways 13. Key Countries Market Analysis 13.1. USA 13.1.1. Pricing Analysis 13.1.2. Market Share Analysis, 2022 13.1.2.1. By Type 13.1.2.2. By Application 13.2. Canada 13.2.1. Pricing Analysis 13.2.2. Market Share Analysis, 2022 13.2.2.1. By Type 13.2.2.2. By Application 13.3. Brazil 13.3.1. Pricing Analysis 13.3.2. Market Share Analysis, 2022 13.3.2.1. By Type 13.3.2.2. By Application 13.4. Mexico 13.4.1. Pricing Analysis 13.4.2. Market Share Analysis, 2022 13.4.2.1. By Type 13.4.2.2. By Application 13.5. Germany 13.5.1. Pricing Analysis 13.5.2. Market Share Analysis, 2022 13.5.2.1. By Type 13.5.2.2. By Application 13.6. UK 13.6.1. Pricing Analysis 13.6.2. Market Share Analysis, 2022 13.6.2.1. By Type 13.6.2.2. By Application 13.7. France 13.7.1. Pricing Analysis 13.7.2. Market Share Analysis, 2022 13.7.2.1. By Type 13.7.2.2. By Application 13.8. Spain 13.8.1. Pricing Analysis 13.8.2. Market Share Analysis, 2022 13.8.2.1. By Type 13.8.2.2. By Application 13.9. Italy 13.9.1. Pricing Analysis 13.9.2. Market Share Analysis, 2022 13.9.2.1. By Type 13.9.2.2. By Application 13.10. China 13.10.1. Pricing Analysis 13.10.2. Market Share Analysis, 2022 13.10.2.1. By Type 13.10.2.2. By Application 13.11. Japan 13.11.1. Pricing Analysis 13.11.2. Market Share Analysis, 2022 13.11.2.1. By Type 13.11.2.2. By Application 13.12. South Korea 13.12.1. Pricing Analysis 13.12.2. Market Share Analysis, 2022 13.12.2.1. By Type 13.12.2.2. By Application 13.13. Singapore 13.13.1. Pricing Analysis 13.13.2. Market Share Analysis, 2022 13.13.2.1. By Type 13.13.2.2. By Application 13.14. Thailand 13.14.1. Pricing Analysis 13.14.2. Market Share Analysis, 2022 13.14.2.1. By Type 13.14.2.2. By Application 13.15. Indonesia 13.15.1. Pricing Analysis 13.15.2. Market Share Analysis, 2022 13.15.2.1. By Type 13.15.2.2. By Application 13.16. Australia 13.16.1. Pricing Analysis 13.16.2. Market Share Analysis, 2022 13.16.2.1. By Type 13.16.2.2. By Application 13.17. New Zealand 13.17.1. Pricing Analysis 13.17.2. Market Share Analysis, 2022 13.17.2.1. By Type 13.17.2.2. By Application 13.18. GCC Countries 13.18.1. Pricing Analysis 13.18.2. Market Share Analysis, 2022 13.18.2.1. By Type 13.18.2.2. By Application 13.19. South Africa 13.19.1. Pricing Analysis 13.19.2. Market Share Analysis, 2022 13.19.2.1. By Type 13.19.2.2. By Application 13.20. Israel 13.20.1. Pricing Analysis 13.20.2. Market Share Analysis, 2022 13.20.2.1. By Type 13.20.2.2. By Application 14. Market Structure Analysis 14.1. Competition Dashboard 14.2. Competition Benchmarking 14.3. Market Share Analysis of Top Players 14.3.1. By Regional 14.3.2. By Type 14.3.3. By Application 15. Competition Analysis 15.1. Competition Deep Dive 15.1.1. Agilent Technologies, Inc. 15.1.1.1. Overview 15.1.1.2. Product Portfolio 15.1.1.3. Profitability by Market Segments 15.1.1.4. Sales Footprint 15.1.1.5. Strategy Overview 15.1.1.5.1. Marketing Strategy 15.1.1.5.2. Product Strategy 15.1.1.5.3. Channel Strategy 15.1.2. Bruker Corporation 15.1.2.1. Overview 15.1.2.2. Product Portfolio 15.1.2.3. Profitability by Market Segments 15.1.2.4. Sales Footprint 15.1.2.5. Strategy Overview 15.1.2.5.1. Marketing Strategy 15.1.2.5.2. Product Strategy 15.1.2.5.3. Channel Strategy 15.1.3. Fujikura Ltd 15.1.3.1. Overview 15.1.3.2. Product Portfolio 15.1.3.3. Profitability by Market Segments 15.1.3.4. Sales Footprint 15.1.3.5. Strategy Overview 15.1.3.5.1. Marketing Strategy 15.1.3.5.2. Product Strategy 15.1.3.5.3. Channel Strategy 15.1.4. American Magnetics, Inc. 15.1.4.1. Overview 15.1.4.2. Product Portfolio 15.1.4.3. Profitability by Market Segments 15.1.4.4. Sales Footprint 15.1.4.5. Strategy Overview 15.1.4.5.1. Marketing Strategy 15.1.4.5.2. Product Strategy 15.1.4.5.3. Channel Strategy 15.1.5. ASG Superconductors SpA 15.1.5.1. Overview 15.1.5.2. Product Portfolio 15.1.5.3. Profitability by Market Segments 15.1.5.4. Sales Footprint 15.1.5.5. Strategy Overview 15.1.5.5.1. Marketing Strategy 15.1.5.5.2. Product Strategy 15.1.5.5.3. Channel Strategy 15.1.6. Cryomagnetics, Inc. 15.1.6.1. Overview 15.1.6.2. Product Portfolio 15.1.6.3. Profitability by Market Segments 15.1.6.4. Sales Footprint 15.1.6.5. Strategy Overview 15.1.6.5.1. Marketing Strategy 15.1.6.5.2. Product Strategy 15.1.6.5.3. Channel Strategy 15.1.7. Elytt Energy 15.1.7.1. Overview 15.1.7.2. Product Portfolio 15.1.7.3. Profitability by Market Segments 15.1.7.4. Sales Footprint 15.1.7.5. Strategy Overview 15.1.7.5.1. Marketing Strategy 15.1.7.5.2. Product Strategy 15.1.7.5.3. Channel Strategy 15.1.8. Cryogenic Ltd 15.1.8.1. Overview 15.1.8.2. Product Portfolio 15.1.8.3. Profitability by Market Segments 15.1.8.4. Sales Footprint 15.1.8.5. Strategy Overview 15.1.8.5.1. Marketing Strategy 15.1.8.5.2. Product Strategy 15.1.8.5.3. Channel Strategy 15.1.9. Advanced Magnet Lab, Inc 15.1.9.1. Overview 15.1.9.2. Product Portfolio 15.1.9.3. Profitability by Market Segments 15.1.9.4. Sales Footprint 15.1.9.5. Strategy Overview 15.1.9.5.1. Marketing Strategy 15.1.9.5.2. Product Strategy 15.1.9.5.3. Channel Strategy 15.1.10. Bilfinger SE 15.1.10.1. Overview 15.1.10.2. Product Portfolio 15.1.10.3. Profitability by Market Segments 15.1.10.4. Sales Footprint 15.1.10.5. Strategy Overview 15.1.10.5.1. Marketing Strategy 15.1.10.5.2. Product Strategy 15.1.10.5.3. Channel Strategy 16. Assumptions & Acronyms Used 17. Research Methodology
Don't pay for what you don't need
Customize your report by selecting specific countries or regions and save 30%!
List of Tables
Table 1: Global Market Value (US$ Million) Forecast by Region, 2018 to 2033 Table 2: Global Market Volume (Units) Forecast by Region, 2018 to 2033 Table 3: Global Market Value (US$ Million) Forecast by Type, 2018 to 2033 Table 4: Global Market Volume (Units) Forecast by Type, 2018 to 2033 Table 5: Global Market Value (US$ Million) Forecast by Application, 2018 to 2033 Table 6: Global Market Volume (Units) Forecast by Application, 2018 to 2033 Table 7: North America Market Value (US$ Million) Forecast by Country, 2018 to 2033 Table 8: North America Market Volume (Units) Forecast by Country, 2018 to 2033 Table 9: North America Market Value (US$ Million) Forecast by Type, 2018 to 2033 Table 10: North America Market Volume (Units) Forecast by Type, 2018 to 2033 Table 11: North America Market Value (US$ Million) Forecast by Application, 2018 to 2033 Table 12: North America Market Volume (Units) Forecast by Application, 2018 to 2033 Table 13: Latin America Market Value (US$ Million) Forecast by Country, 2018 to 2033 Table 14: Latin America Market Volume (Units) Forecast by Country, 2018 to 2033 Table 15: Latin America Market Value (US$ Million) Forecast by Type, 2018 to 2033 Table 16: Latin America Market Volume (Units) Forecast by Type, 2018 to 2033 Table 17: Latin America Market Value (US$ Million) Forecast by Application, 2018 to 2033 Table 18: Latin America Market Volume (Units) Forecast by Application, 2018 to 2033 Table 19: Europe Market Value (US$ Million) Forecast by Country, 2018 to 2033 Table 20: Europe Market Volume (Units) Forecast by Country, 2018 to 2033 Table 21: Europe Market Value (US$ Million) Forecast by Type, 2018 to 2033 Table 22: Europe Market Volume (Units) Forecast by Type, 2018 to 2033 Table 23: Europe Market Value (US$ Million) Forecast by Application, 2018 to 2033 Table 24: Europe Market Volume (Units) Forecast by Application, 2018 to 2033 Table 25: Asia Pacific Market Value (US$ Million) Forecast by Country, 2018 to 2033 Table 26: Asia Pacific Market Volume (Units) Forecast by Country, 2018 to 2033 Table 27: Asia Pacific Market Value (US$ Million) Forecast by Type, 2018 to 2033 Table 28: Asia Pacific Market Volume (Units) Forecast by Type, 2018 to 2033 Table 29: Asia Pacific Market Value (US$ Million) Forecast by Application, 2018 to 2033 Table 30: Asia Pacific Market Volume (Units) Forecast by Application, 2018 to 2033 Table 31: MEA Market Value (US$ Million) Forecast by Country, 2018 to 2033 Table 32: MEA Market Volume (Units) Forecast by Country, 2018 to 2033 Table 33: MEA Market Value (US$ Million) Forecast by Type, 2018 to 2033 Table 34: MEA Market Volume (Units) Forecast by Type, 2018 to 2033 Table 35: MEA Market Value (US$ Million) Forecast by Application, 2018 to 2033 Table 36: MEA Market Volume (Units) Forecast by Application, 2018 to 2033
List of Charts
Figure 1: Global Market Value (US$ Million) by Type, 2023 to 2033 Figure 2: Global Market Value (US$ Million) by Application, 2023 to 2033 Figure 3: Global Market Value (US$ Million) by Region, 2023 to 2033 Figure 4: Global Market Value (US$ Million) Analysis by Region, 2018 to 2033 Figure 5: Global Market Volume (Units) Analysis by Region, 2018 to 2033 Figure 6: Global Market Value Share (%) and BPS Analysis by Region, 2023 to 2033 Figure 7: Global Market Y-o-Y Growth (%) Projections by Region, 2023 to 2033 Figure 8: Global Market Value (US$ Million) Analysis by Type, 2018 to 2033 Figure 9: Global Market Volume (Units) Analysis by Type, 2018 to 2033 Figure 10: Global Market Value Share (%) and BPS Analysis by Type, 2023 to 2033 Figure 11: Global Market Y-o-Y Growth (%) Projections by Type, 2023 to 2033 Figure 12: Global Market Value (US$ Million) Analysis by Application, 2018 to 2033 Figure 13: Global Market Volume (Units) Analysis by Application, 2018 to 2033 Figure 14: Global Market Value Share (%) and BPS Analysis by Application, 2023 to 2033 Figure 15: Global Market Y-o-Y Growth (%) Projections by Application, 2023 to 2033 Figure 16: Global Market Attractiveness by Type, 2023 to 2033 Figure 17: Global Market Attractiveness by Application, 2023 to 2033 Figure 18: Global Market Attractiveness by Region, 2023 to 2033 Figure 19: North America Market Value (US$ Million) by Type, 2023 to 2033 Figure 20: North America Market Value (US$ Million) by Application, 2023 to 2033 Figure 21: North America Market Value (US$ Million) by Country, 2023 to 2033 Figure 22: North America Market Value (US$ Million) Analysis by Country, 2018 to 2033 Figure 23: North America Market Volume (Units) Analysis by Country, 2018 to 2033 Figure 24: North America Market Value Share (%) and BPS Analysis by Country, 2023 to 2033 Figure 25: North America Market Y-o-Y Growth (%) Projections by Country, 2023 to 2033 Figure 26: North America Market Value (US$ Million) Analysis by Type, 2018 to 2033 Figure 27: North America Market Volume (Units) Analysis by Type, 2018 to 2033 Figure 28: North America Market Value Share (%) and BPS Analysis by Type, 2023 to 2033 Figure 29: North America Market Y-o-Y Growth (%) Projections by Type, 2023 to 2033 Figure 30: North America Market Value (US$ Million) Analysis by Application, 2018 to 2033 Figure 31: North America Market Volume (Units) Analysis by Application, 2018 to 2033 Figure 32: North America Market Value Share (%) and BPS Analysis by Application, 2023 to 2033 Figure 33: North America Market Y-o-Y Growth (%) Projections by Application, 2023 to 2033 Figure 34: North America Market Attractiveness by Type, 2023 to 2033 Figure 35: North America Market Attractiveness by Application, 2023 to 2033 Figure 36: North America Market Attractiveness by Country, 2023 to 2033 Figure 37: Latin America Market Value (US$ Million) by Type, 2023 to 2033 Figure 38: Latin America Market Value (US$ Million) by Application, 2023 to 2033 Figure 39: Latin America Market Value (US$ Million) by Country, 2023 to 2033 Figure 40: Latin America Market Value (US$ Million) Analysis by Country, 2018 to 2033 Figure 41: Latin America Market Volume (Units) Analysis by Country, 2018 to 2033 Figure 42: Latin America Market Value Share (%) and BPS Analysis by Country, 2023 to 2033 Figure 43: Latin America Market Y-o-Y Growth (%) Projections by Country, 2023 to 2033 Figure 44: Latin America Market Value (US$ Million) Analysis by Type, 2018 to 2033 Figure 45: Latin America Market Volume (Units) Analysis by Type, 2018 to 2033 Figure 46: Latin America Market Value Share (%) and BPS Analysis by Type, 2023 to 2033 Figure 47: Latin America Market Y-o-Y Growth (%) Projections by Type, 2023 to 2033 Figure 48: Latin America Market Value (US$ Million) Analysis by Application, 2018 to 2033 Figure 49: Latin America Market Volume (Units) Analysis by Application, 2018 to 2033 Figure 50: Latin America Market Value Share (%) and BPS Analysis by Application, 2023 to 2033 Figure 51: Latin America Market Y-o-Y Growth (%) Projections by Application, 2023 to 2033 Figure 52: Latin America Market Attractiveness by Type, 2023 to 2033 Figure 53: Latin America Market Attractiveness by Application, 2023 to 2033 Figure 54: Latin America Market Attractiveness by Country, 2023 to 2033 Figure 55: Europe Market Value (US$ Million) by Type, 2023 to 2033 Figure 56: Europe Market Value (US$ Million) by Application, 2023 to 2033 Figure 57: Europe Market Value (US$ Million) by Country, 2023 to 2033 Figure 58: Europe Market Value (US$ Million) Analysis by Country, 2018 to 2033 Figure 59: Europe Market Volume (Units) Analysis by Country, 2018 to 2033 Figure 60: Europe Market Value Share (%) and BPS Analysis by Country, 2023 to 2033 Figure 61: Europe Market Y-o-Y Growth (%) Projections by Country, 2023 to 2033 Figure 62: Europe Market Value (US$ Million) Analysis by Type, 2018 to 2033 Figure 63: Europe Market Volume (Units) Analysis by Type, 2018 to 2033 Figure 64: Europe Market Value Share (%) and BPS Analysis by Type, 2023 to 2033 Figure 65: Europe Market Y-o-Y Growth (%) Projections by Type, 2023 to 2033 Figure 66: Europe Market Value (US$ Million) Analysis by Application, 2018 to 2033 Figure 67: Europe Market Volume (Units) Analysis by Application, 2018 to 2033 Figure 68: Europe Market Value Share (%) and BPS Analysis by Application, 2023 to 2033 Figure 69: Europe Market Y-o-Y Growth (%) Projections by Application, 2023 to 2033 Figure 70: Europe Market Attractiveness by Type, 2023 to 2033 Figure 71: Europe Market Attractiveness by Application, 2023 to 2033 Figure 72: Europe Market Attractiveness by Country, 2023 to 2033 Figure 73: Asia Pacific Market Value (US$ Million) by Type, 2023 to 2033 Figure 74: Asia Pacific Market Value (US$ Million) by Application, 2023 to 2033 Figure 75: Asia Pacific Market Value (US$ Million) by Country, 2023 to 2033 Figure 76: Asia Pacific Market Value (US$ Million) Analysis by Country, 2018 to 2033 Figure 77: Asia Pacific Market Volume (Units) Analysis by Country, 2018 to 2033 Figure 78: Asia Pacific Market Value Share (%) and BPS Analysis by Country, 2023 to 2033 Figure 79: Asia Pacific Market Y-o-Y Growth (%) Projections by Country, 2023 to 2033 Figure 80: Asia Pacific Market Value (US$ Million) Analysis by Type, 2018 to 2033 Figure 81: Asia Pacific Market Volume (Units) Analysis by Type, 2018 to 2033 Figure 82: Asia Pacific Market Value Share (%) and BPS Analysis by Type, 2023 to 2033 Figure 83: Asia Pacific Market Y-o-Y Growth (%) Projections by Type, 2023 to 2033 Figure 84: Asia Pacific Market Value (US$ Million) Analysis by Application, 2018 to 2033 Figure 85: Asia Pacific Market Volume (Units) Analysis by Application, 2018 to 2033 Figure 86: Asia Pacific Market Value Share (%) and BPS Analysis by Application, 2023 to 2033 Figure 87: Asia Pacific Market Y-o-Y Growth (%) Projections by Application, 2023 to 2033 Figure 88: Asia Pacific Market Attractiveness by Type, 2023 to 2033 Figure 89: Asia Pacific Market Attractiveness by Application, 2023 to 2033 Figure 90: Asia Pacific Market Attractiveness by Country, 2023 to 2033 Figure 91: MEA Market Value (US$ Million) by Type, 2023 to 2033 Figure 92: MEA Market Value (US$ Million) by Application, 2023 to 2033 Figure 93: MEA Market Value (US$ Million) by Country, 2023 to 2033 Figure 94: MEA Market Value (US$ Million) Analysis by Country, 2018 to 2033 Figure 95: MEA Market Volume (Units) Analysis by Country, 2018 to 2033 Figure 96: MEA Market Value Share (%) and BPS Analysis by Country, 2023 to 2033 Figure 97: MEA Market Y-o-Y Growth (%) Projections by Country, 2023 to 2033 Figure 98: MEA Market Value (US$ Million) Analysis by Type, 2018 to 2033 Figure 99: MEA Market Volume (Units) Analysis by Type, 2018 to 2033 Figure 100: MEA Market Value Share (%) and BPS Analysis by Type, 2023 to 2033 Figure 101: MEA Market Y-o-Y Growth (%) Projections by Type, 2023 to 2033 Figure 102: MEA Market Value (US$ Million) Analysis by Application, 2018 to 2033 Figure 103: MEA Market Volume (Units) Analysis by Application, 2018 to 2033 Figure 104: MEA Market Value Share (%) and BPS Analysis by Application, 2023 to 2033 Figure 105: MEA Market Y-o-Y Growth (%) Projections by Application, 2023 to 2033 Figure 106: MEA Market Attractiveness by Type, 2023 to 2033 Figure 107: MEA Market Attractiveness by Application, 2023 to 2033 Figure 108: MEA Market Attractiveness by Country, 2023 to 2033
Recommendations
Explore Industrial Automation Insights
View Reports