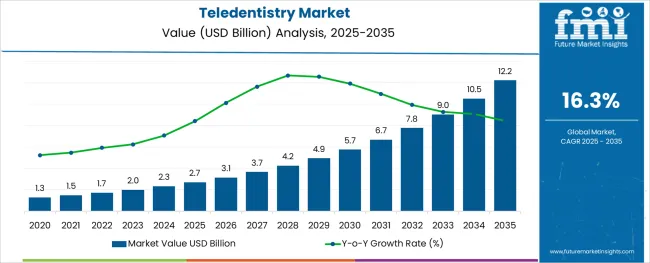
The global Teledentistry market is likely to garner a market value of USD 1.45 Billion in 2022 and further is expected to accumulate a market value of USD 6.56 Billion by registering a CAGR of 16.30% across the forecast period from 2022 to 2032.
Growth of the teledentistry market can be attributed to the growing need to reduce dental care costs, the wide adoption of mHealth in dental practices, the internet and smartphone feasibilities in developing countries, and growing awareness regarding teledentistry platforms. The market for teledentistry registered a CAGR of 9% in the historical period 2016 to 2021.
Data Points | Key Statistics |
---|---|
Expected Market Value (2022) | USD 1.45 Billion |
Anticipated Forecast Value (2032) | USD 6.56 Billion |
Projected Growth Rate (2022 to 2032) | 16.30% CAGR |
According to Future Market Insights- the market for teledentistry reflected a value of 9% during the historical period, 2017 to 2021. Virtual dental visits have enabled the reach of oral healthcare in underserved areas of developing countries.
Furthermore, rising technology penetration has a significant impact on the entire healthcare system, including telehealth services such as teledentistry. Growing efforts by notable players to set themselves apart from competitors have increased support for technological advancements in teledentistry at the lowest cost possible, which has ultimately led to industry growth.
In addition, improved patient safety and, perhaps, increased convenience of remote dental care are prominent market drivers. Thus, the market for teledentistry is expected to register a CAGR of 16.3% in the forecast period 2022 to 2032.
COVID-19 Pandemic shaping the landscape for Teledentistry
Teledentistry service was extensively implemented during the COVID-19 pandemic as it decreases the patient-patient and patient-healthcare professionals’ contact, thereby minimizing the risk of disease transmission. The risk of transmission through dental procedures is higher as the virus spreads through aerosols of the mouth, teeth, and around the nose.
Hence, dental practices have a higher risk of cross-infections with such viruses. Therefore, it was recommended to consult any dental practices online or in virtual mode. This increased the attention toward teledentistry services. This provided an opportunity for oral care and dental healthcare providers to initiate a new path in dentistry.
In addition, dental virtual visits have enabled the reach of oral healthcare in underserved areas of developing countries. Furthermore, rising technology penetration has a significant impact on the entire healthcare system, including telehealth services such as teledentistry.
Growing efforts by notable players to set themselves apart from competitors have increased support for technological advancements in teledentistry at the lowest cost possible, which has ultimately led to industry growth. In addition, improved patient safety and, perhaps, increased convenience of remote dental care are prominent market drivers.
The versatility of Telemedicine Technology boosting the growth of Teledentistry
During the COVID-19 pandemic, various new players entered the market with innovative and advanced tele-dental solutions to aid remote dental care. Some companies such as Toothpick offer 24/7 access to dental services with top licensed dentists across the world.
In addition, the patients have reported that the teledentistry examination is feasible, valid, and saves money and time. According to an article published by Oral Health in August 2021, 75% of dentists reported that their teledentistry platforms were successful. Due to its wide applications, teledentistry practices are here to stay for a long even after post-covid.
Moreover, telemedicine technologies such as teledentistry are considered the most versatile to deliver dental care, dental education, and telemonitoring remotely at a distance. This enables wide access to patient-centric care in remote locations ensuring the safety of patients from the viral transmission.
Some of the companies in the market have witnessed exponential growth during the COVID-19 pandemic in comparison to previous years. In addition, the continuous investments in such technologies are expanding the opportunities for new teledentistry solutions in the near future. These factors are anticipated to propel the growth of the market.
Laws pertaining to teledentistry along with reimbursement policies restraining market growth
Although the teledentistry industry gained massive momentum during the COVID-19 pandemic, it is facing certain challenges currently. The laws regarding teledentistry change from country to country.
Thus, not following the rules and regulations according to the law may lead to penalties. Lack of knowledge regarding the reimbursement policies of teledentistry services is creating confusion and obstacles to the growth of the market.
Internet of Things making teledentistry feasible in North America
The growth of this market is estimated to grow owing to key driving factors such as the growth in the interventions by public-private organizations for improving oral health and increasing adoption of teledentistry across North America.
In addition, the growth of developing technology along with integrating the Internet of Things to improve the overall dental treatment experience, especially in the remote model is working in the favor of the market. Thus, North America is expected to hold a substantial market share in the teledentistry market.
Technology increasing accessibility to teledentistry in the Asia Pacific
Largely developing and underdeveloped regions in the Asia Pacific region are contributing to the growth of the teledentistry market. As accessibility to rural areas is difficult, the intervention of technology is playing a key role in the growth of the market. Moreover, consumers too have shown a keen inclination towards investing in teledentistry owing to favorable results.
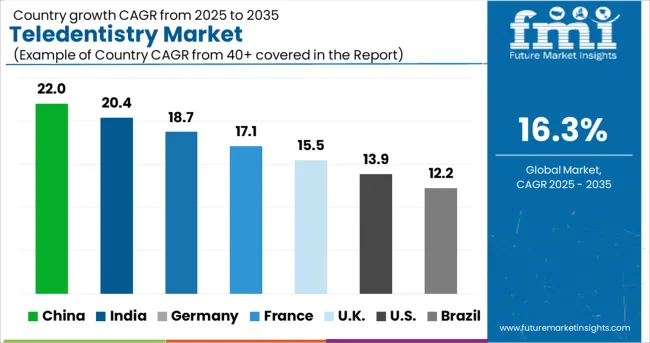
Furthermore, the penetration of 5G services along with the increasing use of the internet of things is favoring the growth of the teledentistry market in the Asia Pacific. Moreover, the growth of the Asia Pacific teledentistry market can be attributed to growing government initiatives in teledentistry.
IT Companies and rising Healthcare Expenditures driving Teledentistry Market Growth
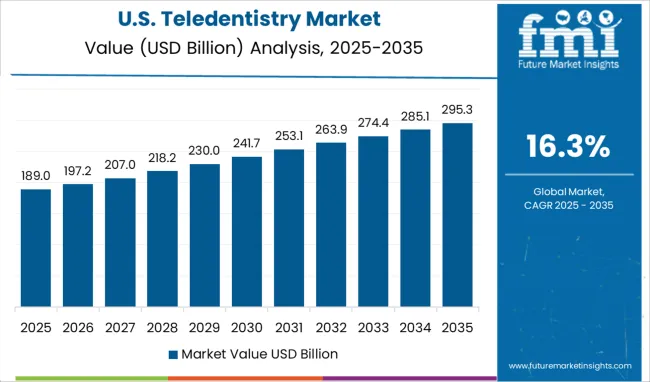
The presence of a large number of key players operating in the US with better teledentistry solutions is contributing to the growth of the teledentistry market. In addition, the high healthcare IT expenditure, excellent internet connectivity, wide usage of smartphones, and growing awareness regarding virtual dental care among the general public are driving the overall growth of the market.
The constant development of cloud-based platforms and their emergence in developing teledentistry companies are fueling the industry's growth. Thus, the US is expected to possess a 40% market share of the teledentistry market in 2022.
Demand for dental treatments spurring the growth of Teledentistry in India
India is anticipated to register the fastest CAGR during the forecast period due to the improving penetration of mobile health in dental practices. The growing demand for convenient dental treatments in remote and rural areas of the region is supporting the growth of the market.
Furthermore, increasing investments in the healthcare sector in countries such as India are expected to boost the market growth. Thus, India is expected to possess a 35% market share in the teledentistry market in 2022.
Internet of Things creating lucrative opportunities for software and services segment
The rising adoption of wirelessly connected care technologies in dental healthcare, initiatives by key companies, and the availability of a large number of dental software and services is increasing the dependency on wireless technology. In addition, the integration of the Internet of Things is positively influencing the demand for the teledentistry market.
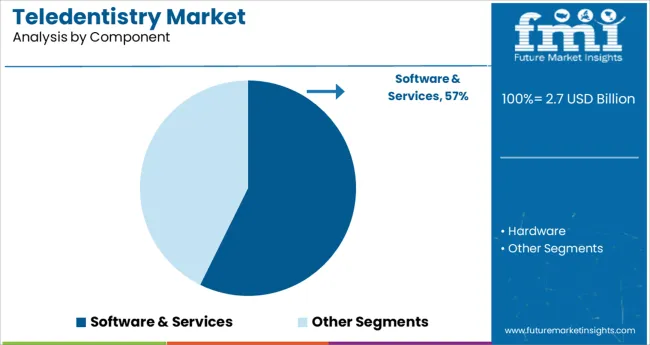
The increasing number of people adopting teledentistry software due to its convenience and cost-effectiveness is anticipated to drive the market over the forecast period. The software and services segment is expected to dominate the teledentistry market by accumulating a market for 73% market share for teledentistry market.
The hardware segment is estimated to register the fastest growth rate over the forecast period owing to technological advancements in launching new dental care hardware in the market. Some of the dental hardware such as electric toothbrushes that send feedback on oral health to teledentistry software are highly aiding the therapeutic application of tele-dental mode.
Easy accessibility increasing dependency on cloud-based technology for teledentistry
The factors contributing to the growth include the introduction of technologically advanced cloud-computing teledentistry solutions and increasing awareness among dental practitioners and patients to adopt cloud-based software to record health data and store it effortlessly.
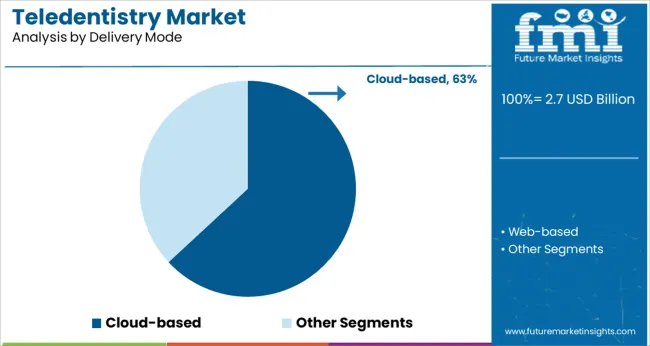
In addition, the easy accessibility with large bandwidth, storage, and recovery capacity with high safety assurance is fueling the growth of the segment. The cloud-based segment is expected to possess 65% market share in 2022.
The web-based segment is anticipated to witness significant growth from 2022 to 2032 owing to the emergence of web-based teledentistry applications and their wide adoption among end-users. The high penetration of smartphones in rural and remote locations is enhancing access to dental healthcare. The cost-effectiveness and seamless user interface offered in this virtual care platform are supporting the rapid growth of the segment.
Ease of reaching patients influencing demand for Teleconsultations
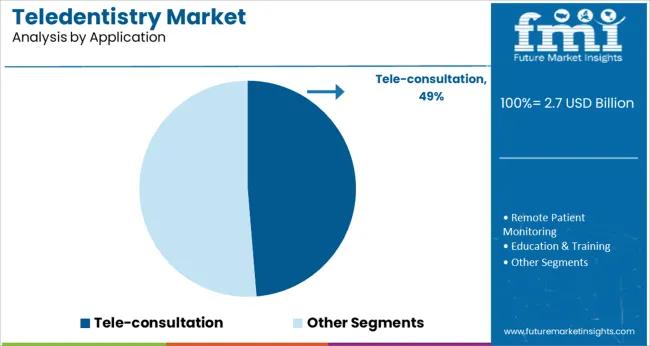
The teleconsultation segment is expected to possess a 55% market share in 2022. This is owing to the sudden emergence of COVID-19 and the immediate measures taken by the government in recommending digital healthcare, especially for dental practices across the world. Many dentists adopted teledentistry to provide consultation regarding dental care treatment online by reaching patients remotely. These factors are aiding the growth of the segment.
The remote patient monitoring segment is anticipated to register the fastest CAGR of 16.6% from 2022 to 2032 owing to the rising dental consciousness among the adult population, coupled with the convenience of undergoing dental treatments from home. The availability of a significant number of self-monitoring dental care software coupled with hardware is helping people in gaining oral care without reaching dentists. Such factors are anticipated to boost segment growth.
The efficiency of data management increasing demand on providers
The growing adoption rate of teledentistry platforms among dental providers reduces the disease burden in dental facilities. In addition, the teledentistry software provides seamless access to patients’ dental records with improved data management and real-time quality reporting, which improves its usage among healthcare providers. Thus, the provider's segment is expected to dominate the market and account for a revenue share of over 45% in 2022
The patient segment is anticipated to register the fastest growth rate over the forecast period owing to the increasing number of smartphone users and growing active subscribers to teledentistry solutions. In addition, the better accessibility with high internet connectivity, feasibility, and affordability of dental consultations through virtual mode is making people adopt such platforms more as compared to walk-in dental consultations.
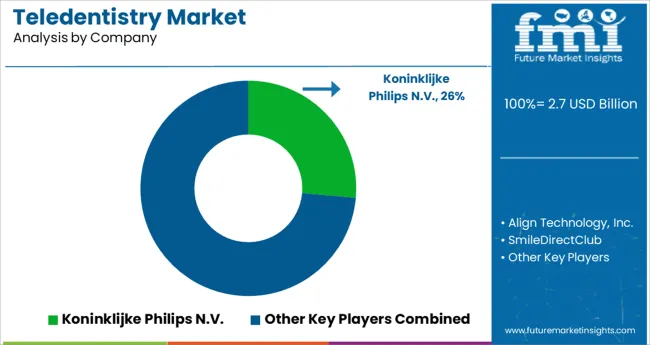
The market is highly competitive. The key players are involved in new solution launches, software and services innovations, acquisitions, and partnerships to gain a competitive edge over each other. Such activities are expected to support the rapid growth of the market.
Report Attribute | Details |
---|---|
Market Value in 2022 | USD 1.45 Billion |
Market Value in 2032 | USD 6.56 Billion |
Growth Rate | CAGR of 16.3% from 2022 to 2032 |
Base Year for Estimation | 2021 |
Historical Data | 2017 to 2021 |
Forecast Period | 2022 to 2032 |
Quantitative Units | Revenue in USD Billion and CAGR from 2022 to 2032 |
Report Coverage | Revenue Forecast, Volume Forecast, Company Ranking, Competitive Landscape, Growth Factors, Trends, and Pricing Analysis |
Segments Covered | Component, Delivery Mode, Application, End Use, Region |
Regions Covered | North America; Latin America; Europe; South Asia; East Asia; Oceania; Middle East and Africa (MEA) |
Key Countries Profiled | USA, Canada, Brazil, Argentina, Germany, UK, France, Spain, Italy, India, Malaysia, Singapore, Thailand, China, Japan, South Korea, Australia, New Zealand, GCC, South Africa, Israel |
Key Companies Profiled | Koninklijke Philips N.V.; Align Technology, Inc.; SmileDirectClub; MouthWatch, LLC; Dentulu, Inc.; Denteractive Solutions Inc.; Toothpick; Smile Virtual LLC; Virtudent, Inc.; Straight Teeth Direct |
Customization | Available Upon Request |
Table 1: Global Market Value (US$ Million) Forecast by Region, 2017 to 2032
Table 2: Global Market Value (US$ Million) Forecast by Component, 2017 to 2032
Table 3: Global Market Value (US$ Million) Forecast by Delivery Mode, 2017 to 2032
Table 4: Global Market Value (US$ Million) Forecast by Application, 2017 to 2032
Table 5: Global Market Value (US$ Million) Forecast by End-use, 2017 to 2032
Table 6: North America Market Value (US$ Million) Forecast by Country, 2017 to 2032
Table 7: North America Market Value (US$ Million) Forecast by Component, 2017 to 2032
Table 8: North America Market Value (US$ Million) Forecast by Delivery Mode, 2017 to 2032
Table 9: North America Market Value (US$ Million) Forecast by Application, 2017 to 2032
Table 10: North America Market Value (US$ Million) Forecast by End-use, 2017 to 2032
Table 11: Latin America Market Value (US$ Million) Forecast by Country, 2017 to 2032
Table 12: Latin America Market Value (US$ Million) Forecast by Component, 2017 to 2032
Table 13: Latin America Market Value (US$ Million) Forecast by Delivery Mode, 2017 to 2032
Table 14: Latin America Market Value (US$ Million) Forecast by Application, 2017 to 2032
Table 15: Latin America Market Value (US$ Million) Forecast by End-use, 2017 to 2032
Table 16: Europe Market Value (US$ Million) Forecast by Country, 2017 to 2032
Table 17: Europe Market Value (US$ Million) Forecast by Component, 2017 to 2032
Table 18: Europe Market Value (US$ Million) Forecast by Delivery Mode, 2017 to 2032
Table 19: Europe Market Value (US$ Million) Forecast by Application, 2017 to 2032
Table 20: Europe Market Value (US$ Million) Forecast by End-use, 2017 to 2032
Table 21: South Asia Market Value (US$ Million) Forecast by Country, 2017 to 2032
Table 22: South Asia Market Value (US$ Million) Forecast by Component, 2017 to 2032
Table 23: South Asia Market Value (US$ Million) Forecast by Delivery Mode, 2017 to 2032
Table 24: South Asia Market Value (US$ Million) Forecast by Application, 2017 to 2032
Table 25: South Asia Market Value (US$ Million) Forecast by End-use, 2017 to 2032
Table 26: East Asia Market Value (US$ Million) Forecast by Country, 2017 to 2032
Table 27: East Asia Market Value (US$ Million) Forecast by Component, 2017 to 2032
Table 28: East Asia Market Value (US$ Million) Forecast by Delivery Mode, 2017 to 2032
Table 29: East Asia Market Value (US$ Million) Forecast by Application, 2017 to 2032
Table 30: East Asia Market Value (US$ Million) Forecast by End-use, 2017 to 2032
Table 31: Oceania Market Value (US$ Million) Forecast by Country, 2017 to 2032
Table 32: Oceania Market Value (US$ Million) Forecast by Component, 2017 to 2032
Table 33: Oceania Market Value (US$ Million) Forecast by Delivery Mode, 2017 to 2032
Table 34: Oceania Market Value (US$ Million) Forecast by Application, 2017 to 2032
Table 35: Oceania Market Value (US$ Million) Forecast by End-use, 2017 to 2032
Table 36: MEA Market Value (US$ Million) Forecast by Country, 2017 to 2032
Table 37: MEA Market Value (US$ Million) Forecast by Component, 2017 to 2032
Table 38: MEA Market Value (US$ Million) Forecast by Delivery Mode, 2017 to 2032
Table 39: MEA Market Value (US$ Million) Forecast by Application, 2017 to 2032
Table 40: MEA Market Value (US$ Million) Forecast by End-use, 2017 to 2032
Figure 1: Global Market Value (US$ Million) by Component, 2022 to 2032
Figure 2: Global Market Value (US$ Million) by Delivery Mode, 2022 to 2032
Figure 3: Global Market Value (US$ Million) by Application, 2022 to 2032
Figure 4: Global Market Value (US$ Million) by End-use, 2022 to 2032
Figure 5: Global Market Value (US$ Million) by Region, 2022 to 2032
Figure 6: Global Market Value (US$ Million) Analysis by Region, 2017 to 2032
Figure 7: Global Market Value Share (%) and BPS Analysis by Region, 2022 to 2032
Figure 8: Global Market Y-o-Y Growth (%) Projections by Region, 2022 to 2032
Figure 9: Global Market Value (US$ Million) Analysis by Component, 2017 to 2032
Figure 10: Global Market Value Share (%) and BPS Analysis by Component, 2022 to 2032
Figure 11: Global Market Y-o-Y Growth (%) Projections by Component, 2022 to 2032
Figure 12: Global Market Value (US$ Million) Analysis by Delivery Mode, 2017 to 2032
Figure 13: Global Market Value Share (%) and BPS Analysis by Delivery Mode, 2022 to 2032
Figure 14: Global Market Y-o-Y Growth (%) Projections by Delivery Mode, 2022 to 2032
Figure 15: Global Market Value (US$ Million) Analysis by Application, 2017 to 2032
Figure 16: Global Market Value Share (%) and BPS Analysis by Application, 2022 to 2032
Figure 17: Global Market Y-o-Y Growth (%) Projections by Application, 2022 to 2032
Figure 18: Global Market Value (US$ Million) Analysis by End-use, 2017 to 2032
Figure 19: Global Market Value Share (%) and BPS Analysis by End-use, 2022 to 2032
Figure 20: Global Market Y-o-Y Growth (%) Projections by End-use, 2022 to 2032
Figure 21: Global Market Attractiveness by Component, 2022 to 2032
Figure 22: Global Market Attractiveness by Delivery Mode, 2022 to 2032
Figure 23: Global Market Attractiveness by Application, 2022 to 2032
Figure 24: Global Market Attractiveness by End-use, 2022 to 2032
Figure 25: Global Market Attractiveness by Region, 2022 to 2032
Figure 26: North America Market Value (US$ Million) by Component, 2022 to 2032
Figure 27: North America Market Value (US$ Million) by Delivery Mode, 2022 to 2032
Figure 28: North America Market Value (US$ Million) by Application, 2022 to 2032
Figure 29: North America Market Value (US$ Million) by End-use, 2022 to 2032
Figure 30: North America Market Value (US$ Million) by Country, 2022 to 2032
Figure 31: North America Market Value (US$ Million) Analysis by Country, 2017 to 2032
Figure 32: North America Market Value Share (%) and BPS Analysis by Country, 2022 to 2032
Figure 33: North America Market Y-o-Y Growth (%) Projections by Country, 2022 to 2032
Figure 34: North America Market Value (US$ Million) Analysis by Component, 2017 to 2032
Figure 35: North America Market Value Share (%) and BPS Analysis by Component, 2022 to 2032
Figure 36: North America Market Y-o-Y Growth (%) Projections by Component, 2022 to 2032
Figure 37: North America Market Value (US$ Million) Analysis by Delivery Mode, 2017 to 2032
Figure 38: North America Market Value Share (%) and BPS Analysis by Delivery Mode, 2022 to 2032
Figure 39: North America Market Y-o-Y Growth (%) Projections by Delivery Mode, 2022 to 2032
Figure 40: North America Market Value (US$ Million) Analysis by Application, 2017 to 2032
Figure 41: North America Market Value Share (%) and BPS Analysis by Application, 2022 to 2032
Figure 42: North America Market Y-o-Y Growth (%) Projections by Application, 2022 to 2032
Figure 43: North America Market Value (US$ Million) Analysis by End-use, 2017 to 2032
Figure 44: North America Market Value Share (%) and BPS Analysis by End-use, 2022 to 2032
Figure 45: North America Market Y-o-Y Growth (%) Projections by End-use, 2022 to 2032
Figure 46: North America Market Attractiveness by Component, 2022 to 2032
Figure 47: North America Market Attractiveness by Delivery Mode, 2022 to 2032
Figure 48: North America Market Attractiveness by Application, 2022 to 2032
Figure 49: North America Market Attractiveness by End-use, 2022 to 2032
Figure 50: North America Market Attractiveness by Country, 2022 to 2032
Figure 51: Latin America Market Value (US$ Million) by Component, 2022 to 2032
Figure 52: Latin America Market Value (US$ Million) by Delivery Mode, 2022 to 2032
Figure 53: Latin America Market Value (US$ Million) by Application, 2022 to 2032
Figure 54: Latin America Market Value (US$ Million) by End-use, 2022 to 2032
Figure 55: Latin America Market Value (US$ Million) by Country, 2022 to 2032
Figure 56: Latin America Market Value (US$ Million) Analysis by Country, 2017 to 2032
Figure 57: Latin America Market Value Share (%) and BPS Analysis by Country, 2022 to 2032
Figure 58: Latin America Market Y-o-Y Growth (%) Projections by Country, 2022 to 2032
Figure 59: Latin America Market Value (US$ Million) Analysis by Component, 2017 to 2032
Figure 60: Latin America Market Value Share (%) and BPS Analysis by Component, 2022 to 2032
Figure 61: Latin America Market Y-o-Y Growth (%) Projections by Component, 2022 to 2032
Figure 62: Latin America Market Value (US$ Million) Analysis by Delivery Mode, 2017 to 2032
Figure 63: Latin America Market Value Share (%) and BPS Analysis by Delivery Mode, 2022 to 2032
Figure 64: Latin America Market Y-o-Y Growth (%) Projections by Delivery Mode, 2022 to 2032
Figure 65: Latin America Market Value (US$ Million) Analysis by Application, 2017 to 2032
Figure 66: Latin America Market Value Share (%) and BPS Analysis by Application, 2022 to 2032
Figure 67: Latin America Market Y-o-Y Growth (%) Projections by Application, 2022 to 2032
Figure 68: Latin America Market Value (US$ Million) Analysis by End-use, 2017 to 2032
Figure 69: Latin America Market Value Share (%) and BPS Analysis by End-use, 2022 to 2032
Figure 70: Latin America Market Y-o-Y Growth (%) Projections by End-use, 2022 to 2032
Figure 71: Latin America Market Attractiveness by Component, 2022 to 2032
Figure 72: Latin America Market Attractiveness by Delivery Mode, 2022 to 2032
Figure 73: Latin America Market Attractiveness by Application, 2022 to 2032
Figure 74: Latin America Market Attractiveness by End-use, 2022 to 2032
Figure 75: Latin America Market Attractiveness by Country, 2022 to 2032
Figure 76: Europe Market Value (US$ Million) by Component, 2022 to 2032
Figure 77: Europe Market Value (US$ Million) by Delivery Mode, 2022 to 2032
Figure 78: Europe Market Value (US$ Million) by Application, 2022 to 2032
Figure 79: Europe Market Value (US$ Million) by End-use, 2022 to 2032
Figure 80: Europe Market Value (US$ Million) by Country, 2022 to 2032
Figure 81: Europe Market Value (US$ Million) Analysis by Country, 2017 to 2032
Figure 82: Europe Market Value Share (%) and BPS Analysis by Country, 2022 to 2032
Figure 83: Europe Market Y-o-Y Growth (%) Projections by Country, 2022 to 2032
Figure 84: Europe Market Value (US$ Million) Analysis by Component, 2017 to 2032
Figure 85: Europe Market Value Share (%) and BPS Analysis by Component, 2022 to 2032
Figure 86: Europe Market Y-o-Y Growth (%) Projections by Component, 2022 to 2032
Figure 87: Europe Market Value (US$ Million) Analysis by Delivery Mode, 2017 to 2032
Figure 88: Europe Market Value Share (%) and BPS Analysis by Delivery Mode, 2022 to 2032
Figure 89: Europe Market Y-o-Y Growth (%) Projections by Delivery Mode, 2022 to 2032
Figure 90: Europe Market Value (US$ Million) Analysis by Application, 2017 to 2032
Figure 91: Europe Market Value Share (%) and BPS Analysis by Application, 2022 to 2032
Figure 92: Europe Market Y-o-Y Growth (%) Projections by Application, 2022 to 2032
Figure 93: Europe Market Value (US$ Million) Analysis by End-use, 2017 to 2032
Figure 94: Europe Market Value Share (%) and BPS Analysis by End-use, 2022 to 2032
Figure 95: Europe Market Y-o-Y Growth (%) Projections by End-use, 2022 to 2032
Figure 96: Europe Market Attractiveness by Component, 2022 to 2032
Figure 97: Europe Market Attractiveness by Delivery Mode, 2022 to 2032
Figure 98: Europe Market Attractiveness by Application, 2022 to 2032
Figure 99: Europe Market Attractiveness by End-use, 2022 to 2032
Figure 100: Europe Market Attractiveness by Country, 2022 to 2032
Figure 101: South Asia Market Value (US$ Million) by Component, 2022 to 2032
Figure 102: South Asia Market Value (US$ Million) by Delivery Mode, 2022 to 2032
Figure 103: South Asia Market Value (US$ Million) by Application, 2022 to 2032
Figure 104: South Asia Market Value (US$ Million) by End-use, 2022 to 2032
Figure 105: South Asia Market Value (US$ Million) by Country, 2022 to 2032
Figure 106: South Asia Market Value (US$ Million) Analysis by Country, 2017 to 2032
Figure 107: South Asia Market Value Share (%) and BPS Analysis by Country, 2022 to 2032
Figure 108: South Asia Market Y-o-Y Growth (%) Projections by Country, 2022 to 2032
Figure 109: South Asia Market Value (US$ Million) Analysis by Component, 2017 to 2032
Figure 110: South Asia Market Value Share (%) and BPS Analysis by Component, 2022 to 2032
Figure 111: South Asia Market Y-o-Y Growth (%) Projections by Component, 2022 to 2032
Figure 112: South Asia Market Value (US$ Million) Analysis by Delivery Mode, 2017 to 2032
Figure 113: South Asia Market Value Share (%) and BPS Analysis by Delivery Mode, 2022 to 2032
Figure 114: South Asia Market Y-o-Y Growth (%) Projections by Delivery Mode, 2022 to 2032
Figure 115: South Asia Market Value (US$ Million) Analysis by Application, 2017 to 2032
Figure 116: South Asia Market Value Share (%) and BPS Analysis by Application, 2022 to 2032
Figure 117: South Asia Market Y-o-Y Growth (%) Projections by Application, 2022 to 2032
Figure 118: South Asia Market Value (US$ Million) Analysis by End-use, 2017 to 2032
Figure 119: South Asia Market Value Share (%) and BPS Analysis by End-use, 2022 to 2032
Figure 120: South Asia Market Y-o-Y Growth (%) Projections by End-use, 2022 to 2032
Figure 121: South Asia Market Attractiveness by Component, 2022 to 2032
Figure 122: South Asia Market Attractiveness by Delivery Mode, 2022 to 2032
Figure 123: South Asia Market Attractiveness by Application, 2022 to 2032
Figure 124: South Asia Market Attractiveness by End-use, 2022 to 2032
Figure 125: South Asia Market Attractiveness by Country, 2022 to 2032
Figure 126: East Asia Market Value (US$ Million) by Component, 2022 to 2032
Figure 127: East Asia Market Value (US$ Million) by Delivery Mode, 2022 to 2032
Figure 128: East Asia Market Value (US$ Million) by Application, 2022 to 2032
Figure 129: East Asia Market Value (US$ Million) by End-use, 2022 to 2032
Figure 130: East Asia Market Value (US$ Million) by Country, 2022 to 2032
Figure 131: East Asia Market Value (US$ Million) Analysis by Country, 2017 to 2032
Figure 132: East Asia Market Value Share (%) and BPS Analysis by Country, 2022 to 2032
Figure 133: East Asia Market Y-o-Y Growth (%) Projections by Country, 2022 to 2032
Figure 134: East Asia Market Value (US$ Million) Analysis by Component, 2017 to 2032
Figure 135: East Asia Market Value Share (%) and BPS Analysis by Component, 2022 to 2032
Figure 136: East Asia Market Y-o-Y Growth (%) Projections by Component, 2022 to 2032
Figure 137: East Asia Market Value (US$ Million) Analysis by Delivery Mode, 2017 to 2032
Figure 138: East Asia Market Value Share (%) and BPS Analysis by Delivery Mode, 2022 to 2032
Figure 139: East Asia Market Y-o-Y Growth (%) Projections by Delivery Mode, 2022 to 2032
Figure 140: East Asia Market Value (US$ Million) Analysis by Application, 2017 to 2032
Figure 141: East Asia Market Value Share (%) and BPS Analysis by Application, 2022 to 2032
Figure 142: East Asia Market Y-o-Y Growth (%) Projections by Application, 2022 to 2032
Figure 143: East Asia Market Value (US$ Million) Analysis by End-use, 2017 to 2032
Figure 144: East Asia Market Value Share (%) and BPS Analysis by End-use, 2022 to 2032
Figure 145: East Asia Market Y-o-Y Growth (%) Projections by End-use, 2022 to 2032
Figure 146: East Asia Market Attractiveness by Component, 2022 to 2032
Figure 147: East Asia Market Attractiveness by Delivery Mode, 2022 to 2032
Figure 148: East Asia Market Attractiveness by Application, 2022 to 2032
Figure 149: East Asia Market Attractiveness by End-use, 2022 to 2032
Figure 150: East Asia Market Attractiveness by Country, 2022 to 2032
Figure 151: Oceania Market Value (US$ Million) by Component, 2022 to 2032
Figure 152: Oceania Market Value (US$ Million) by Delivery Mode, 2022 to 2032
Figure 153: Oceania Market Value (US$ Million) by Application, 2022 to 2032
Figure 154: Oceania Market Value (US$ Million) by End-use, 2022 to 2032
Figure 155: Oceania Market Value (US$ Million) by Country, 2022 to 2032
Figure 156: Oceania Market Value (US$ Million) Analysis by Country, 2017 to 2032
Figure 157: Oceania Market Value Share (%) and BPS Analysis by Country, 2022 to 2032
Figure 158: Oceania Market Y-o-Y Growth (%) Projections by Country, 2022 to 2032
Figure 159: Oceania Market Value (US$ Million) Analysis by Component, 2017 to 2032
Figure 160: Oceania Market Value Share (%) and BPS Analysis by Component, 2022 to 2032
Figure 161: Oceania Market Y-o-Y Growth (%) Projections by Component, 2022 to 2032
Figure 162: Oceania Market Value (US$ Million) Analysis by Delivery Mode, 2017 to 2032
Figure 163: Oceania Market Value Share (%) and BPS Analysis by Delivery Mode, 2022 to 2032
Figure 164: Oceania Market Y-o-Y Growth (%) Projections by Delivery Mode, 2022 to 2032
Figure 165: Oceania Market Value (US$ Million) Analysis by Application, 2017 to 2032
Figure 166: Oceania Market Value Share (%) and BPS Analysis by Application, 2022 to 2032
Figure 167: Oceania Market Y-o-Y Growth (%) Projections by Application, 2022 to 2032
Figure 168: Oceania Market Value (US$ Million) Analysis by End-use, 2017 to 2032
Figure 169: Oceania Market Value Share (%) and BPS Analysis by End-use, 2022 to 2032
Figure 170: Oceania Market Y-o-Y Growth (%) Projections by End-use, 2022 to 2032
Figure 171: Oceania Market Attractiveness by Component, 2022 to 2032
Figure 172: Oceania Market Attractiveness by Delivery Mode, 2022 to 2032
Figure 173: Oceania Market Attractiveness by Application, 2022 to 2032
Figure 174: Oceania Market Attractiveness by End-use, 2022 to 2032
Figure 175: Oceania Market Attractiveness by Country, 2022 to 2032
Figure 176: MEA Market Value (US$ Million) by Component, 2022 to 2032
Figure 177: MEA Market Value (US$ Million) by Delivery Mode, 2022 to 2032
Figure 178: MEA Market Value (US$ Million) by Application, 2022 to 2032
Figure 179: MEA Market Value (US$ Million) by End-use, 2022 to 2032
Figure 180: MEA Market Value (US$ Million) by Country, 2022 to 2032
Figure 181: MEA Market Value (US$ Million) Analysis by Country, 2017 to 2032
Figure 182: MEA Market Value Share (%) and BPS Analysis by Country, 2022 to 2032
Figure 183: MEA Market Y-o-Y Growth (%) Projections by Country, 2022 to 2032
Figure 184: MEA Market Value (US$ Million) Analysis by Component, 2017 to 2032
Figure 185: MEA Market Value Share (%) and BPS Analysis by Component, 2022 to 2032
Figure 186: MEA Market Y-o-Y Growth (%) Projections by Component, 2022 to 2032
Figure 187: MEA Market Value (US$ Million) Analysis by Delivery Mode, 2017 to 2032
Figure 188: MEA Market Value Share (%) and BPS Analysis by Delivery Mode, 2022 to 2032
Figure 189: MEA Market Y-o-Y Growth (%) Projections by Delivery Mode, 2022 to 2032
Figure 190: MEA Market Value (US$ Million) Analysis by Application, 2017 to 2032
Figure 191: MEA Market Value Share (%) and BPS Analysis by Application, 2022 to 2032
Figure 192: MEA Market Y-o-Y Growth (%) Projections by Application, 2022 to 2032
Figure 193: MEA Market Value (US$ Million) Analysis by End-use, 2017 to 2032
Figure 194: MEA Market Value Share (%) and BPS Analysis by End-use, 2022 to 2032
Figure 195: MEA Market Y-o-Y Growth (%) Projections by End-use, 2022 to 2032
Figure 196: MEA Market Attractiveness by Component, 2022 to 2032
Figure 197: MEA Market Attractiveness by Delivery Mode, 2022 to 2032
Figure 198: MEA Market Attractiveness by Application, 2022 to 2032
Figure 199: MEA Market Attractiveness by End-use, 2022 to 2032
Figure 200: MEA Market Attractiveness by Country, 2022 to 2032
From 2017 to 2021, the teledentistry market grew at a CAGR of 9%
The global teledentistry market is expected to grow with a 16.30% CAGR from 2022 to 2032
As of 2032, the teledentistry market is expected to reach USD 6.56 Billion
The software and services segment is expected to dominate the teledentistry market by accumulating a market for 73% market share for teledentistry market.
The cloud-based segment is expected to possess a 65% market share in 2022.
The teleconsultation segment is expected to possess a 55% market share in 2022
The US teledentistry market was projected to gain a global market share of 40% in 2022
India is expected to possess a 35% market share for the teledentistry market in 2022
Thank you!
You will receive an email from our Business Development Manager. Please be sure to check your SPAM/JUNK folder too.