Telehandler Market Size and Share Forecast Outlook 2025 to 2035

The Telehandler Market is estimated to be valued at USD 6.7 billion in 2025 and is projected to reach USD 11.6 billion by 2035, registering a compound annual growth rate (CAGR) of 5.6% over the forecast period.

The Telehandler market is experiencing strong growth, driven by increasing demand for versatile lifting and material handling equipment across construction, agriculture, and industrial sectors. The adoption of telehandlers is being supported by their multi-functional capabilities, which combine the benefits of forklifts, cranes, and loaders into a single machine, enhancing operational efficiency and reducing equipment costs. Technological advancements, including improved hydraulic systems, extended lift capacities, and enhanced safety features, have expanded their applicability across challenging environments.

Growing infrastructure investments, large-scale construction projects, and the mechanization of agricultural operations are contributing to market expansion. The rental services segment is further enabling cost-effective access to equipment, especially for small and medium enterprises, which reduces upfront capital expenditure and promotes flexible utilization.

As organizations prioritize productivity, efficiency, and safety, telehandlers are being increasingly adopted as essential material handling solutions Continuous innovation in telehandler design, performance optimization, and operator comfort is expected to sustain market growth over the coming decade.
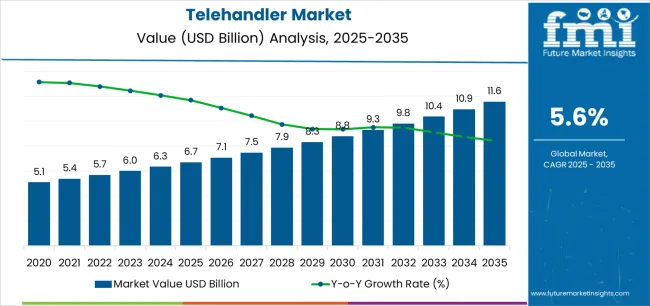
Quick Stats for Telehandler Market

  • Telehandler Market Industry Value (2025): USD 6.7 billion
  • Telehandler Market Forecast Value (2035): USD 11.6 billion
  • Telehandler Market Forecast CAGR: 5.6%
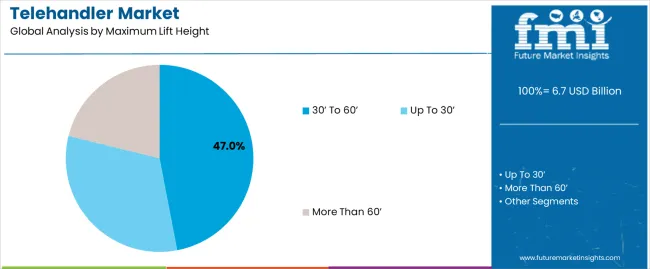
  • Leading Segment in Telehandler Market in 2025: 30’ To 60’ (47.0%)
  • Key Growth Region in Telehandler Market: North America, Asia-Pacific, Europe
  • Top Key Players in Telehandler Market: JCB (J.C. Bamford Excavators Ltd.), Caterpillar Inc., Manitou Group, Liebherr Group, Bobcat Company (Doosan Group), Komatsu Ltd., Terex Corporation, Merlo S.p.A., Genie (Terex Corporation), Haulotte Group

Telehandler Market Market Value Analysis

Metric Value
Telehandler Market Estimated Value in (2025 E) USD 6.7 billion
Telehandler Market Forecast Value in (2035 F) USD 11.6 billion
Forecast CAGR (2025 to 2035) 5.6%

Segmental Analysis

The market is segmented by Maximum Lift Height and Ownership and region. By Maximum Lift Height, the market is divided into 30’ To 60’, Up To 30’, and More Than 60’. In terms of Ownership, the market is classified into Rental Services and End-Use Industry. Regionally, the market is classified into North America, Latin America, Western Europe, Eastern Europe, Balkan & Baltic Countries, Russia & Belarus, Central Asia, East Asia, South Asia & Pacific, and the Middle East & Africa.
Insights into the 30’ To 60’ Maximum Lift Height Segment

Telehandler Market Analysis By Maximum Lift Height

The 30’ to 60’ maximum lift height segment is projected to hold 47.0% of the market revenue in 2025, establishing it as the leading category. Growth is being driven by the demand for telehandlers capable of handling medium to high-elevation material lifting in construction sites, warehouses, and agricultural applications. This lift height range provides an optimal balance between reach capability and operational stability, enabling versatile use across multiple environments.

Machines in this category are being increasingly equipped with advanced hydraulic systems, robust chassis designs, and improved operator controls, enhancing both safety and efficiency. The ability to perform lifting, loading, and placement tasks at varying heights without additional equipment reduces operational complexity and costs.

Contractors and facility managers are prioritizing these machines due to their adaptability, reliability, and performance in diverse applications As infrastructure projects expand and multi-level material handling requirements increase, the 30’ to 60’ segment is expected to maintain its leading position, supported by continuous enhancements in safety, durability, and ease of operation.
Insights into the Rental Services Ownership Segment

Telehandler Market Analysis By Ownership

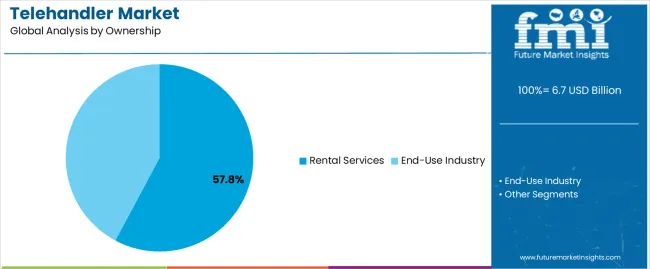
The rental services ownership segment is anticipated to account for 57.8% of the market revenue in 2025, making it the dominant category. Growth in this segment is driven by the increasing preference for cost-effective equipment access, particularly among small and medium enterprises that aim to reduce upfront capital expenditure. Rental services allow businesses to obtain high-performance telehandlers with flexible usage terms, enabling scaling of operations according to project demands.

This model provides access to machines with advanced features, regular maintenance, and safety compliance, without long-term ownership liabilities. Companies are leveraging rental services to manage operational cash flow efficiently while ensuring availability of equipment for critical projects.

The flexibility, lower financial risk, and immediate deployment offered by rental solutions are further boosting adoption across construction, agriculture, and industrial sectors As demand for telehandlers continues to grow, particularly for projects requiring varying lift heights and capacities, rental services are expected to remain the preferred ownership model, reinforcing market expansion and broadening end-user accessibility.

Key Market Highlights

Proliferation of Electric Telehandlers Paves the Way for Innovation and Sustainability

Several businesses have showcased their adaptability by launching electric telehandlers. Environmental concerns and stricter mandates to minimize emissions are assisting in the shift toward these. These provide benefits, such as less noise pollution and cheaper long-term running costs compared to diesel parallels.

Technological developments in batteries are making these more practical for various uses. These are becoming popular due to their advantages for the environment. They help capacity to increase productivity and fulfill sustainability objectives. For instance, JCB introduced the new 525-60E electric compact telehandler in September 2025 as part of its fully electric e-tech range.

In the similar category of compact telehandlers, Wacker Neuson launched a new compact electric telehandler in November 2025. This new TH412e telehandler is compact and can be used in confined spaces.

Hydrogen and Hydrogen-fuel Cell-based Telehandlers Hit the Market

Hydrogen fuel cell telehandlers are a green alternative to conventional diesel-powered versions. By producing energy onboard via the electrochemical reactions of hydrogen and oxygen, hydrogen fuel cells emit no toxic pollutants and solely create water vapor as a byproduct.

Because of this, these are perfect for application in locations with strict air quality standards, indoor facilities, urban construction sites, and/or protected areas. Furthermore, extensive working ranges and quick refilling times are two benefits of hydrogen fuel cell technology that give operators an effective and sustainable alternative for material handling applications.

In December 2025, Manitou introduced its first-of-its-kind product. The company aims to introduce a 100% hydrogen telehandler by 2029. The hydrogen program is part of the French manufacturer's effort to reduce greenhouse gas emissions from its equipment by 34% per hour by 2035.

Telehandler Market Trends Analysis

  • Modular telehandler designs are becoming more popular among manufacturers because they facilitate component exchange and customization.
  • Telehandler fleets are being equipped with swarm intelligence algorithms to maximize efficiency and coordination in material handling operations.
  • Technological developments in automation are making it possible to design telehandlers with autonomous features and the ability to operate remotely.
  • Due to the increased need for flexible equipment solutions, particularly among small and medium-sized businesses (SMEs) and construction contractors, the market for telehandler rentals is expanding significantly.

Telehandler Market Opportunity Analysis

  • Developing countries in the Asia Pacific, the Middle East & Africa, and Latin America can be explored by manufacturers. Revenues can multiply tenfold by leveraging these regions' fast urbanization, industrialization, and infrastructural growth.
  • Manufacturers can design and launch telehandlers that are tailored to the specific problems and requirements of renewable energy projects.
  • Manufacturers can gain recognition in the agricultural industry by providing telehandlers with unique attachments and farm-specific features.
  • The expansion of e-commerce and the requirement for efficient warehouse operations present a potential for logistics operations.
  • Manufacturers and service providers can use the aftermarket segment to supply consumers with spare parts, maintenance services, training, and technical support. This can help in creating additional revenue streams.

Category-wise Insights

30’ to 60’ Segment Gains Top Shares in the Maximum Lift Height Category

Top Maximum Lift Height 30’ to 60’
Value Share (2025) 47%

In the maximum lift height category, the 30’ to 60’ segment gained 47% of market shares in 2025. Telehandlers with more lift heights are becoming more necessary as vertical construction projects, such as skyscrapers and high-rise buildings, increase globally. These can efficiently facilitate building operations at different heights and reach elevated work areas, and higher levels are essential for construction organizations.

Vertical development tends to be more necessary than horizontal expansion due to urbanization trends and the limited amount of accessible land in metropolitan areas. High lift height telehandlers are crucial for maneuvering through congested areas and reaching lofty building sites where conventional cranes can be too big or too limited.

3 to 6 Ton Lifting Capacity Segment Dominates the Market

Top Lifting Capacity 3 to 6
Value Share (2025) 46.20%

In the lifting capacity category, the 3 to 6 ton segment holds 46.20% of the market share in 2025. The increased demand for telehandlers with lifting capabilities ranging from 3 to 6 tons highlights the expansion potential in the construction, infrastructure development, and industrial sectors.

As construction operations develop internationally and infrastructure projects increase, there is a greater demand for telehandlers to fulfill material handling and lifting requirements across various applications and sectors.

The trend of renting equipment stimulates demand with lifting capacities of three to six tons. These can be rented from organizations that specialize in providing equipment. They fulfill the demands of industrial operators, building contractors, and other end users looking for versatile and reasonably priced equipment.

Country-wise Insights

Countries Value CAGR (2025 to 2035)
United States 5.10%
Germany 4.50%
Japan 5.60%
China 4.80%
India 5.60%

Increasing Fund Allocation for Infrastructure Development Boosts Demand in the United States

The demand for telehandlers in the United States will amplify at a 5.10% CAGR through 2035. The American government has launched 40,000 projects by introducing a USD 1 trillion infrastructure bill in November 2025.

These are necessary equipment for material handling and construction work. Their demand has increased due to the recent spike in infrastructure investment. The demand is predicted to skyrocket as construction companies increase operations to capitalize on these lucrative contracts. This offers potential for development to equipment rental businesses and manufacturers.

The United States telehandler industry is witnessing a commotion as modern technologies like automation, IoT, and telematics gain applications. Construction enterprises and equipment rental businesses are investing in smart telehandlers with the latest features. This helps to increase operational efficiency, raise safety standards, and improve fleet management procedures.

Agricultural Innovations and Adoption of Precision Framing Practices Boosting Sales in Germany

The sales of telehandlers in Germany will amplify at a 4.50% CAGR through 2035. Telehandler manufacturers can boost revenues by tapping into the agricultural sector because of Germany's booming agriculture industry, which is adopting precision farming techniques and technological innovation.

For jobs like harvesting crops, feeding cattle, and managing agricultural inputs, telehandlers with precision attachments like silage grabs, bale handlers, and GPS-guided forks are in high demand. Telehandlers are also required for biomass handling and renewable energy infrastructure projects in Germany. The country's agricultural industry's embrace of renewable energy solutions, including biogas generation and biomass heating, boosts telehandler sales.

Labor Shortages and Aging Population Drive the Market in Japan

The market growth in Japan is estimated at a 5.60% CAGR through 2035. Japan's construction, agriculture, and manufacturing industries are experiencing a labor crisis. This can be ascribed to the country's aging population and diminishing workforce.

By automating and simplifying material handling activities, telehandlers reduce the need for physical labor, which helps manage labor shortages. Telehandlers are in demand as labor-saving equipment as Japanese firms look to increase production and operational efficiency in the face of manpower restrictions. This presents growth prospects for both manufacturers and service providers.

Government’s Infrastructure Investments Escalate Demand in China

Telehandler demand in China will surge at a 4.80% CAGR through 2035. The Chinese government is investing in infrastructure development initiatives. These include transportation networks, energy projects, public utilities, highways, railways, and others. These projects are boosting demand for telehandlers in large-scale construction projects.

Telehandlers are crucial equipment for supporting infrastructure development projects. As China continues to invest in infrastructure to boost economic growth and improve connectivity, demand for telehandlers as key construction equipment is projected to stay high. This creates growth prospects for infrastructure manufacturers and suppliers.

Government Initiatives and Incentives Fuel Sales in India

Telehandler sales in India will augment at a 5.60% CAGR through 2035. Housing, rural infrastructure development, and independent manufacturing are chief targets for government investments. Programs like the Pradhan Mantri Awas Yojana, Pradhan Mantri Gram Sadak Yojana, and Atmanirbhar Bharat Abhiyan boost sales of telehandlers.

Under these government programs, these are necessary tools for building roads, developing infrastructure, and executing construction projects. This makes the market more advantageous for telehandler providers and manufacturers. The demand in India is stimulated further by incentives, including tax breaks, infrastructure status for certain projects, and GST rebates that promote investments in equipment acquisition.
Competitive Landscape

Telehandler Market Analysis By Company

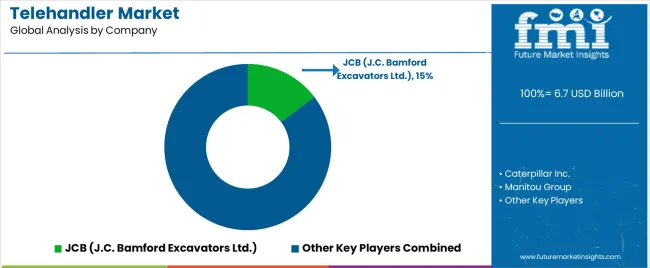
The market is extremely competitive, with corporations like JCB and Caterpillar dominant. These corporations use their brand recognition and worldwide reach to maintain market share. However, regional companies and newcomers are making progress by providing specialized solutions and using technical innovation. Partnerships and technology breakthroughs are significant factors in this landscape, influencing industry players' competitive dynamics and strategic agendas.

Recent Developments

  • In February 2025, Doosan Bobcat launched its first hydrogen fuel cell-powered electric forklift. The company aims to make 30 of these new forklifts to be operational by the end of 2025. The Doosan Hydrogen B35X-7P is essentially a 3-ton Bobcat electric forklift outfitted with a 20 kW fuel cell rather than a battery, and it is slated for delivery to the Korea Zinc Onsan refinery in Ulsan, Korea.
  • In November 2025, Merlo UK launched its electric telehandler at the Agritechnica 2025, in Hannover, Germany.

Key Players in the Market

  • JCB (J.C. Bamford Excavators Ltd.)
  • Caterpillar Inc.
  • Manitou Group
  • Terex Corporation
  • Merlo S.p.A.
  • Genie (Terex Corporation)
  • Haulotte Group
  • Bobcat Company (Doosan Group)
  • Liebherr Group
  • Komatsu Ltd.

Key Coverage in the Telehandler Market Report

  • Deeper Analysis of Telehandler Market Trends
  • The Slow & Steady Rise of India’s Telehandler Market
  • Demand Analysis of Heavy-Duty Telehandler Market
  • Revenue Analysis of Compact Telehandler Market

Key Market Segmentation

By Maximum Lift Height:

  • Up to 30’
  • 30’ to 60’
  • More than 60’

By Ownership:

  • Rental Services
  • End-use Industries
    • Construction
    • Agricultural Aftermarket

By Region:

  • North America
  • Latin America
  • Western Europe
  • Eastern Europe
  • Asia Pacific (APAC)
  • Middle East & Africa (MEA)
  • Japan

Frequently Asked Questions

How big is the telehandler market in 2025?

The global telehandler market is estimated to be valued at USD 6.7 billion in 2025.

What will be the size of telehandler market in 2035?

The market size for the telehandler market is projected to reach USD 11.6 billion by 2035.

How much will be the telehandler market growth between 2025 and 2035?

The telehandler market is expected to grow at a 5.6% CAGR between 2025 and 2035.

What are the key product types in the telehandler market?

The key product types in telehandler market are 30’ to 60’, up to 30’ and more than 60’.

Which ownership segment to contribute significant share in the telehandler market in 2025?

In terms of ownership, rental services segment to command 57.8% share in the telehandler market in 2025.

Table of Content

  1. Executive Summary
    • Global Market Outlook
    • Demand-side Trends
    • Supply-side Trends
    • Technology Roadmap Analysis
    • Analysis and Recommendations
  2. Market Overview
    • Market Coverage / Taxonomy
    • Market Definition / Scope / Limitations
  3. Market Background
    • Market Dynamics
      • Drivers
      • Restraints
      • Opportunity
      • Trends
    • Scenario Forecast
      • Demand in Optimistic Scenario
      • Demand in Likely Scenario
      • Demand in Conservative Scenario
    • Opportunity Map Analysis
    • Product Life Cycle Analysis
    • Supply Chain Analysis
    • Investment Feasibility Matrix
    • Value Chain Analysis
    • PESTLE and Porter’s Analysis
    • Regulatory Landscape
    • Regional Parent Market Outlook
    • Production and Consumption Statistics
    • Import and Export Statistics
  4. Global Market Analysis 2020 to 2024 and Forecast, 2025 to 2035
    • Historical Market Size Value (USD Million) Analysis, 2020 to 2024
    • Current and Future Market Size Value (USD Million) Projections, 2025 to 2035
      • Y-o-Y Growth Trend Analysis
      • Absolute $ Opportunity Analysis
  5. Global Market Pricing Analysis 2020 to 2024 and Forecast 2025 to 2035
  6. Global Market Analysis 2020 to 2024 and Forecast 2025 to 2035, By Maximum Lift Height
    • Introduction / Key Findings
    • Historical Market Size Value (USD Million) Analysis By Maximum Lift Height , 2020 to 2024
    • Current and Future Market Size Value (USD Million) Analysis and Forecast By Maximum Lift Height , 2025 to 2035
      • 30’ To 60’
      • Up To 30’
      • More Than 60’
    • Y-o-Y Growth Trend Analysis By Maximum Lift Height , 2020 to 2024
    • Absolute $ Opportunity Analysis By Maximum Lift Height , 2025 to 2035
  7. Global Market Analysis 2020 to 2024 and Forecast 2025 to 2035, By Ownership
    • Introduction / Key Findings
    • Historical Market Size Value (USD Million) Analysis By Ownership, 2020 to 2024
    • Current and Future Market Size Value (USD Million) Analysis and Forecast By Ownership, 2025 to 2035
      • Rental Services
      • End-Use Industry
        • Construction
        • Agricultural Aftermarket
    • Y-o-Y Growth Trend Analysis By Ownership, 2020 to 2024
    • Absolute $ Opportunity Analysis By Ownership, 2025 to 2035
  8. Global Market Analysis 2020 to 2024 and Forecast 2025 to 2035, By Region
    • Introduction
    • Historical Market Size Value (USD Million) Analysis By Region, 2020 to 2024
    • Current Market Size Value (USD Million) Analysis and Forecast By Region, 2025 to 2035
      • North America
      • Latin America
      • Western Europe
      • Eastern Europe
      • East Asia
      • South Asia and Pacific
      • Middle East & Africa
    • Market Attractiveness Analysis By Region
  9. North America Market Analysis 2020 to 2024 and Forecast 2025 to 2035, By Country
    • Historical Market Size Value (USD Million) Trend Analysis By Market Taxonomy, 2020 to 2024
    • Market Size Value (USD Million) Forecast By Market Taxonomy, 2025 to 2035
      • By Country
        • USA
        • Canada
        • Mexico
      • By Maximum Lift Height
      • By Ownership
    • Market Attractiveness Analysis
      • By Country
      • By Maximum Lift Height
      • By Ownership
    • Key Takeaways
  10. Latin America Market Analysis 2020 to 2024 and Forecast 2025 to 2035, By Country
    • Historical Market Size Value (USD Million) Trend Analysis By Market Taxonomy, 2020 to 2024
    • Market Size Value (USD Million) Forecast By Market Taxonomy, 2025 to 2035
      • By Country
        • Brazil
        • Chile
        • Rest of Latin America
      • By Maximum Lift Height
      • By Ownership
    • Market Attractiveness Analysis
      • By Country
      • By Maximum Lift Height
      • By Ownership
    • Key Takeaways
  11. Western Europe Market Analysis 2020 to 2024 and Forecast 2025 to 2035, By Country
    • Historical Market Size Value (USD Million) Trend Analysis By Market Taxonomy, 2020 to 2024
    • Market Size Value (USD Million) Forecast By Market Taxonomy, 2025 to 2035
      • By Country
        • Germany
        • UK
        • Italy
        • Spain
        • France
        • Nordic
        • BENELUX
        • Rest of Western Europe
      • By Maximum Lift Height
      • By Ownership
    • Market Attractiveness Analysis
      • By Country
      • By Maximum Lift Height
      • By Ownership
    • Key Takeaways
  12. Eastern Europe Market Analysis 2020 to 2024 and Forecast 2025 to 2035, By Country
    • Historical Market Size Value (USD Million) Trend Analysis By Market Taxonomy, 2020 to 2024
    • Market Size Value (USD Million) Forecast By Market Taxonomy, 2025 to 2035
      • By Country
        • Russia
        • Poland
        • Hungary
        • Balkan & Baltic
        • Rest of Eastern Europe
      • By Maximum Lift Height
      • By Ownership
    • Market Attractiveness Analysis
      • By Country
      • By Maximum Lift Height
      • By Ownership
    • Key Takeaways
  13. East Asia Market Analysis 2020 to 2024 and Forecast 2025 to 2035, By Country
    • Historical Market Size Value (USD Million) Trend Analysis By Market Taxonomy, 2020 to 2024
    • Market Size Value (USD Million) Forecast By Market Taxonomy, 2025 to 2035
      • By Country
        • China
        • Japan
        • South Korea
      • By Maximum Lift Height
      • By Ownership
    • Market Attractiveness Analysis
      • By Country
      • By Maximum Lift Height
      • By Ownership
    • Key Takeaways
  14. South Asia and Pacific Market Analysis 2020 to 2024 and Forecast 2025 to 2035, By Country
    • Historical Market Size Value (USD Million) Trend Analysis By Market Taxonomy, 2020 to 2024
    • Market Size Value (USD Million) Forecast By Market Taxonomy, 2025 to 2035
      • By Country
        • India
        • ASEAN
        • Australia & New Zealand
        • Rest of South Asia and Pacific
      • By Maximum Lift Height
      • By Ownership
    • Market Attractiveness Analysis
      • By Country
      • By Maximum Lift Height
      • By Ownership
    • Key Takeaways
  15. Middle East & Africa Market Analysis 2020 to 2024 and Forecast 2025 to 2035, By Country
    • Historical Market Size Value (USD Million) Trend Analysis By Market Taxonomy, 2020 to 2024
    • Market Size Value (USD Million) Forecast By Market Taxonomy, 2025 to 2035
      • By Country
        • Kingdom of Saudi Arabia
        • Other GCC Countries
        • Turkiye
        • South Africa
        • Other African Union
        • Rest of Middle East & Africa
      • By Maximum Lift Height
      • By Ownership
    • Market Attractiveness Analysis
      • By Country
      • By Maximum Lift Height
      • By Ownership
    • Key Takeaways
  16. Key Countries Market Analysis
    • USA
      • Pricing Analysis
      • Market Share Analysis, 2024
        • By Maximum Lift Height
        • By Ownership
    • Canada
      • Pricing Analysis
      • Market Share Analysis, 2024
        • By Maximum Lift Height
        • By Ownership
    • Mexico
      • Pricing Analysis
      • Market Share Analysis, 2024
        • By Maximum Lift Height
        • By Ownership
    • Brazil
      • Pricing Analysis
      • Market Share Analysis, 2024
        • By Maximum Lift Height
        • By Ownership
    • Chile
      • Pricing Analysis
      • Market Share Analysis, 2024
        • By Maximum Lift Height
        • By Ownership
    • Germany
      • Pricing Analysis
      • Market Share Analysis, 2024
        • By Maximum Lift Height
        • By Ownership
    • UK
      • Pricing Analysis
      • Market Share Analysis, 2024
        • By Maximum Lift Height
        • By Ownership
    • Italy
      • Pricing Analysis
      • Market Share Analysis, 2024
        • By Maximum Lift Height
        • By Ownership
    • Spain
      • Pricing Analysis
      • Market Share Analysis, 2024
        • By Maximum Lift Height
        • By Ownership
    • France
      • Pricing Analysis
      • Market Share Analysis, 2024
        • By Maximum Lift Height
        • By Ownership
    • India
      • Pricing Analysis
      • Market Share Analysis, 2024
        • By Maximum Lift Height
        • By Ownership
    • ASEAN
      • Pricing Analysis
      • Market Share Analysis, 2024
        • By Maximum Lift Height
        • By Ownership
    • Australia & New Zealand
      • Pricing Analysis
      • Market Share Analysis, 2024
        • By Maximum Lift Height
        • By Ownership
    • China
      • Pricing Analysis
      • Market Share Analysis, 2024
        • By Maximum Lift Height
        • By Ownership
    • Japan
      • Pricing Analysis
      • Market Share Analysis, 2024
        • By Maximum Lift Height
        • By Ownership
    • South Korea
      • Pricing Analysis
      • Market Share Analysis, 2024
        • By Maximum Lift Height
        • By Ownership
    • Russia
      • Pricing Analysis
      • Market Share Analysis, 2024
        • By Maximum Lift Height
        • By Ownership
    • Poland
      • Pricing Analysis
      • Market Share Analysis, 2024
        • By Maximum Lift Height
        • By Ownership
    • Hungary
      • Pricing Analysis
      • Market Share Analysis, 2024
        • By Maximum Lift Height
        • By Ownership
    • Kingdom of Saudi Arabia
      • Pricing Analysis
      • Market Share Analysis, 2024
        • By Maximum Lift Height
        • By Ownership
    • Turkiye
      • Pricing Analysis
      • Market Share Analysis, 2024
        • By Maximum Lift Height
        • By Ownership
    • South Africa
      • Pricing Analysis
      • Market Share Analysis, 2024
        • By Maximum Lift Height
        • By Ownership
  17. Market Structure Analysis
    • Competition Dashboard
    • Competition Benchmarking
    • Market Share Analysis of Top Players
      • By Regional
      • By Maximum Lift Height
      • By Ownership
  18. Competition Analysis
    • Competition Deep Dive
      • JCB (J.C. Bamford Excavators Ltd.)
        • Overview
        • Product Portfolio
        • Profitability by Market Segments (Product/Age /Sales Channel/Region)
        • Sales Footprint
        • Strategy Overview
          • Marketing Strategy
          • Product Strategy
          • Channel Strategy
      • Caterpillar Inc.
      • Manitou Group
      • Liebherr Group
      • Bobcat Company (Doosan Group)
      • Komatsu Ltd.
      • Terex Corporation
      • Merlo S.p.A.
      • Genie (Terex Corporation)
      • Haulotte Group
  19. Assumptions & Acronyms Used
  20. Research Methodology

List of Tables

  • Table 1: Global Market Value (USD Million) Forecast by Region, 2020-2035
  • Table 2: Global Market Value (USD Million) Forecast by Maximum Lift Height , 2020-2035
  • Table 3: Global Market Value (USD Million) Forecast by Ownership, 2020-2035
  • Table 4: North America Market Value (USD Million) Forecast by Country, 2020-2035
  • Table 5: North America Market Value (USD Million) Forecast by Maximum Lift Height , 2020-2035
  • Table 6: North America Market Value (USD Million) Forecast by Ownership, 2020-2035
  • Table 7: Latin America Market Value (USD Million) Forecast by Country, 2020-2035
  • Table 8: Latin America Market Value (USD Million) Forecast by Maximum Lift Height , 2020-2035
  • Table 9: Latin America Market Value (USD Million) Forecast by Ownership, 2020-2035
  • Table 10: Western Europe Market Value (USD Million) Forecast by Country, 2020-2035
  • Table 11: Western Europe Market Value (USD Million) Forecast by Maximum Lift Height , 2020-2035
  • Table 12: Western Europe Market Value (USD Million) Forecast by Ownership, 2020-2035
  • Table 13: Eastern Europe Market Value (USD Million) Forecast by Country, 2020-2035
  • Table 14: Eastern Europe Market Value (USD Million) Forecast by Maximum Lift Height , 2020-2035
  • Table 15: Eastern Europe Market Value (USD Million) Forecast by Ownership, 2020-2035
  • Table 16: East Asia Market Value (USD Million) Forecast by Country, 2020-2035
  • Table 17: East Asia Market Value (USD Million) Forecast by Maximum Lift Height , 2020-2035
  • Table 18: East Asia Market Value (USD Million) Forecast by Ownership, 2020-2035
  • Table 19: South Asia and Pacific Market Value (USD Million) Forecast by Country, 2020-2035
  • Table 20: South Asia and Pacific Market Value (USD Million) Forecast by Maximum Lift Height , 2020-2035
  • Table 21: South Asia and Pacific Market Value (USD Million) Forecast by Ownership, 2020-2035
  • Table 22: Middle East & Africa Market Value (USD Million) Forecast by Country, 2020-2035
  • Table 23: Middle East & Africa Market Value (USD Million) Forecast by Maximum Lift Height , 2020-2035
  • Table 24: Middle East & Africa Market Value (USD Million) Forecast by Ownership, 2020-2035

List of Figures

  • Figure 1: Global Market Pricing Analysis
  • Figure 2: Global Market Value (USD Million) Forecast 2020-2035
  • Figure 3: Global Market Value Share and BPS Analysis by Maximum Lift Height , 2025 and 2035
  • Figure 4: Global Market Y-o-Y Growth Comparison by Maximum Lift Height , 2025-2035
  • Figure 5: Global Market Attractiveness Analysis by Maximum Lift Height
  • Figure 6: Global Market Value Share and BPS Analysis by Ownership, 2025 and 2035
  • Figure 7: Global Market Y-o-Y Growth Comparison by Ownership, 2025-2035
  • Figure 8: Global Market Attractiveness Analysis by Ownership
  • Figure 9: Global Market Value (USD Million) Share and BPS Analysis by Region, 2025 and 2035
  • Figure 10: Global Market Y-o-Y Growth Comparison by Region, 2025-2035
  • Figure 11: Global Market Attractiveness Analysis by Region
  • Figure 12: North America Market Incremental Dollar Opportunity, 2025-2035
  • Figure 13: Latin America Market Incremental Dollar Opportunity, 2025-2035
  • Figure 14: Western Europe Market Incremental Dollar Opportunity, 2025-2035
  • Figure 15: Eastern Europe Market Incremental Dollar Opportunity, 2025-2035
  • Figure 16: East Asia Market Incremental Dollar Opportunity, 2025-2035
  • Figure 17: South Asia and Pacific Market Incremental Dollar Opportunity, 2025-2035
  • Figure 18: Middle East & Africa Market Incremental Dollar Opportunity, 2025-2035
  • Figure 19: North America Market Value Share and BPS Analysis by Country, 2025 and 2035
  • Figure 20: North America Market Value Share and BPS Analysis by Maximum Lift Height , 2025 and 2035
  • Figure 21: North America Market Y-o-Y Growth Comparison by Maximum Lift Height , 2025-2035
  • Figure 22: North America Market Attractiveness Analysis by Maximum Lift Height
  • Figure 23: North America Market Value Share and BPS Analysis by Ownership, 2025 and 2035
  • Figure 24: North America Market Y-o-Y Growth Comparison by Ownership, 2025-2035
  • Figure 25: North America Market Attractiveness Analysis by Ownership
  • Figure 26: Latin America Market Value Share and BPS Analysis by Country, 2025 and 2035
  • Figure 27: Latin America Market Value Share and BPS Analysis by Maximum Lift Height , 2025 and 2035
  • Figure 28: Latin America Market Y-o-Y Growth Comparison by Maximum Lift Height , 2025-2035
  • Figure 29: Latin America Market Attractiveness Analysis by Maximum Lift Height
  • Figure 30: Latin America Market Value Share and BPS Analysis by Ownership, 2025 and 2035
  • Figure 31: Latin America Market Y-o-Y Growth Comparison by Ownership, 2025-2035
  • Figure 32: Latin America Market Attractiveness Analysis by Ownership
  • Figure 33: Western Europe Market Value Share and BPS Analysis by Country, 2025 and 2035
  • Figure 34: Western Europe Market Value Share and BPS Analysis by Maximum Lift Height , 2025 and 2035
  • Figure 35: Western Europe Market Y-o-Y Growth Comparison by Maximum Lift Height , 2025-2035
  • Figure 36: Western Europe Market Attractiveness Analysis by Maximum Lift Height
  • Figure 37: Western Europe Market Value Share and BPS Analysis by Ownership, 2025 and 2035
  • Figure 38: Western Europe Market Y-o-Y Growth Comparison by Ownership, 2025-2035
  • Figure 39: Western Europe Market Attractiveness Analysis by Ownership
  • Figure 40: Eastern Europe Market Value Share and BPS Analysis by Country, 2025 and 2035
  • Figure 41: Eastern Europe Market Value Share and BPS Analysis by Maximum Lift Height , 2025 and 2035
  • Figure 42: Eastern Europe Market Y-o-Y Growth Comparison by Maximum Lift Height , 2025-2035
  • Figure 43: Eastern Europe Market Attractiveness Analysis by Maximum Lift Height
  • Figure 44: Eastern Europe Market Value Share and BPS Analysis by Ownership, 2025 and 2035
  • Figure 45: Eastern Europe Market Y-o-Y Growth Comparison by Ownership, 2025-2035
  • Figure 46: Eastern Europe Market Attractiveness Analysis by Ownership
  • Figure 47: East Asia Market Value Share and BPS Analysis by Country, 2025 and 2035
  • Figure 48: East Asia Market Value Share and BPS Analysis by Maximum Lift Height , 2025 and 2035
  • Figure 49: East Asia Market Y-o-Y Growth Comparison by Maximum Lift Height , 2025-2035
  • Figure 50: East Asia Market Attractiveness Analysis by Maximum Lift Height
  • Figure 51: East Asia Market Value Share and BPS Analysis by Ownership, 2025 and 2035
  • Figure 52: East Asia Market Y-o-Y Growth Comparison by Ownership, 2025-2035
  • Figure 53: East Asia Market Attractiveness Analysis by Ownership
  • Figure 54: South Asia and Pacific Market Value Share and BPS Analysis by Country, 2025 and 2035
  • Figure 55: South Asia and Pacific Market Value Share and BPS Analysis by Maximum Lift Height , 2025 and 2035
  • Figure 56: South Asia and Pacific Market Y-o-Y Growth Comparison by Maximum Lift Height , 2025-2035
  • Figure 57: South Asia and Pacific Market Attractiveness Analysis by Maximum Lift Height
  • Figure 58: South Asia and Pacific Market Value Share and BPS Analysis by Ownership, 2025 and 2035
  • Figure 59: South Asia and Pacific Market Y-o-Y Growth Comparison by Ownership, 2025-2035
  • Figure 60: South Asia and Pacific Market Attractiveness Analysis by Ownership
  • Figure 61: Middle East & Africa Market Value Share and BPS Analysis by Country, 2025 and 2035
  • Figure 62: Middle East & Africa Market Value Share and BPS Analysis by Maximum Lift Height , 2025 and 2035
  • Figure 63: Middle East & Africa Market Y-o-Y Growth Comparison by Maximum Lift Height , 2025-2035
  • Figure 64: Middle East & Africa Market Attractiveness Analysis by Maximum Lift Height
  • Figure 65: Middle East & Africa Market Value Share and BPS Analysis by Ownership, 2025 and 2035
  • Figure 66: Middle East & Africa Market Y-o-Y Growth Comparison by Ownership, 2025-2035
  • Figure 67: Middle East & Africa Market Attractiveness Analysis by Ownership
  • Figure 68: Global Market - Tier Structure Analysis
  • Figure 69: Global Market - Company Share Analysis
Dashboard
Dashboard
Dashboard
Dashboard
Dashboard
Dashboard

Full Research Suite comprises of:

Market outlook & trends analysis

Market outlook & trends analysis

Interviews & case studies

Interviews & case studies

Strategic recommendations

Strategic recommendations

Vendor profiles & capabilities analysis

Vendor profiles & capabilities analysis

5-year forecasts

5-year forecasts

8 regions and 60+ country-level data splits

8 regions and 60+ country-level data splits

Market segment data splits

Market segment data splits

12 months of continuous data updates

12 months of continuous data updates

DELIVERED AS:

PDF EXCEL ONLINE

Full Research Suite


$5000

$7500

$10000

Buy Report Now
Future Market Insights

Telehandler Market

Chat With MaRIA

Chat With

MaRIA

Hi There, I am MaRIA, Your Market Research Intelligence Assistant. How may I help you?