Trans-Anethole Market Forecast and Outlook (2025-2035)

The trans-anethole market is projected to grow from USD 134.8 million in 2025 to USD 190.1 million by 2035, reflecting a steady CAGR of 3.5%. This growth is primarily driven by its increasing use as a flavoring agent in the food and beverage industry, particularly in products like confectionery, alcoholic beverages, and baked goods. The rising demand for natural and plant-based ingredients, particularly in the food sector, further enhances the market’s expansion.

Over the years, despite a moderate growth rate, consistent demand for trans-anethole has been observed across various sectors, including food and cosmetics. The steady rise is attributed to its wide applications in fragrances and essential oils, where it plays a critical role in enhancing aromatic profiles. The market sees a slow but consistent rise as trans-anethole continues to be favored for its natural origin and unique flavor-enhancing properties.
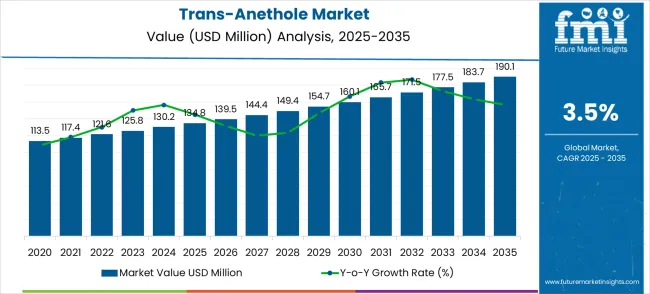
Quick Stats for Trans-Anethole Market

  • Trans-Anethole Market Value (2025): USD 134.8 million
  • Trans-Anethole Market Forecast Value (2035): USD 190.1 million
  • Trans-Anethole Market Forecast CAGR: 3.5%
  • Leading Application in Trans-Anethole Market: Flavors and Spices (62.0%)
  • Key Growth Regions in Trans-Anethole Market: China, India, and Germany
  • Top Key Players in Trans-Anethole Market: Atul, Penta Manufacturing, Berjé, A.G. Organica, Nanjing Cosmos Chemical, Hunan Shineway Enterprise, Chuanhui Perfumery

Trans Anethole Market   Market Value Analysis

Growth in this market is also supported by the increasing consumer preference for natural additives over synthetic alternatives. As health-conscious consumers seek more plant-based ingredients in their food and personal care products, the demand for trans-anethole, which is derived from star anise and fennel, has grown significantly. The market's trajectory shows slight acceleration during certain periods, especially when consumer trends shift towards more organic, chemical-free solutions.

However, the growth rate remains stable as trans-anethole is integrated into various industrial applications beyond food and beverages, such as pharmaceuticals and cosmetics, where it serves as a key ingredient due to its antioxidant properties. The projected CAGR of 3.5% indicates a steady yet secure growth outlook for the market, driven by consistent demand across various industries.

Trans-Anethole Market Key Takeaways

Trans-Anethole Market Value
Market Value (2025) USD 134.8 million
Market Forecast Value (2035) USD 190.1 million
Market Forecast CAGR 3.5%

The trans-anethole market commands a prominent position within the essential oils market, contributing about 10% of the total share due to its extensive use in aromatherapy and fragrances. In the flavor and fragrance ingredients market, it holds around 8%, reflecting its application in the creation of sweet, anise-like scents. Within the natural aromatic chemicals market, the share is estimated at 7%, as trans-anethole is valued for its role in natural extract formulations.

The food additives market accounts for about 6%, driven by its use in flavoring food and beverages. In the pharmaceutical ingredients market, trans-anethole accounts for approximately 5%, with applications in various therapeutic formulations. These combined figures highlight its broad usage across the flavoring, fragrance, and chemical sectors, demonstrating its value in a range of consumer and industrial products.

Why is the Trans-Anethole Market Growing?

Market expansion is being supported by the rapid increase in specialty food production worldwide and the corresponding need for distinctive aromatic compounds that provide superior flavor characteristics and natural authenticity for premium food formulations. Modern food industries rely on consistent flavor quality and aromatic profile reliability to ensure optimal consumer appeal including food processing facilities, beverage manufacturers, and specialty ingredient suppliers. Even minor flavor variations can require comprehensive formulation adjustments to maintain optimal taste standards and product consistency.

The growing complexity of food flavor composition requirements and increasing demand for natural aromatic ingredients are driving demand for trans-anethole from certified suppliers with appropriate purity capabilities and production expertise. Food manufacturers are increasingly requiring documented flavor specifications and supply reliability to maintain product quality and taste consistency. Industry specifications and quality standards are establishing standardized flavor compound procedures that require specialized production technologies and trained processing personnel.

Trans-Anethole Market Opportunity Pools

The Trans-Anethole market is entering a new phase of growth, driven by demand for natural flavors, specialty food expansion, and evolving quality and sustainability standards. By 2035, these pathways together can unlock USD 25-35 million in incremental revenue opportunities beyond baseline growth.

Pathway A -- Ultra-High Purity Leadership (99% Purity Grade) The 99% purity segment already holds the largest share due to its superior quality and flavor characteristics. Expanding purity optimization, quality certification, and premium positioning can consolidate leadership. Opportunity pool: USD 8-12 million.

Pathway B -- Premium Flavor Applications (Food & Beverage Enhancement) Flavors and spices applications account for the majority of demand. Growing premium food markets, especially in emerging economies, will drive higher adoption of trans-anethole for distinctive flavor profiles. Opportunity pool: USD 6-9 million.

Pathway C -- Pharmaceutical & Nutraceutical Growth Medical and health applications are expanding with increasing focus on natural compounds. Products tailored for pharmaceutical uses (high purity, certified quality, regulatory compliance) can capture significant growth. Opportunity pool: USD 3-5 million.

Pathway D -- Emerging Market Expansion Asia-Pacific and Latin America present a growing demand due to rising food processing industries. Targeting distribution networks and quality-assured supply chains will accelerate adoption. Opportunity pool: USD 2-4 million.

Pathway E -- Sustainable & Natural Sourcing With increasing sustainability requirements, there is an opportunity to promote naturally-sourced and environmentally-friendly trans-anethole innovations. Opportunity pool: USD 2-3 million.

Pathway F -- Specialized Processing Features Products with custom purification, enhanced flavor intensity, and specialized packaging offer premium positioning for high-end food manufacturers and pharmaceutical applications. Opportunity pool: USD 1-2 million.

Pathway G -- Technical Services & Application Support. Recurring value from formulation consulting, flavor testing, and technical support services creates long-term customer relationships. Opportunity pool: USD 1-2 million.

Pathway H -- Quality Assurance & Traceability Systems Digital quality tracking, batch certification, and supply chain transparency can elevate trans-anethole into premium specialty chemical categories while strengthening customer confidence. Opportunity pool: USD 1-2 million.

Segmental Analysis

The market is segmented by purity level, application, and region. By purity level, the market is divided into 98% purity, 99% purity, and other grades. Based on application, the market is categorized into flavors and spices, food, and pharmaceuticals. Regionally, the market is divided into North America, Europe, East Asia, South Asia & Pacific, Latin America, and Middle East & Africa.

By Purity Level, 99% Purity Segment Accounts for 56% Market Share

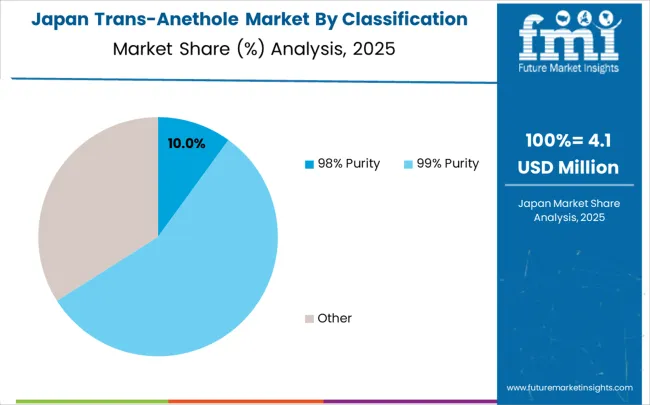
In 2025, the 99% purity trans-anethole segment is projected to capture around 56% of the total market share, making it the leading purity category. This dominance is largely driven by the widespread adoption of ultra-high-purity aromatic compounds that provide superior flavor intensity and formulation reliability, catering to a wide variety of premium applications. The 99% purity grade is particularly favored for its ability to deliver consistent olfactory and taste performance in both traditional and innovative flavor formulations, ensuring aromatic excellence. Food processing companies, pharmaceutical manufacturers, beverage producers, and specialty ingredient facilities increasingly prefer this purity level, as it meets stringent quality requirements without imposing excessive processing complexity or sourcing difficulties. The availability of well-established supply chains, along with comprehensive quality assurance options and regulatory compliance from leading suppliers, further reinforces the segment's market position. Additionally, this purity category benefits from consistent demand across regions, as it is considered a reliable and effective solution for applications requiring high flavor intensity and chemical consistency. The combination of quality, performance, and versatility makes 99% purity trans-anethole a dependable choice, ensuring its continued popularity in the specialty chemical and flavor ingredient markets.
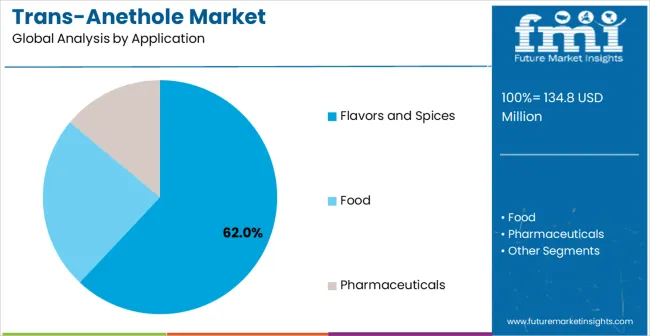
By Application, Flavors and Spices Segment Accounts for 62% Market Share

Trans Anethole Market   Analysis By Application

The flavors and spices segment is expected to represent 62% of trans-anethole demand in 2025, highlighting its position as the most significant application sector. This dominance stems from the essential aromatic properties of trans-anethole in flavor enhancement applications, where distinctive taste profiles and natural authenticity are critical to product differentiation and consumer acceptance. Flavors and spices applications often feature complex formulation requirements that demand specialized aromatic compounds throughout extensive product development periods, requiring reliable and consistent ingredient sources. Trans-anethole is particularly well-suited to these applications due to its ability to provide unique anise-like flavor characteristics and natural complexity, even in sophisticated flavor compositions. As food and beverage industries expand globally and emphasize premium natural ingredients, the demand for trans-anethole continues to rise. The segment also benefits from heightened consumer preference trends within the food industry, where manufacturers are increasingly prioritizing natural ingredients and authentic flavor experiences as essential product features. With food companies investing in natural ingredient sourcing and premium formulation standards, trans-anethole provides an essential component to maintain high-quality flavor profiles. The growth of artisanal food products, coupled with increased focus on natural flavor standards, ensures that flavors and spices applications will remain the largest and most stable demand driver for trans-anethole in the forecast period.

What are the Drivers, Restraints, and Key Trends of the Trans-Anethole Market?

The Trans-Anethole market is advancing moderately due to increasing specialty food industry development and growing recognition of natural aromatic compound advantages over synthetic alternatives in premium consumer applications. However, the market faces challenges including seasonal raw material availability affecting supply consistency, regulatory variations for food additives across different regions, and competition from synthetic anise compounds in cost-sensitive applications. Quality standardization efforts and sustainable sourcing programs continue to influence product development and market adoption patterns.

Advancement of Purification Technologies

The growing development of advanced purification and distillation systems is enabling higher purity levels with improved yield efficiency and enhanced aromatic compound preservation. Advanced purification technologies and optimized crystallization processes provide superior quality control while maintaining natural compound integrity requirements. These technologies are particularly valuable for specialty chemical operators who require reliable product quality that can support extensive formulation operations with consistent aromatic results.

Integration of Sustainable Production Features

Modern trans-anethole producers are incorporating advanced sustainable production practices and environmental management systems that enhance production efficiency and product quality. Integration of green chemistry principles and optimized reaction processes enables superior environmental performance and comprehensive sustainability capabilities. Advanced production features support operation in diverse manufacturing environments while meeting various environmental requirements and quality specifications.
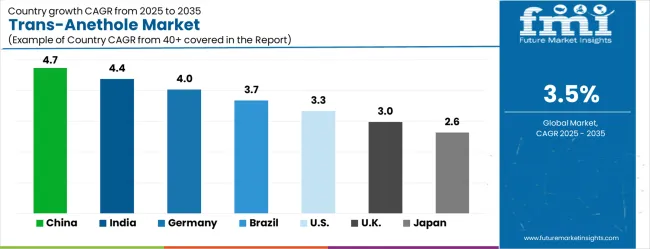
Analysis of Trans-Anethole Market by Key Country

Trans Anethole Market   CAGR Analysis By Country

Country CAGR (2025-2035)
China 4.7%
India 4.4%
Germany 4.0%
Brazil 3.7%
United States 3.3%
United Kingdom 3.0%
Japan 2.6%

The trans-anethole market is growing steadily, with China leading at a 4.7% CAGR through 2035, driven by expanding food processing industry development and increasing adoption of specialty aromatic compounds. India follows at 4.4%, supported by rising food manufacturing infrastructure development and growing awareness of natural flavor ingredients. Germany grows consistently at 4.0%, integrating natural aromatic compounds into its established food and pharmaceutical industries. Brazil records 3.7%, emphasizing food industry modernization and natural ingredient sourcing initiatives. The United States shows solid growth at 3.3%, focusing on premium food applications and quality enhancement. The United Kingdom demonstrates steady progress at 3.0%, maintaining established food processing and pharmaceutical applications. Japan records 2.6% growth, concentrating on quality optimization and specialized flavor applications.

The report covers an in-depth analysis of 40+ countries, the top-performing countries are highlighted below.

Demand Assessment for Trans-Anethole Market in China

The trans-anethole market in China is projected to exhibit the highest growth rate with a CAGR of 4.7% through 2035, driven by rapid expansion of food processing infrastructure and increasing demand for specialty aromatic compounds. The country's growing food manufacturing sector and expanding flavor ingredient production are creating significant demand for natural aromatic compounds. Major food manufacturers are establishing comprehensive sourcing networks to support the increasing requirements of food companies and flavor ingredient facilities across manufacturing regions.

Government food industry development initiatives are supporting establishment of modern food processing facilities and specialty ingredient complexes, driving demand for premium aromatic compounds throughout major industrial zones. Food sector modernization programs are facilitating adoption of natural flavor ingredients that enhance product appeal and consumer satisfaction standards across food product networks.

  • Food industry expansion programs promote specialty aromatic compound adoption among food manufacturers throughout key industrial development zones nationwide
  • Food sector development initiatives support natural ingredient integration and product quality enhancement for food processing facility operators

Opportunity Analysis for Trans-Anethole Market in India

The trans-anethole market in India is expanding at a CAGR of 4.4%, supported by increasing food manufacturing sector development and growing awareness of natural aromatic compound benefits. The country's expanding food processing industry infrastructure and rising product quality standards are driving demand for specialty flavor ingredients. Food manufacturers and processing companies are gradually implementing premium aromatic compounds to maintain product standards and market competitiveness.

Food industry growth and processing infrastructure development are creating opportunities for suppliers that can support diverse formulation requirements and quality specifications. Professional training and technical programs are building expertise among food technologists, enabling effective utilization of trans-anethole technology that meets food quality standards and consumer preference requirements.

  • Food processing infrastructure development programs facilitate adoption of natural aromatic compounds that support modern product quality standards across food industry sectors
  • Professional training initiatives enhance formulation capabilities among food processing personnel, enabling effective trans-anethole utilization throughout food manufacturing establishments

Market Analysis for Trans-Anethole Market in Germany

The trans-anethole market in Germany is projected to grow at a CAGR of 4.0%, supported by the country's emphasis on food industry quality standards and specialty chemical technology adoption. German food processing facilities are implementing sophisticated aromatic compound sourcing that meets stringent quality requirements and regulatory specifications. The market is characterized by focus on ingredient reliability, formulation excellence, and compliance with comprehensive industry standards.

Food industry investments are prioritizing premium aromatic technology that demonstrates superior performance and consistency while meeting German quality and regulatory standards. Professional certification programs are ensuring comprehensive technical expertise among food processing personnel, enabling specialized flavor capabilities that support diverse food applications and product requirements.

  • Food industry excellence programs emphasize premium aromatic compound adoption and quality standards that maintain German operational and regulatory requirements
  • Professional training initiatives develop comprehensive technical expertise among food processing personnel, supporting specialized formulation capabilities throughout food sectors

In-depth Review of Trans-Anethole Market in Brazil

The trans-anethole market in Brazil is growing at a CAGR of 3.7%, driven by increasing food industry development and growing recognition of natural aromatic compound advantages. The country's expanding food processing sector is gradually integrating premium aromatic ingredients to enhance product quality and market appeal. Food processing facilities and manufacturing companies are investing in natural compound sourcing to address evolving consumer preferences and quality standards.

Food industry modernization is facilitating adoption of natural aromatic technologies that support comprehensive formulation capabilities across food processing regions. Professional development programs are enhancing technical capabilities among food processing personnel, enabling effective trans-anethole utilization that meets evolving industry standards and product requirements.
  • Food industry modernization initiatives promote natural aromatic compound adoption that enhances formulation capabilities and quality standards across food processing sectors
  • Professional development programs build technical capabilities among food processing personnel, enabling specialized trans-anethole operation skills throughout food manufacturing establishments

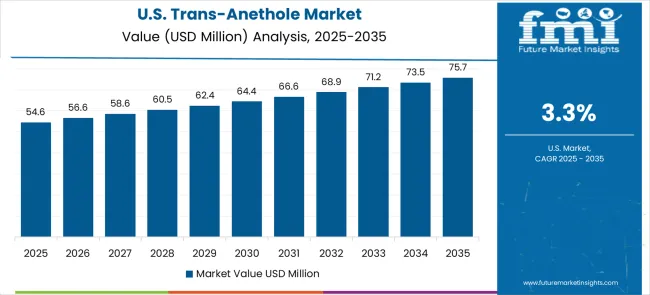
Sales Forecast for Trans-Anethole Market in the United States

Trans Anethole Market   Country Value Analysis

The trans-anethole market in the USA is expanding at a CAGR of 3.3%, driven by established food industries and growing emphasis on premium product enhancement. Large food companies and specialty ingredient providers are implementing comprehensive aromatic compound capabilities to serve diverse formulation requirements. The market benefits from established supply distribution networks and professional development programs that support various food and pharmaceutical applications.

Food industry leadership is enabling standardized ingredient utilization across multiple product types, providing consistent quality standards and comprehensive flavor coverage throughout regional markets. Professional development and certification programs are building specialized technical expertise among formulation specialists, enabling effective trans-anethole utilization that supports evolving food facility requirements.

  • Food integration facilitates standardized aromatic compound workflows across product types, providing consistent quality standards and comprehensive formulation support throughout regional markets
  • Professional certification programs develop specialized technical expertise among food processing personnel, enabling advanced flavor capabilities that support diverse food requirements

Revenue Prospects for Trans-Anethole Market in the United Kingdom

The trans-anethole market in the UK is projected to grow at a CAGR of 3%, supported by established food processing sectors and growing emphasis on natural flavor capabilities. British food processing facilities and manufacturing service providers are implementing aromatic compound sourcing that meets industry quality standards and regulatory requirements. The market benefits from established food processing infrastructure and comprehensive training programs for food technology professionals.

Food processing facility investments are prioritizing natural aromatic compounds that support diverse formulation applications while maintaining established quality and regulatory standards. Professional development programs are building technical expertise among food processing personnel, enabling specialized trans-anethole operation capabilities that meet evolving facility requirements and quality standards.
  • Food processing facility enhancement programs support natural aromatic compound adoption that maintains quality standards and formulation excellence throughout food processing sectors
  • Professional training initiatives build comprehensive technical skills among food processing personnel, enabling specialized trans-anethole operation capabilities throughout food manufacturing establishments

Growth Outlook for Trans-Anethole Market in Japan

Trans Anethole Market   Japan Market Share Analysis By Classification

The trans-anethole market in Japan is growing at a CAGR of 2.6%, driven by the country's focus on food technology innovation and quality enhancement applications. Japanese food processing facilities are implementing advanced aromatic compound sourcing that demonstrates superior quality reliability and formulation consistency. The market is characterized by emphasis on ingredient excellence, quality assurance, and integration with established food processing workflows.

Food technology investments are prioritizing innovative aromatic solutions that combine natural compound sourcing with precision quality control while maintaining Japanese reliability and consistency standards. Professional development programs are ensuring comprehensive technical expertise among food processing personnel, enabling specialized formulation capabilities that support diverse food applications and product requirements.
  • Food technology innovation programs promote advanced aromatic compound development and quality enhancement features that maintain Japanese precision and reliability standards
  • Professional certification initiatives develop comprehensive technical expertise among food processing personnel, supporting advanced formulation capabilities and quality assurance requirements

Europe Market Split by Country

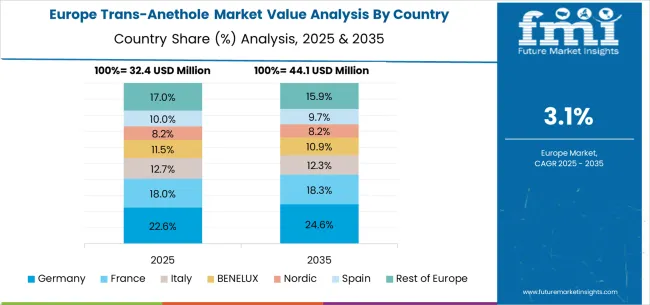
Trans Anethole Market   Europe Country Market Share Analysis, 2025 & 2035

The trans-anethole market in Europe is forecast to expand from USD 35.2 million in 2025 to USD 49.7 million by 2035, registering a CAGR of 3.5%. Germany will remain the largest market, holding 28.4% share in 2025, easing to 27.9% by 2035, supported by strong food processing infrastructure and advanced flavor ingredient standards. The United Kingdom follows, rising from 21.3% in 2025 to 21.8% by 2035, driven by premium food demand and specialty flavor applications. France is expected to maintain stability from 17.8% to 17.5%, reflecting consistent food industry investments and natural ingredient preferences. Italy holds around 13.6% throughout the forecast period, supported by traditional food manufacturing and flavor ingredient facility upgrades. Spain grows from 10.2% to 10.8% with expanding food processing infrastructure and increased focus on natural aromatic ingredients. BENELUX markets maintain 5.4% to 5.2%, while the remainder of Europe hovers near 3.3%--3.4%, balancing emerging Eastern European food processing development against mature Nordic markets with established specialty ingredient adoption patterns.

Competitive Landscape of Trans-Anethole Market

The trans-anethole market is defined by competition among specialized aromatic compound suppliers, flavor ingredient companies, and specialty chemical solution providers. Companies are investing in advanced production technology development, quality assurance optimization, sustainable sourcing improvements, and comprehensive technical service capabilities to deliver reliable, consistent, and cost-effective aromatic solutions. Strategic partnerships, quality innovation, and market expansion are central to strengthening product portfolios and market presence.

Penta Manufacturing provides specialized chemical products with focus on quality reliability and processing efficiency. Berjé delivers advanced specialty aromatic solutions with emphasis on purity and application-friendly operation. A.G Organica specializes in aromatic compounds with advanced production technology integration.

Nanjing Cosmos Chemical offers professional-grade chemical ingredients with comprehensive quality support capabilities. Hunan Shineway Enterprise delivers established specialty chemical solutions with advanced aromatic compound technologies. Chuanhui Perfumery provides specialized aromatic equipment with focus on quality optimization. These companies offer specialized manufacturing expertise, product reliability, and comprehensive development capabilities across global and regional market segments.

Key Players in the Trans-Anethole Market

  • Atul
  • Penta Manufacturing
  • Berjé
  • A.G Organica
  • Nanjing Cosmos Chemical
  • Hunan Shineway Enterprise
  • Chuanhui Perfumery

Scope of the Report

Item Value
Quantitative Units USD 134.8 million
Purity Level 98% Purity, 99% Purity, Other
Application Flavors and Spices, Food, Pharmaceuticals
Regions Covered North America, Europe, East Asia, South Asia & Pacific, Latin America, Middle East & Africa
Country Covered China, India, Germany, Brazil, United States, United Kingdom, Japan, and 40+ countries
Key Companies Profiled Atul, Penta Manufacturing, Berjé, A.G Organica, Nanjing Cosmos Chemical, Hunan Shineway Enterprise, Chuanhui Perfumery
Additional Attributes Dollar sales by purity level and application segment, regional demand trends across major markets, competitive landscape with established aromatic compound suppliers and emerging specialty providers, customer preferences for different purity options and production methods, integration with food industry systems and formulation protocols, innovations in production efficiency and quality assurance technologies, and adoption of sustainable production design features with enhanced purity capabilities for improved formulation workflows.

Trans-Anethole Market by Segments

Purity Level:

  • 98% Purity
  • 99% Purity
  • Other

Application:

  • Flavors and Spices
  • Food
  • Pharmaceuticals

Region:

  • North America
    • United States
    • Canada
    • Mexico
  • Europe
    • Germany
    • United Kingdom
    • France
    • Italy
    • Spain
    • Nordic
    • BENELUX
    • Rest of Europe
  • East Asia
    • China
    • Japan
    • South Korea
  • South Asia & Pacific
    • India
    • ASEAN
    • Australia & New Zealand
    • Rest of South Asia & Pacific
  • Latin America
    • Brazil
    • Chile
    • Rest of Latin America
  • Middle East & Africa
    • Kingdom of Saudi Arabia
    • Other GCC Countries
    • Turkiye
    • South Africa
    • Other African Union
    • Rest of Middle East & Africa

Table of Content

  1. Executive Summary
    • Global Market Outlook
    • Demand to side Trends
    • Supply to side Trends
    • Technology Roadmap Analysis
    • Analysis and Recommendations
  2. Market Overview
    • Market Coverage / Taxonomy
    • Market Definition / Scope / Limitations
  3. Market Background
    • Market Dynamics
      • Drivers
      • Restraints
      • Opportunity
      • Trends
    • Scenario Forecast
      • Demand in Optimistic Scenario
      • Demand in Likely Scenario
      • Demand in Conservative Scenario
    • Opportunity Map Analysis
    • Product Life Cycle Analysis
    • Supply Chain Analysis
    • Investment Feasibility Matrix
    • Value Chain Analysis
    • PESTLE and Porter’s Analysis
    • Regulatory Landscape
    • Regional Parent Market Outlook
    • Production and Consumption Statistics
    • Import and Export Statistics
  4. Global Market Analysis 2020 to 2024 and Forecast, 2025 to 2035
    • Historical Market Size Value (USD Million) Analysis, 2020 to 2024
    • Current and Future Market Size Value (USD Million) Projections, 2025 to 2035
      • Y to o to Y Growth Trend Analysis
      • Absolute $ Opportunity Analysis
  5. Global Market Pricing Analysis 2020 to 2024 and Forecast 2025 to 2035
  6. Global Market Analysis 2020 to 2024 and Forecast 2025 to 2035, By Classification
    • Introduction / Key Findings
    • Historical Market Size Value (USD Million) Analysis By Classification , 2020 to 2024
    • Current and Future Market Size Value (USD Million) Analysis and Forecast By Classification , 2025 to 2035
      • 98% Purity
      • 99% Purity
      • Other
    • Y to o to Y Growth Trend Analysis By Classification , 2020 to 2024
    • Absolute $ Opportunity Analysis By Classification , 2025 to 2035
  7. Global Market Analysis 2020 to 2024 and Forecast 2025 to 2035, By Application
    • Introduction / Key Findings
    • Historical Market Size Value (USD Million) Analysis By Application, 2020 to 2024
    • Current and Future Market Size Value (USD Million) Analysis and Forecast By Application, 2025 to 2035
      • Flavors and Spices
      • Food
      • Pharmaceuticals
    • Y to o to Y Growth Trend Analysis By Application, 2020 to 2024
    • Absolute $ Opportunity Analysis By Application, 2025 to 2035
  8. Global Market Analysis 2020 to 2024 and Forecast 2025 to 2035, By Region
    • Introduction
    • Historical Market Size Value (USD Million) Analysis By Region, 2020 to 2024
    • Current Market Size Value (USD Million) Analysis and Forecast By Region, 2025 to 2035
      • North America
      • Latin America
      • Western Europe
      • Eastern Europe
      • East Asia
      • South Asia and Pacific
      • Middle East & Africa
    • Market Attractiveness Analysis By Region
  9. North America Market Analysis 2020 to 2024 and Forecast 2025 to 2035, By Country
    • Historical Market Size Value (USD Million) Trend Analysis By Market Taxonomy, 2020 to 2024
    • Market Size Value (USD Million) Forecast By Market Taxonomy, 2025 to 2035
      • By Country
        • USA
        • Canada
        • Mexico
      • By Classification
      • By Application
    • Market Attractiveness Analysis
      • By Country
      • By Classification
      • By Application
    • Key Takeaways
  10. Latin America Market Analysis 2020 to 2024 and Forecast 2025 to 2035, By Country
    • Historical Market Size Value (USD Million) Trend Analysis By Market Taxonomy, 2020 to 2024
    • Market Size Value (USD Million) Forecast By Market Taxonomy, 2025 to 2035
      • By Country
        • Brazil
        • Chile
        • Rest of Latin America
      • By Classification
      • By Application
    • Market Attractiveness Analysis
      • By Country
      • By Classification
      • By Application
    • Key Takeaways
  11. Western Europe Market Analysis 2020 to 2024 and Forecast 2025 to 2035, By Country
    • Historical Market Size Value (USD Million) Trend Analysis By Market Taxonomy, 2020 to 2024
    • Market Size Value (USD Million) Forecast By Market Taxonomy, 2025 to 2035
      • By Country
        • Germany
        • UK
        • Italy
        • Spain
        • France
        • Nordic
        • BENELUX
        • Rest of Western Europe
      • By Classification
      • By Application
    • Market Attractiveness Analysis
      • By Country
      • By Classification
      • By Application
    • Key Takeaways
  12. Eastern Europe Market Analysis 2020 to 2024 and Forecast 2025 to 2035, By Country
    • Historical Market Size Value (USD Million) Trend Analysis By Market Taxonomy, 2020 to 2024
    • Market Size Value (USD Million) Forecast By Market Taxonomy, 2025 to 2035
      • By Country
        • Russia
        • Poland
        • Hungary
        • Balkan & Baltic
        • Rest of Eastern Europe
      • By Classification
      • By Application
    • Market Attractiveness Analysis
      • By Country
      • By Classification
      • By Application
    • Key Takeaways
  13. East Asia Market Analysis 2020 to 2024 and Forecast 2025 to 2035, By Country
    • Historical Market Size Value (USD Million) Trend Analysis By Market Taxonomy, 2020 to 2024
    • Market Size Value (USD Million) Forecast By Market Taxonomy, 2025 to 2035
      • By Country
        • China
        • Japan
        • South Korea
      • By Classification
      • By Application
    • Market Attractiveness Analysis
      • By Country
      • By Classification
      • By Application
    • Key Takeaways
  14. South Asia and Pacific Market Analysis 2020 to 2024 and Forecast 2025 to 2035, By Country
    • Historical Market Size Value (USD Million) Trend Analysis By Market Taxonomy, 2020 to 2024
    • Market Size Value (USD Million) Forecast By Market Taxonomy, 2025 to 2035
      • By Country
        • India
        • ASEAN
        • Australia & New Zealand
        • Rest of South Asia and Pacific
      • By Classification
      • By Application
    • Market Attractiveness Analysis
      • By Country
      • By Classification
      • By Application
    • Key Takeaways
  15. Middle East & Africa Market Analysis 2020 to 2024 and Forecast 2025 to 2035, By Country
    • Historical Market Size Value (USD Million) Trend Analysis By Market Taxonomy, 2020 to 2024
    • Market Size Value (USD Million) Forecast By Market Taxonomy, 2025 to 2035
      • By Country
        • Kingdom of Saudi Arabia
        • Other GCC Countries
        • Turkiye
        • South Africa
        • Other African Union
        • Rest of Middle East & Africa
      • By Classification
      • By Application
    • Market Attractiveness Analysis
      • By Country
      • By Classification
      • By Application
    • Key Takeaways
  16. Key Countries Market Analysis
    • USA
      • Pricing Analysis
      • Market Share Analysis, 2024
        • By Classification
        • By Application
    • Canada
      • Pricing Analysis
      • Market Share Analysis, 2024
        • By Classification
        • By Application
    • Mexico
      • Pricing Analysis
      • Market Share Analysis, 2024
        • By Classification
        • By Application
    • Brazil
      • Pricing Analysis
      • Market Share Analysis, 2024
        • By Classification
        • By Application
    • Chile
      • Pricing Analysis
      • Market Share Analysis, 2024
        • By Classification
        • By Application
    • Germany
      • Pricing Analysis
      • Market Share Analysis, 2024
        • By Classification
        • By Application
    • UK
      • Pricing Analysis
      • Market Share Analysis, 2024
        • By Classification
        • By Application
    • Italy
      • Pricing Analysis
      • Market Share Analysis, 2024
        • By Classification
        • By Application
    • Spain
      • Pricing Analysis
      • Market Share Analysis, 2024
        • By Classification
        • By Application
    • France
      • Pricing Analysis
      • Market Share Analysis, 2024
        • By Classification
        • By Application
    • India
      • Pricing Analysis
      • Market Share Analysis, 2024
        • By Classification
        • By Application
    • ASEAN
      • Pricing Analysis
      • Market Share Analysis, 2024
        • By Classification
        • By Application
    • Australia & New Zealand
      • Pricing Analysis
      • Market Share Analysis, 2024
        • By Classification
        • By Application
    • China
      • Pricing Analysis
      • Market Share Analysis, 2024
        • By Classification
        • By Application
    • Japan
      • Pricing Analysis
      • Market Share Analysis, 2024
        • By Classification
        • By Application
    • South Korea
      • Pricing Analysis
      • Market Share Analysis, 2024
        • By Classification
        • By Application
    • Russia
      • Pricing Analysis
      • Market Share Analysis, 2024
        • By Classification
        • By Application
    • Poland
      • Pricing Analysis
      • Market Share Analysis, 2024
        • By Classification
        • By Application
    • Hungary
      • Pricing Analysis
      • Market Share Analysis, 2024
        • By Classification
        • By Application
    • Kingdom of Saudi Arabia
      • Pricing Analysis
      • Market Share Analysis, 2024
        • By Classification
        • By Application
    • Turkiye
      • Pricing Analysis
      • Market Share Analysis, 2024
        • By Classification
        • By Application
    • South Africa
      • Pricing Analysis
      • Market Share Analysis, 2024
        • By Classification
        • By Application
  17. Market Structure Analysis
    • Competition Dashboard
    • Competition Benchmarking
    • Market Share Analysis of Top Players
      • By Regional
      • By Classification
      • By Application
  18. Competition Analysis
    • Competition Deep Dive
      • Atul
        • Overview
        • Product Portfolio
        • Profitability by Market Segments (Product/Age /Sales Channel/Region)
        • Sales Footprint
        • Strategy Overview
          • Marketing Strategy
          • Product Strategy
          • Channel Strategy
      • Penta Manufacturing
      • Berjé
      • A.G Organica
      • Nanjing Cosmos Chemical
      • Hunan Shineway Enterprise
      • Chuanhui Perfumery
  19. Assumptions & Acronyms Used
  20. Research Methodology

List of Tables

  • Table 1: Global Market Value (USD Million) Forecast by Region, 2020 to 2035
  • Table 2: Global Market Value (USD Million) Forecast by Classification , 2020 to 2035
  • Table 3: Global Market Value (USD Million) Forecast by Application, 2020 to 2035
  • Table 4: North America Market Value (USD Million) Forecast by Country, 2020 to 2035
  • Table 5: North America Market Value (USD Million) Forecast by Classification , 2020 to 2035
  • Table 6: North America Market Value (USD Million) Forecast by Application, 2020 to 2035
  • Table 7: Latin America Market Value (USD Million) Forecast by Country, 2020 to 2035
  • Table 8: Latin America Market Value (USD Million) Forecast by Classification , 2020 to 2035
  • Table 9: Latin America Market Value (USD Million) Forecast by Application, 2020 to 2035
  • Table 10: Western Europe Market Value (USD Million) Forecast by Country, 2020 to 2035
  • Table 11: Western Europe Market Value (USD Million) Forecast by Classification , 2020 to 2035
  • Table 12: Western Europe Market Value (USD Million) Forecast by Application, 2020 to 2035
  • Table 13: Eastern Europe Market Value (USD Million) Forecast by Country, 2020 to 2035
  • Table 14: Eastern Europe Market Value (USD Million) Forecast by Classification , 2020 to 2035
  • Table 15: Eastern Europe Market Value (USD Million) Forecast by Application, 2020 to 2035
  • Table 16: East Asia Market Value (USD Million) Forecast by Country, 2020 to 2035
  • Table 17: East Asia Market Value (USD Million) Forecast by Classification , 2020 to 2035
  • Table 18: East Asia Market Value (USD Million) Forecast by Application, 2020 to 2035
  • Table 19: South Asia and Pacific Market Value (USD Million) Forecast by Country, 2020 to 2035
  • Table 20: South Asia and Pacific Market Value (USD Million) Forecast by Classification , 2020 to 2035
  • Table 21: South Asia and Pacific Market Value (USD Million) Forecast by Application, 2020 to 2035
  • Table 22: Middle East & Africa Market Value (USD Million) Forecast by Country, 2020 to 2035
  • Table 23: Middle East & Africa Market Value (USD Million) Forecast by Classification , 2020 to 2035
  • Table 24: Middle East & Africa Market Value (USD Million) Forecast by Application, 2020 to 2035

List of Figures

  • Figure 1: Global Market Pricing Analysis
  • Figure 2: Global Market Value (USD Million) Forecast 2020-2035
  • Figure 3: Global Market Value Share and BPS Analysis by Classification , 2025 and 2035
  • Figure 4: Global Market Y to o to Y Growth Comparison by Classification , 2025-2035
  • Figure 5: Global Market Attractiveness Analysis by Classification
  • Figure 6: Global Market Value Share and BPS Analysis by Application, 2025 and 2035
  • Figure 7: Global Market Y to o to Y Growth Comparison by Application, 2025-2035
  • Figure 8: Global Market Attractiveness Analysis by Application
  • Figure 9: Global Market Value (USD Million) Share and BPS Analysis by Region, 2025 and 2035
  • Figure 10: Global Market Y to o to Y Growth Comparison by Region, 2025-2035
  • Figure 11: Global Market Attractiveness Analysis by Region
  • Figure 12: North America Market Incremental Dollar Opportunity, 2025-2035
  • Figure 13: Latin America Market Incremental Dollar Opportunity, 2025-2035
  • Figure 14: Western Europe Market Incremental Dollar Opportunity, 2025-2035
  • Figure 15: Eastern Europe Market Incremental Dollar Opportunity, 2025-2035
  • Figure 16: East Asia Market Incremental Dollar Opportunity, 2025-2035
  • Figure 17: South Asia and Pacific Market Incremental Dollar Opportunity, 2025-2035
  • Figure 18: Middle East & Africa Market Incremental Dollar Opportunity, 2025-2035
  • Figure 19: North America Market Value Share and BPS Analysis by Country, 2025 and 2035
  • Figure 20: North America Market Value Share and BPS Analysis by Classification , 2025 and 2035
  • Figure 21: North America Market Y to o to Y Growth Comparison by Classification , 2025-2035
  • Figure 22: North America Market Attractiveness Analysis by Classification
  • Figure 23: North America Market Value Share and BPS Analysis by Application, 2025 and 2035
  • Figure 24: North America Market Y to o to Y Growth Comparison by Application, 2025-2035
  • Figure 25: North America Market Attractiveness Analysis by Application
  • Figure 26: Latin America Market Value Share and BPS Analysis by Country, 2025 and 2035
  • Figure 27: Latin America Market Value Share and BPS Analysis by Classification , 2025 and 2035
  • Figure 28: Latin America Market Y to o to Y Growth Comparison by Classification , 2025-2035
  • Figure 29: Latin America Market Attractiveness Analysis by Classification
  • Figure 30: Latin America Market Value Share and BPS Analysis by Application, 2025 and 2035
  • Figure 31: Latin America Market Y to o to Y Growth Comparison by Application, 2025-2035
  • Figure 32: Latin America Market Attractiveness Analysis by Application
  • Figure 33: Western Europe Market Value Share and BPS Analysis by Country, 2025 and 2035
  • Figure 34: Western Europe Market Value Share and BPS Analysis by Classification , 2025 and 2035
  • Figure 35: Western Europe Market Y to o to Y Growth Comparison by Classification , 2025-2035
  • Figure 36: Western Europe Market Attractiveness Analysis by Classification
  • Figure 37: Western Europe Market Value Share and BPS Analysis by Application, 2025 and 2035
  • Figure 38: Western Europe Market Y to o to Y Growth Comparison by Application, 2025-2035
  • Figure 39: Western Europe Market Attractiveness Analysis by Application
  • Figure 40: Eastern Europe Market Value Share and BPS Analysis by Country, 2025 and 2035
  • Figure 41: Eastern Europe Market Value Share and BPS Analysis by Classification , 2025 and 2035
  • Figure 42: Eastern Europe Market Y to o to Y Growth Comparison by Classification , 2025-2035
  • Figure 43: Eastern Europe Market Attractiveness Analysis by Classification
  • Figure 44: Eastern Europe Market Value Share and BPS Analysis by Application, 2025 and 2035
  • Figure 45: Eastern Europe Market Y to o to Y Growth Comparison by Application, 2025-2035
  • Figure 46: Eastern Europe Market Attractiveness Analysis by Application
  • Figure 47: East Asia Market Value Share and BPS Analysis by Country, 2025 and 2035
  • Figure 48: East Asia Market Value Share and BPS Analysis by Classification , 2025 and 2035
  • Figure 49: East Asia Market Y to o to Y Growth Comparison by Classification , 2025-2035
  • Figure 50: East Asia Market Attractiveness Analysis by Classification
  • Figure 51: East Asia Market Value Share and BPS Analysis by Application, 2025 and 2035
  • Figure 52: East Asia Market Y to o to Y Growth Comparison by Application, 2025-2035
  • Figure 53: East Asia Market Attractiveness Analysis by Application
  • Figure 54: South Asia and Pacific Market Value Share and BPS Analysis by Country, 2025 and 2035
  • Figure 55: South Asia and Pacific Market Value Share and BPS Analysis by Classification , 2025 and 2035
  • Figure 56: South Asia and Pacific Market Y to o to Y Growth Comparison by Classification , 2025-2035
  • Figure 57: South Asia and Pacific Market Attractiveness Analysis by Classification
  • Figure 58: South Asia and Pacific Market Value Share and BPS Analysis by Application, 2025 and 2035
  • Figure 59: South Asia and Pacific Market Y to o to Y Growth Comparison by Application, 2025-2035
  • Figure 60: South Asia and Pacific Market Attractiveness Analysis by Application
  • Figure 61: Middle East & Africa Market Value Share and BPS Analysis by Country, 2025 and 2035
  • Figure 62: Middle East & Africa Market Value Share and BPS Analysis by Classification , 2025 and 2035
  • Figure 63: Middle East & Africa Market Y to o to Y Growth Comparison by Classification , 2025-2035
  • Figure 64: Middle East & Africa Market Attractiveness Analysis by Classification
  • Figure 65: Middle East & Africa Market Value Share and BPS Analysis by Application, 2025 and 2035
  • Figure 66: Middle East & Africa Market Y to o to Y Growth Comparison by Application, 2025-2035
  • Figure 67: Middle East & Africa Market Attractiveness Analysis by Application
  • Figure 68: Global Market - Tier Structure Analysis
  • Figure 69: Global Market - Company Share Analysis

Frequently Asked Questions

How big is the trans-anethole market in 2025?

The global trans-anethole market is estimated to be valued at USD 134.8 million in 2025.

What will be the size of trans-anethole market in 2035?

The market size for the trans-anethole market is projected to reach USD 190.1 million by 2035.

How much will be the trans-anethole market growth between 2025 and 2035?

The trans-anethole market is expected to grow at a 3.5% CAGR between 2025 and 2035.

What are the key product types in the trans-anethole market?

The key product types in trans-anethole market are 98% purity, 99% purity and other.

Which application segment to contribute significant share in the trans-anethole market in 2025?

In terms of application, flavors and spices segment to command 62.0% share in the trans-anethole market in 2025.

Future Market Insights

Trans-Anethole Market

Chat With

MaRIA

Hi There, I am MaRIA, Your Market Research Intelligence Assistant. How may I help you?