Tryptophan Market Outlook (2022 to 2032)

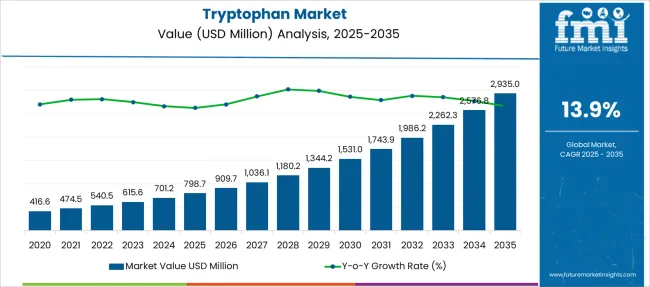
The global tryptophan market is likely to boom at a record CAGR of 13.9% from 2022 to 2032, likely to gain a revenue worth US$ 1986 million by 2032, up from US$ 540.5 million in 2022.

One of the key factors accelerating the demand for tryptophan during the forecast period of 2022 to 2032 is increasing consumer awareness pertaining to the health benefits of many ingredients added to food products, which include tryptophan.

Report Attribute Details
Tryptophan Market Value (2022) US$ 540.5 Million
Tryptophan Market Anticipated Forecast Value (2032) US$ 1986 Million
Tryptophan Market Projected Growth Rate (2022 to 2032) 13.9%

Tryptophan is one of the crucial amino acids which is important for overall growth in infants and for producing and maintaining the body’s muscles, proteins, neurotransmitters, and enzymes. It is an essential amino acid, meaning the body does not produce it; instead, it is attained from the diet. The demand for tryptophan is surging as it is crucial for an infant’s growth and in adults for nitrogen balance.

One such study of healthy participants revealed that larger doses of dietary tryptophan led to significantly less irritability and depression and reduced anxiety.

Tryptophan is a precursor of serotonin which is an essential neurotransmitter used as an antidepressant and assists in inducing sleep. Some of the natural sources of tryptophan are eggs, fish, cheese, banana, spinach, spirulina, dates, oats, crabs, etc. Pumpkin seeds have higher levels of tryptophan.

The sales of tryptophan are likely to increase and thereby boost the growth of the global tryptophan market. Niacin is used as a supplement for treating Hartnup’s disease, which is linked to tryptophan deficiency. Besides the vital uses in therapies, this amino acid is regularly used to fortify food, and tryptophan is recommended in the case of other tryptophan-deficient diets.

Besides the demand for tryptophan in the healthcare industry, the animal feed industry also uses this amino acid commonly. The clinical nutrition, food, and beverage industry also incorporate tryptophan largely and thereby increase the market share of tryptophan globally.

Don't pay for what you don't need

Customize your report by selecting specific countries or regions and save 30%!

Which are the Key Factors Influencing the Tryptophan Market?

The global tryptophan market is primarily driven by a significant increase in the consumption of feed ingredients. When tryptophan is supplemented with the feed of the livestock, it improves the feed intake of the animals, especially piglets. Also, since serotonin production is increased, it impacts the appetite of the livestock.

Gaining popularity in the cosmetic industry, an increase in consumption of animal feed, and a growing health-conscious population are some of the key factors fuelling the tryptophan market growth. Furthermore, more and more advancements in technology and modernization in the market, coupled with increasing demand from developing economies - all these factors are said to create novel opportunities for tryptophan manufacturers during the forecast period of 2022 to 2032.

The tryptophan market is also driven by the rising expenditure on health products and increased consumption of dietary supplements. Tryptophan supplements enhance mood and decrease depression, assist in insomnia treatment, and betters poor cognition and other neurological conditions.

The demand for tryptophan in the global market is rising owing to the efficient results studied with the supplementing feed with it. Moreover, most commonly, tryptophan is consumed by bodybuilders to assist with weight gain of the body. Tryptophan is said to elevate growth hormone levels and reduces body fatigue. Consumption of tryptophan has several health benefits, and this factor will increase the demand and sales of tryptophan in the global market.

Besides the driving factors, some of the factors which restrain the global market are side effects linked with the consumption of tryptophan and an increase in strict government actions. These factors will further possess as a market challenge during the forecast period.
What is the Regional Analysis for the Tryptophan Market?

Region-wise, North America has the majority market share in the global market owing to the rising number of health-conscious consumers and the increase in animal feed ingredients consumption in this region. North America is followed by Europe, dominating the global market. Strong animal nutrition and animal feed industry in these regions is accountable for the higher consumption of tryptophan in these regions.

In the North American region, a country like the USA has more consumers who are dedicated to their health, and this has resulted in healthy eating and an active lifestyle. This has catered to the demand for tryptophan, and several functional food manufacturers have integrated the use of tryptophan.

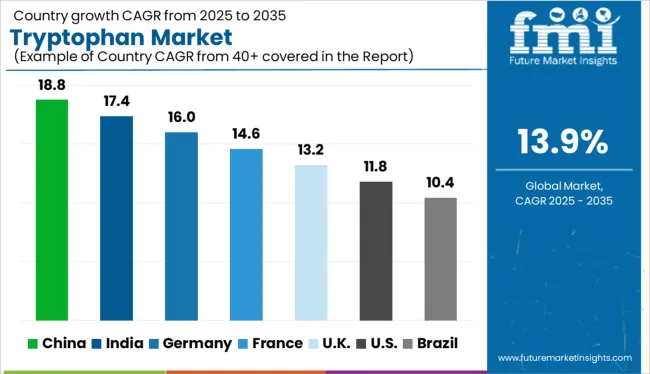
In terms of consumption, the Asia Pacific tryptophan market is anticipated to witness a huge growth rate during the forecast period. This higher demand is backed by development in the food and beverage industry, animal nutrition, and niche application in other industries like pharmaceutical, cosmetics, etc.
Nandini Roy Choudhury

Principal Consultant

Talk to Analyst

Find your sweet spots for generating winning opportunities in this market.

Who are Some of the Key Players in the Tryptophan Market?

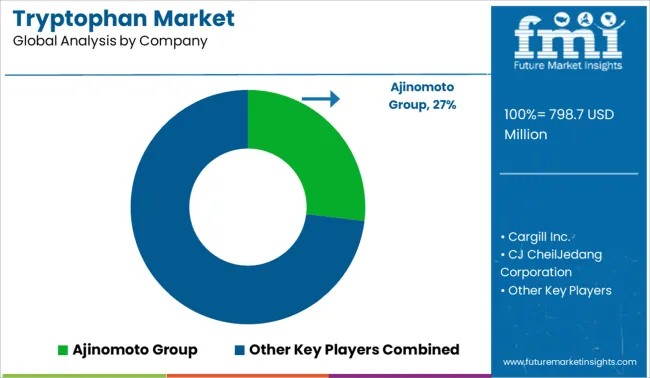
A few of the key players in the tryptophan market include Ajinomoto Group, Cargill Inc., CJ CheilJedang Corporation, Kyowa Hakko Bio Co., Ltd., Penta Manufacturing Company, Daesang Corporation, ADM Company, Evonik, Novus International, and Glanbia Plc.

In June 2021, Evonik proves the ecological benefits of its feeding solutions for poultry and swine. Evonik’s comparative life cycle assessment (LCA) showcased the ecological benefits of using its feed amino acids and feeding concepts in comparison with generic animal nutrition practices.

Report Scope

Report Attribute Details
Growth Rate CAGR of 13.9% from 2022 to 2032
Base Year for Estimation 2021
Historical Data 2015 to 2021
Forecast Period 2022 to 2032
Quantitative Units Revenue in USD Million, Volume in Kilotons, and CAGR from 2022 to 2032
Report Coverage Revenue Forecast, Volume Forecast, Company Ranking, Competitive Landscape, Growth Factors, Trends, and Pricing Analysis
Segments Covered
  • Grade
  • End Use
  • Region
Regions Covered
  • North America
  • Latin America
  • Europe
  • East Asia
  • South Asia
  • Oceania
  • Middle East and Africa
Key Countries Profiled
  • USA
  • Canada
  • Brazil
  • Argentina
  • Germany
  • United Kingdom
  • France
  • Spain
  • Italy
  • Nordics
  • BENELUX
  • Australia & New Zealand
  • China
  • India
  • ASIAN
  • GCC Countries
  • South Africa
Key Companies Profiled
  • Ajinomoto Group
  • Cargill Inc.
  • CJ CheilJedang Corporation
  • Kyowa Hakko Bio Co., Ltd
  • Penta Manufacturing Company
  • Daesang Corporation
  • ADM Company
  • Evonik
  • Novus International
  • Glanbia Plc
Customization Available Upon Request

Get the data you need at a Fraction of the cost

Personalize your report by choosing insights you need
and save 40%!

Key Segments Profiled in the Tryptophan Market Survey

By Grade:

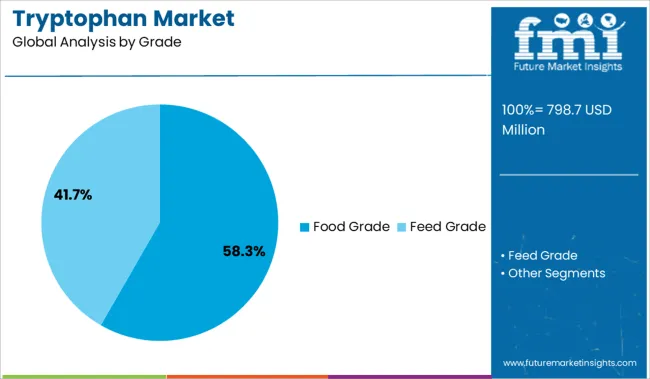
  • Food Grade
  • Feed Grade

By End Use:

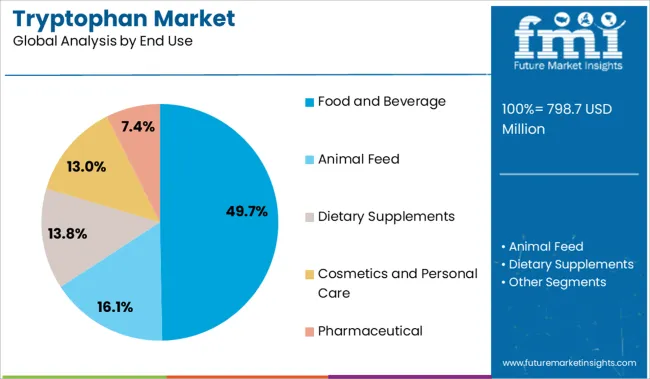
  • Food and Beverage
  • Animal Feed
  • Dietary Supplements
  • Cosmetics and Personal Care
  • Pharmaceutical

By Region:

  • North America
  • Latin America
  • Europe
  • East Asia
  • South Asia
  • Oceania
  • Middle East and Africa

Frequently Asked Questions

What is the Growth Outlook for the Tryptophan Market?

The global tryptophan market is set to advance at a CAGR of 13.9% from 2022 to 2032.

Which is the Future of Tryptophan Market?

The Tryptophan market is projected to hold a market share of US$ 765 million by 2032.

Who are a Few Key Players in the Tryptophan Market?

Some of the key players holding major global tryptophan market share are Ajinomoto Group, Cargill Inc., CJ CheilJedang Corporation, Kyowa Hakko Bio Co., Ltd., Penta Manufacturing Company, Daesang Corporation, ADM Company, Evonik, Novus International, and Glanbia Plc.

Table of Content
1. Executive Summary | Tryptophan Market

    1.1. Global Market Outlook

    1.2. Demand-side Trends

    1.3. Supply-side Trends

    1.4. Technology Roadmap Analysis

    1.5. Analysis and Recommendations

2. Market Overview

    2.1. Market Coverage / Taxonomy

    2.2. Market Definition / Scope / Limitations

3. Market Background

    3.1. Market Dynamics

        3.1.1. Drivers

        3.1.2. Restraints

        3.1.3. Opportunity

        3.1.4. Trends

    3.2. Scenario Forecast

        3.2.1. Demand in Optimistic Scenario

        3.2.2. Demand in Likely Scenario

        3.2.3. Demand in Conservative Scenario

    3.3. Opportunity Map Analysis

    3.4. Product Life Cycle Analysis

    3.5. Supply Chain Analysis

        3.5.1. Supply Side Participants and Their Roles

            3.5.1.1. Producers

            3.5.1.2. Mid-Level Participants (Traders/ Agents/ Brokers)

            3.5.1.3. Wholesalers and Distributors

        3.5.2. Value Added and Value Created at Node in the Supply Chain

        3.5.3. List of Raw Material Suppliers

        3.5.4. List of Existing and Potential Buyers

    3.6. Investment Feasibility Matrix

    3.7. Value Chain Analysis

        3.7.1. Profit Margin Analysis

        3.7.2. Wholesalers and Distributors

        3.7.3. Retailers

    3.8. PESTLE and Porter’s Analysis

    3.9. Regulatory Landscape

        3.9.1. By Key Regions

        3.9.2. By Key Countries

    3.10. Regional Parent Market Outlook

    3.11. Production and Consumption Statistics

    3.12. Import and Export Statistics

4. Global Market Analysis 2017 to 2021 and Forecast, 2022 to 2032

    4.1. Historical Market Size Value (US$ Million) & Volume (Tons) Analysis, 2017 to 2021

    4.2. Current and Future Market Size Value (US$ Million) & Volume (Tons) Projections, 2022 to 2032

        4.2.1. Y-o-Y Growth Trend Analysis

        4.2.2. Absolute $ Opportunity Analysis

5. Global Market Analysis 2017 to 2021 and Forecast 2022 to 2032, By Grade

    5.1. Introduction / Key Findings

    5.2. Historical Market Size Value (US$ Million) & Volume (Tons) Analysis By Grade, 2017 to 2021

    5.3. Current and Future Market Size Value (US$ Million) & Volume (Tons) Analysis and Forecast By Grade, 2022 to 2032

        5.3.1. Food Grade

        5.3.2. Feed Grade

    5.4. Y-o-Y Growth Trend Analysis By Grade, 2017 to 2021

    5.5. Absolute $ Opportunity Analysis By Grade, 2022 to 2032

6. Global Market Analysis 2017 to 2021 and Forecast 2022 to 2032, By End Use

    6.1. Introduction / Key Findings

    6.2. Historical Market Size Value (US$ Million) & Volume (Tons) Analysis By End Use, 2017 to 2021

    6.3. Current and Future Market Size Value (US$ Million) & Volume (Tons) Analysis and Forecast By End Use, 2022 to 2032

        6.3.1. Food and Beverage

        6.3.2. Animal Feed

        6.3.3. Dietary Supplements

        6.3.4. Cosmetics and Personal Care

        6.3.5. Pharmaceutical

    6.4. Y-o-Y Growth Trend Analysis By End Use, 2017 to 2021

    6.5. Absolute $ Opportunity Analysis By End Use, 2022 to 2032

7. Global Market Analysis 2017 to 2021 and Forecast 2022 to 2032, By Region

    7.1. Introduction

    7.2. Historical Market Size Value (US$ Million) & Volume (Tons) Analysis By Region, 2017 to 2021

    7.3. Current Market Size Value (US$ Million) & Volume (Tons) Analysis and Forecast By Region, 2022 to 2032

        7.3.1. North America

        7.3.2. Latin America

        7.3.3. Europe

        7.3.4. Asia Pacific

        7.3.5. Middle East and Africa

    7.4. Market Attractiveness Analysis By Region

8. North America Market Analysis 2017 to 2021 and Forecast 2022 to 2032, By Country

    8.1. Historical Market Size Value (US$ Million) & Volume (Tons) Trend Analysis By Market Taxonomy, 2017 to 2021

    8.2. Market Size Value (US$ Million) & Volume (Tons) Forecast By Market Taxonomy, 2022 to 2032

        8.2.1. By Country

            8.2.1.1. USA

            8.2.1.2. Canada

        8.2.2. By Grade

        8.2.3. By End Use

    8.3. Market Attractiveness Analysis

        8.3.1. By Country

        8.3.2. By Grade

        8.3.3. By End Use

    8.4. Key Takeaways

9. Latin America Market Analysis 2017 to 2021 and Forecast 2022 to 2032, By Country

    9.1. Historical Market Size Value (US$ Million) & Volume (Tons) Trend Analysis By Market Taxonomy, 2017 to 2021

    9.2. Market Size Value (US$ Million) & Volume (Tons) Forecast By Market Taxonomy, 2022 to 2032

        9.2.1. By Country

            9.2.1.1. Brazil

            9.2.1.2. Mexico

            9.2.1.3. Rest of Latin America

        9.2.2. By Grade

        9.2.3. By End Use

    9.3. Market Attractiveness Analysis

        9.3.1. By Country

        9.3.2. By Grade

        9.3.3. By End Use

    9.4. Key Takeaways

10. Europe Market Analysis 2017 to 2021 and Forecast 2022 to 2032, By Country

    10.1. Historical Market Size Value (US$ Million) & Volume (Tons) Trend Analysis By Market Taxonomy, 2017 to 2021

    10.2. Market Size Value (US$ Million) & Volume (Tons) Forecast By Market Taxonomy, 2022 to 2032

        10.2.1. By Country

            10.2.1.1. Germany

            10.2.1.2. United Kingdom

            10.2.1.3. France

            10.2.1.4. Spain

            10.2.1.5. Italy

            10.2.1.6. Rest of Europe

        10.2.2. By Grade

        10.2.3. By End Use

    10.3. Market Attractiveness Analysis

        10.3.1. By Country

        10.3.2. By Grade

        10.3.3. By End Use

    10.4. Key Takeaways

11. Asia Pacific Market Analysis 2017 to 2021 and Forecast 2022 to 2032, By Country

    11.1. Historical Market Size Value (US$ Million) & Volume (Tons) Trend Analysis By Market Taxonomy, 2017 to 2021

    11.2. Market Size Value (US$ Million) & Volume (Tons) Forecast By Market Taxonomy, 2022 to 2032

        11.2.1. By Country

            11.2.1.1. China

            11.2.1.2. Japan

            11.2.1.3. South Korea

            11.2.1.4. Malaysia

            11.2.1.5. Singapore

            11.2.1.6. Australia

            11.2.1.7. New Zealand

            11.2.1.8. Rest of APAC

        11.2.2. By Grade

        11.2.3. By End Use

    11.3. Market Attractiveness Analysis

        11.3.1. By Country

        11.3.2. By Grade

        11.3.3. By End Use

    11.4. Key Takeaways

12. Middle East and Africa Market Analysis 2017 to 2021 and Forecast 2022 to 2032, By Country

    12.1. Historical Market Size Value (US$ Million) & Volume (Tons) Trend Analysis By Market Taxonomy, 2017 to 2021

    12.2. Market Size Value (US$ Million) & Volume (Tons) Forecast By Market Taxonomy, 2022 to 2032

        12.2.1. By Country

            12.2.1.1. GCC Countries

            12.2.1.2. South Africa

            12.2.1.3. Israel

            12.2.1.4. Rest of Middle East and Africa

        12.2.2. By Grade

        12.2.3. By End Use

    12.3. Market Attractiveness Analysis

        12.3.1. By Country

        12.3.2. By Grade

        12.3.3. By End Use

    12.4. Key Takeaways

13. Key Countries Market Analysis

    13.1. USA

        13.1.1. Pricing Analysis

        13.1.2. Market Share Analysis, 2021

            13.1.2.1. By Grade

            13.1.2.2. By End Use

    13.2. Canada

        13.2.1. Pricing Analysis

        13.2.2. Market Share Analysis, 2021

            13.2.2.1. By Grade

            13.2.2.2. By End Use

    13.3. Brazil

        13.3.1. Pricing Analysis

        13.3.2. Market Share Analysis, 2021

            13.3.2.1. By Grade

            13.3.2.2. By End Use

    13.4. Mexico

        13.4.1. Pricing Analysis

        13.4.2. Market Share Analysis, 2021

            13.4.2.1. By Grade

            13.4.2.2. By End Use

    13.5. Germany

        13.5.1. Pricing Analysis

        13.5.2. Market Share Analysis, 2021

            13.5.2.1. By Grade

            13.5.2.2. By End Use

    13.6. United Kingdom

        13.6.1. Pricing Analysis

        13.6.2. Market Share Analysis, 2021

            13.6.2.1. By Grade

            13.6.2.2. By End Use

    13.7. France

        13.7.1. Pricing Analysis

        13.7.2. Market Share Analysis, 2021

            13.7.2.1. By Grade

            13.7.2.2. By End Use

    13.8. Spain

        13.8.1. Pricing Analysis

        13.8.2. Market Share Analysis, 2021

            13.8.2.1. By Grade

            13.8.2.2. By End Use

    13.9. Italy

        13.9.1. Pricing Analysis

        13.9.2. Market Share Analysis, 2021

            13.9.2.1. By Grade

            13.9.2.2. By End Use

    13.10. China

        13.10.1. Pricing Analysis

        13.10.2. Market Share Analysis, 2021

            13.10.2.1. By Grade

            13.10.2.2. By End Use

    13.11. Japan

        13.11.1. Pricing Analysis

        13.11.2. Market Share Analysis, 2021

            13.11.2.1. By Grade

            13.11.2.2. By End Use

    13.12. South Korea

        13.12.1. Pricing Analysis

        13.12.2. Market Share Analysis, 2021

            13.12.2.1. By Grade

            13.12.2.2. By End Use

    13.13. Malaysia

        13.13.1. Pricing Analysis

        13.13.2. Market Share Analysis, 2021

            13.13.2.1. By Grade

            13.13.2.2. By End Use

    13.14. Singapore

        13.14.1. Pricing Analysis

        13.14.2. Market Share Analysis, 2021

            13.14.2.1. By Grade

            13.14.2.2. By End Use

    13.15. Australia

        13.15.1. Pricing Analysis

        13.15.2. Market Share Analysis, 2021

            13.15.2.1. By Grade

            13.15.2.2. By End Use

    13.16. New Zealand

        13.16.1. Pricing Analysis

        13.16.2. Market Share Analysis, 2021

            13.16.2.1. By Grade

            13.16.2.2. By End Use

    13.17. GCC Countries

        13.17.1. Pricing Analysis

        13.17.2. Market Share Analysis, 2021

            13.17.2.1. By Grade

            13.17.2.2. By End Use

    13.18. South Africa

        13.18.1. Pricing Analysis

        13.18.2. Market Share Analysis, 2021

            13.18.2.1. By Grade

            13.18.2.2. By End Use

    13.19. Israel

        13.19.1. Pricing Analysis

        13.19.2. Market Share Analysis, 2021

            13.19.2.1. By Grade

            13.19.2.2. By End Use

14. Market Structure Analysis

    14.1. Competition Dashboard

    14.2. Competition Benchmarking

    14.3. Market Share Analysis of Top Players

        14.3.1. By Regional

        14.3.2. By Grade

        14.3.3. By End Use

15. Competition Analysis

    15.1. Competition Deep Dive

        15.1.1. Ajinomoto Group

            15.1.1.1. Overview

            15.1.1.2. Product Portfolio

            15.1.1.3. Profitability by Market Segments

            15.1.1.4. Sales Footprint

            15.1.1.5. Strategy Overview

                15.1.1.5.1. Marketing Strategy

                15.1.1.5.2. Product Strategy

                15.1.1.5.3. Channel Strategy

        15.1.2. Cargill Inc.

            15.1.2.1. Overview

            15.1.2.2. Product Portfolio

            15.1.2.3. Profitability by Market Segments

            15.1.2.4. Sales Footprint

            15.1.2.5. Strategy Overview

                15.1.2.5.1. Marketing Strategy

                15.1.2.5.2. Product Strategy

                15.1.2.5.3. Channel Strategy

        15.1.3. CJ CheilJedang Corporation

            15.1.3.1. Overview

            15.1.3.2. Product Portfolio

            15.1.3.3. Profitability by Market Segments

            15.1.3.4. Sales Footprint

            15.1.3.5. Strategy Overview

                15.1.3.5.1. Marketing Strategy

                15.1.3.5.2. Product Strategy

                15.1.3.5.3. Channel Strategy

        15.1.4. Kyowa Hakko Bio Co., Ltd.

            15.1.4.1. Overview

            15.1.4.2. Product Portfolio

            15.1.4.3. Profitability by Market Segments

            15.1.4.4. Sales Footprint

            15.1.4.5. Strategy Overview

                15.1.4.5.1. Marketing Strategy

                15.1.4.5.2. Product Strategy

                15.1.4.5.3. Channel Strategy

        15.1.5. Penta Manufacturing Company

            15.1.5.1. Overview

            15.1.5.2. Product Portfolio

            15.1.5.3. Profitability by Market Segments

            15.1.5.4. Sales Footprint

            15.1.5.5. Strategy Overview

                15.1.5.5.1. Marketing Strategy

                15.1.5.5.2. Product Strategy

                15.1.5.5.3. Channel Strategy

        15.1.6. Daesang Corporation

            15.1.6.1. Overview

            15.1.6.2. Product Portfolio

            15.1.6.3. Profitability by Market Segments

            15.1.6.4. Sales Footprint

            15.1.6.5. Strategy Overview

                15.1.6.5.1. Marketing Strategy

                15.1.6.5.2. Product Strategy

                15.1.6.5.3. Channel Strategy

        15.1.7. ADM Company

            15.1.7.1. Overview

            15.1.7.2. Product Portfolio

            15.1.7.3. Profitability by Market Segments

            15.1.7.4. Sales Footprint

            15.1.7.5. Strategy Overview

                15.1.7.5.1. Marketing Strategy

                15.1.7.5.2. Product Strategy

                15.1.7.5.3. Channel Strategy

        15.1.8. Evonik

            15.1.8.1. Overview

            15.1.8.2. Product Portfolio

            15.1.8.3. Profitability by Market Segments

            15.1.8.4. Sales Footprint

            15.1.8.5. Strategy Overview

                15.1.8.5.1. Marketing Strategy

                15.1.8.5.2. Product Strategy

                15.1.8.5.3. Channel Strategy

        15.1.9. Novus International

            15.1.9.1. Overview

            15.1.9.2. Product Portfolio

            15.1.9.3. Profitability by Market Segments

            15.1.9.4. Sales Footprint

            15.1.9.5. Strategy Overview

                15.1.9.5.1. Marketing Strategy

                15.1.9.5.2. Product Strategy

                15.1.9.5.3. Channel Strategy

        15.1.10. Glanbia Plc

            15.1.10.1. Overview

            15.1.10.2. Product Portfolio

            15.1.10.3. Profitability by Market Segments

            15.1.10.4. Sales Footprint

            15.1.10.5. Strategy Overview

                15.1.10.5.1. Marketing Strategy

                15.1.10.5.2. Product Strategy

                15.1.10.5.3. Channel Strategy

16. Assumptions & Acronyms Used

17. Research Methodology
Recommendations

Chemicals & Materials

Amino Acids Market

March 2022

REP-GB-745

July 2023

306 pages

Chemicals & Materials

Amino Resin Market

September 2024

REP-GB-340

Upcoming

Healthcare

Amino Acid Metabolism Disorders Treatment Market

February 2018

REP-GB-6359

170 pages

Explore Food and Beverage Insights

View Reports