Turbidimeter Market Outlook 2025 to 2035

The turbidimeter market is expected to grow steadily through 2025 to 2035 period due to the rising and increasing regulatory focusing that is growing towards water quality, along with mass industrial wastewater treatment compliance and food & beverage and pharmaceutical applications. Particularly in environmental, municipal and industrial applications, turbidimeters, used to measure the cloudiness or haziness of a fluid, are critical when it comes to monitoring the levels of particles in a given environment, and keeping water clear.

The growing necessity for, real-time turbidity measurement to comply with standards for safety and mitigate the occurrence of trace level contamination without compromising product quality is fostering the increased adoption of portable and benchtop turbidimeters across both developed and emerging economies.

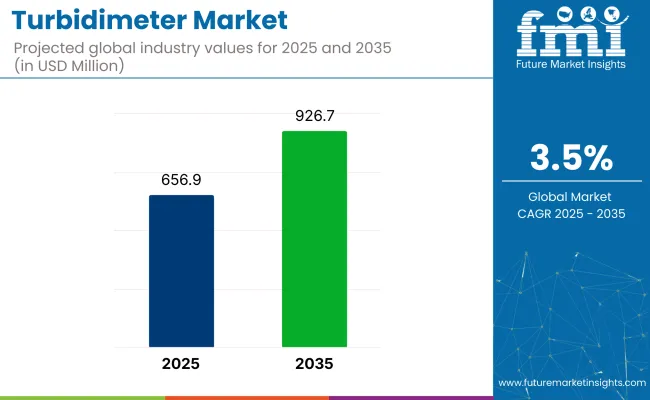
The market is projected to grow from USD 656.9 Million in 2025 to USD 926.7 Million by 2035, at a CAGR of 3.5% during the period of assessment. Such expansion is reliant on advancements in optical sensor precision, increasing investments toward modernizing water infrastructure, as well as demand for digital, user-friendly and IoT-enabled monitoring systems.
The rise in urbanization and industrial activity across the planet, particularly in water-scarce areas, is driving the utilities and industry to embrace efficient turbidity monitoring tools. Strict water safety standards set at an international level, coupled with a significant steer towards sustainability are prompting public and private investments in cutting edge water monitoring solutions.

Market Metrics

Metric Value
Market Size (2025E) USD 656.9 Million
Market Value (2035F) USD 926.7 Million
CAGR (2025 to 2035) 3.5%

Regional Market Trends

North America

Demand for a contaminant business development operation in North America, especially in the USA, which include the EPA, is creating a stable, expanding marketplace for turbidimeters. Continuous turbidity testing is mandated by the USA Environmental Protection Agency (EPA) in drinking water systems, wastewater treatment plants, and other discharge streams from industrial plants.

Public water authorities and private water utilities are budgeting for smart, automated monitoring solutions that mitigate operational risks and facilitate compliance with regulatory guidelines. North America is expected to be one of the major markets for high-accuracy turbidimeters in food & beverage applications, especially in the USA and Canada, as a correlation between those product quality benchmarks and hygiene standards are driving its demand.

Europe

Europe remains a large market, with Germany, the UK, France, and the Netherlands being the largest contributors. Public investments in water quality management are strong in this high-income region, particularly in relation to EU directives, including the urban waste water treatment directive and drinking water directive.

European players are installing digital interfaces and wireless connectivity in turbidimeter systems to facilitate remote monitoring and predictive maintenance. Overall, turbidity monitoring systems are widely implemented in sectors, such as chemicals, pharmaceuticals, dairy, and others, to optimize production processes while minimizing the risk of effluents.

Asia-Pacific

Global Turbidimeter Market, by region, led by China, India, and Japan. Strong demand is being driven by rapid industrialisation, urbanisation and growing focus on sustainable water management. Governments in India and Southeast Asia are funding modernization projects for rural and urban water supply systems that incorporate smart water quality monitoring.

Turbidimeter systems that are both cost and performance efficient can meet this high-volume demand while maintaining consistent, reliable results, so strict application of environmental laws in China and an increase in its manufacturing industries are on the rise. Japan is continuing to innovate cheap, portable and miniature water testing technologies to the context of more remote environment monitoring and disaster scientifically.

Challenges and Opportunities

Challenge

Calibration and Maintenance RequirementsFrequent calibration and cleaning are essential to maintain accuracy for turbidimeters, especially in high-particulate or corrosive environments, and overcoming this critical challenge is half the struggle in adopting new technologies. Gas detection and leak detection instruments used in industrial or environmental field conditions are subject to wear and contamination, which may result in false readings or instrument failure.

However, manual maintenance not only adds to operational costs but also requires skilled personnel, which can be a barrier in decentralized or remote water systems. To mitigate this, manufacturers are innovating towards self-cleaning probes, automatic calibration capabilities, and ruggedized equipment that minimizes the need for service personnel and reduces downtime.

Opportunity

Smart Water Networks and Real-Time MonitoringAs investments in smart water infrastructure are increasing, there is huge opportunity for turbidimeters with IoT, cloud analytics and transmitting real-time data. These sophisticated devices provide early detection of water quality issues as well as automated alerts and performance analytics that help utilities better manage distribution networks.

The drive towards digital transformation in utilities and industrial water management is creating new revenue opportunities for turbidimeter manufacturers. Now, the firms providing turbidity meters that are interoperable, modular, and low-maintenance will be in a prime position to tap into the future-ready demands of smart cities, industrial automation, and remote water monitoring initiatives.

Shifts in the Turbidimeter Market from 2020 to 2024 and Future Trends 2025 to 2035

The global turbidimeter market showed a steady increase from 2020, which is expected to continue until 2024 due to rising awareness about water quality and stringent environmental regulations. Increasing demand for accurate water quality monitoring in industries such as water treatment, food and beverage, and pharmaceuticals also greatly helped in market growth.

Turbidimeter innovation and efficiency were aided by combining IoT capabilities. The first such devices were, however, limited from wider use in the paradigm of the time due to cost of investment and requiring trained personnel to use such advanced instruments.

The turbidimeter market is estimated to grow steadily from 2025 to 2035, driven by a focus on technological advancements and sustainability. Smart sensors & automation integration are expected to enhance measurement accuracy and operational efficiency, meeting the demands of the changing industries.

Moreover, the growing construction of water treatment plants in developing economies and rising adoption of strict water quality standards worldwide are expected to boost the market. However, during these times, the market dynamics are likely to be affected by factors, for instance, the availability of other methods of measuring water quality and economic limitations in developing regions. ​

Market Shifts: A Comparative Analysis 2020 to 2024 vs. 2025 to 2035

Market Shift 2020 to 2024
Industry Applications Predominantly used in water treatment, environmental monitoring, and industrial processes.
Regulatory Environment Influenced by increasing environmental regulations emphasizing water quality monitoring.
Technological Integration Adoption of basic digital interfaces and initial IoT capabilities.
Market Expansion Growth concentrated in developed regions with established industrial infrastructures.
Consumer Preferences Demand driven by regulatory compliance and basic operational efficiency.
Market Shift 2025 to 2035
Industry Applications Diversification into sectors such as pharmaceuticals, food and beverage, and research laboratories.
Regulatory Environment Anticipated implementation of more stringent global water quality standards and compliance requirements.
Technological Integration Advancement towards fully integrated smart systems with real-time data analytics and remote monitoring.
Market Expansion Expansion into emerging markets driven by industrialization and heightened focus on environmental sustainability.
Consumer Preferences Shift towards advanced features offering higher accuracy, automation, and user-friendly interfaces to enhance operational efficiency.

Country-wise Insights

United States

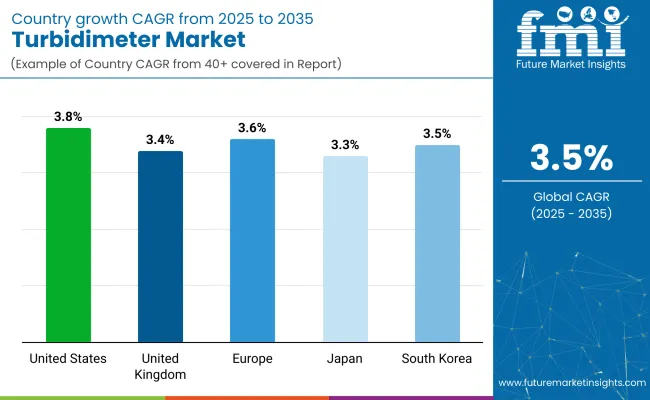
The USA turbidimeter market is anticipated to grow at a CAGR of 3.8% over the forecast period, 2025 to 2035. The growth is driven by strict regulatory standards for water quality monitoring in industrial, municipal, and environmental sectors. Due to mandatory turbidity testing in drinking water treatment plants implemented by the Environmental Protection Agency (EPA), the demand for high-precision turbidimeters has increased.

Industrial consumers, especially in food & beverage, pharmaceuticals, and chemicals sectors are also upping their investments in real-time turbidity analysing tools to maintain process consistency and compliance. And, the growing inclination toward smart water infrastructure, including grants to increase the smart count of systems, is likely to create potential market for digital-turbidimeter with remote monitoring capabilities.

Country CAGR (2025 to 2035)
United States 3.8%

United Kingdom

The UK The market will grow at a CAGR of 3.4% until 2035, driven by increasing demand in water safety and the modernization of water utilities. Increasing adoption of portable and laboratory turbidimeters in water treatment plants is due to the enforcement of water quality enhancement directives and environmental regulations.

Steadily increasing market growth is also being driven by the adoption of compact and user-friendly instruments in environmental testing and research laboratories. Moreover, digital water monitoring solutions are on the rise in alignment with the country’s sustainability and smart city initiatives.

Country CAGR (2025 to 2035)
United Kingdom 3.4%

Europe

Europe, with Germany, France and Italy being lucrative markets, is projected to register 3.6% CAGR throughout the forecast period. Rigorously enforced EU directives covering environmental conservation and water quality are pressuring municipalities and industries to modernize water treatment systems with sophisticated turbidity measurement equipment.

Furthermore, strengthening focused on wastewater management and observation of ISO compliant testing equipment are supporting the overall development of the market. IoT-enabled and low-maintenance turbidimeters are also being integrated at an increasing rate, as part of Europe’s green infrastructure initiatives.

Region CAGR (2025 to 2035)
Europe 3.6%

Japan

On the back of favourable government policies and the growing public health and water sanitation concern in the country, the turbidimeter market in Japan is expected to grow at a CAGR of 3.3% during next 10 years. National turbidity standards are driving municipal water authorities and industrial operators to adopt high-accuracy turbidimeters.

Miniaturization of Optical and Laser-Based Sensors electronic circuits is gaining traction, especially in laboratories and portable water quality testers. This potential is being bolstered by real-time monitoring and new, low-power consumption turbidimeters, enabling expansion into industrial and remote field applications.

Country CAGR (2025 to 2035)
Japan 3.3%

South Korea

The South Korea market is also expected to lead the growth with implementation of digital instrumentation and excellent environmental policies, which will result in a CAGR of 3.5% through 2035.

With the industry's water utility sector rapidly modernizing, there is demand for high-efficiency turbidimeters with wireless connectivity and remote diagnostics; the surge in industrial utilization, particularly within the semiconductor and food processing industries, can be attributed to the demand for accurate turbidity measurement in critical operational procedures. Turbidimeter adoption across the United States continues to grow steadily as governments invest in environmental safety and water infrastructure.

Country CAGR (2025 to 2035)
South Korea 3.5%

Segmentation Outlook - Turbidimeter Market

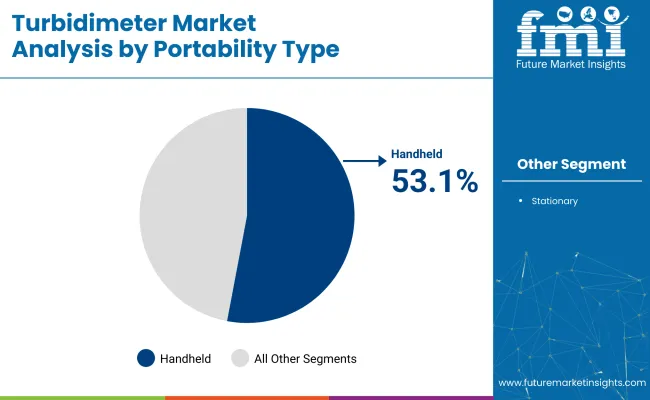
Handheld Turbidimeters Lead Due to Portability and Real-time Monitoring in Diverse Environments

By Portability Type Market Share (2025)
Handheld 53.1%

Handheld turbidimeters are the predominant type used in the global turbidimeter market owing to their convenience and portability, along with a growing adoption rate for field-based water quality analysis.

Unlike its bulkier counterparts that are better suited for labs or treatment plants, handheld turbidity meters tend to be the choice of technicians and environmental scientists who need to obtain fast, accurate turbidity readings in the field or outdoors without the need for complex infrastructure. Their small size and battery-powered architecture make them ideal for monitoring rivers, lakes, industrial outfalls and municipal water systems in real time.

Handheld turbidimeters are widely used by water utilities, environmental protection agencies and research institutions for compliance, site inspection and changes in water clarity. These devices allow users to identify button sediment, microbial pollution, and chemical pollutants on-site, which shortens decision-making immediately. The usability, accuracy and data logging capabilities of handheld devices have also been vastly improved due to advances in sensor technology and digital interfaces.

Handheld turbidimeters are compatible with smartphones and cloud platforms, allowing users to save and share data remotely. This feature aids in preventive maintenance, reducing the dependency of laboratories and improving the efficiency of water quality management programs. The adoption of handheld turbidimeters is growing enormously though sectors, as regulators across the world begin to increase monitoring requirements.
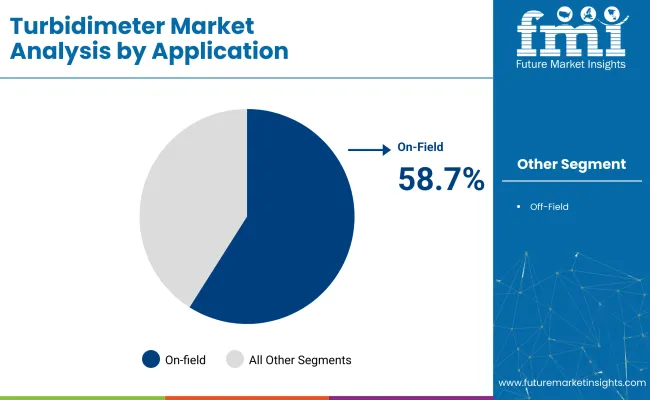
On-field Applications Hold a Leading Share Due to In-situ Monitoring and Immediate Analysis

By Application Market Share (2025)
On-field 58.7%

The turbidimeter market is dominated by on-field applications, as industries and environmental agencies seek for real-time, in-situ monitoring of their water systems. Therefore, turbidity meters are most important for detecting turbidity levels directly from the source, such as rivers, reservoirs, water treatment plants, mining sites, and aquaculture facilities. These applications require rapid and accurate measurements to prevent waterborne diseases, minimize environmental impact, and ensure compliance with regulations.

Turbidimeters have been used by field operators who need to detect rapid changes in turbidity caused by erosion, algal blooms, industrial discharge, or sedimentation. In case of contamination events, the response time is significantly reduced if onfield measurements act as the major data sources when centralized testing infrastructure is not available.

On-field turbidimeter deployment is progressively important for government-led water quality programs, agricultural runoff monitoring, and construction site inspections. The convenience of being able to conduct such tests under variable environmental conditions, without sacrificing accuracy, has made the on-field application the leading use case for portable and rugged turbidimeter systems.

With increasing urbanization and climate variability, water quality challenges are exacerbated and stakeholders are investing continuously in on-field measurement analysis tools to preserve the integrity of the ecosystem and meet sustainable development goals.

Competitive Outlook

The Turbidimeter Market is expanding with rising adoption in water treatment environmental monitoring pharmaceuticals and food processing sectors. Regulated industries and process optimization are fuelling investments in high-precision, real-time and automated solutions for turbidity measurement. Optical technology, portable instrumentation, and digital data integration are among the key areas of technology innovation that remain a strategic priority for key players.

Market Share Analysis by Company

Company Name Estimated Market Share (%)
Thermo Fisher Scientific 17-19%
Danaher ( Hach ) Corp. 15-17%
Xylem Inc. 12-14%
Other Companies (combined) 50-56%

Key Company Offerings and Activities 2024 to 2025

Company Name Key Offerings/Activities
Thermo Fisher Scientific In 2025 , introduced an enhanced benchtop turbidimeter with improved detection limits for industrial labs and utilities.
Danaher ( Hach ) Corp. In 2024 , launched a next-gen portable turbidimeter integrated with Bluetooth data sync and cloud-based analytics.
Emerson Electric Co. In 2025 , expanded its Rosemount Analytical line with advanced turbidimeters tailored for continuous process control.
Xylem Inc. In 2024 , developed compact turbidimeter modules optimized for municipal water systems and remote field deployment.
METTLER TOLEDO In 2025 , focused on lab-grade optical turbidimeters with real-time calibration alerts and precision verification tools.
Merck KGaA In 2024 , released multi-parameter photometers with built-in turbidity measurement for environmental monitoring.
PCE Instruments In 2025 , added handheld and lab turbidimeters supporting ISO 7027 compliance for water quality audits.
Hanna Instruments Inc. In 2025 , improved user interface and data logging capabilities in its range of portable turbidity meters.
Tintometer Inc. In 2024 , upgraded its Lovibond ® turbidity solutions with higher accuracy for pharmaceutical and beverage testing.
LaMotte Company In 2025 , launched digital field kits with integrated turbidimeters for educational and environmental testing.

Key Company Insights

Thermo Fisher Scientific (17-19%)

Thermo Fisher leads with high-precision lab instruments and has expanded its benchtop portfolio to cater to pharmaceutical and industrial QA/QC labs.

Danaher (Hach) Corp. (15-17%)

Danaher maintains strong market presence by emphasizing rugged, portable, and smart turbidimeters tailored for water treatment operations and fieldwork.

Xylem Inc. (12-14%)

Xylem strengthens its market position through compact and robust solutions optimized for decentralized water infrastructure and environmental agencies.

Emerson Electric Co.

Emerson focuses on inline and process-integrated turbidimeters, enhancing real-time control for manufacturing and chemical plants.

Other Key Players (50-56% Combined)

A number of players contribute to the market through targeted innovations:

  • METTLER TOLEDO - Specializes in high-accuracy lab solutions and automated monitoring systems for research and pharma sectors.
  • Merck KGaA - Offers integrated turbidimetry within multi-functional devices, enabling enhanced environmental diagnostics.
  • PCE Instruments - Serves industrial and regulatory bodies with affordable and ISO-compliant portable solutions.
  • Hanna Instruments Inc. - Focuses on intuitive interface design and user-friendly calibration features across its product line.
  • Tintometer Inc. - Delivers high-precision instruments for beverage and chemical industries under its Lovibond® brand.
  • LaMotte Company - Supports education and field analysis through durable, battery-powered turbidimeters and complete water testing kits.

Key Segments of Turbidimeter Market

By Portability Type:

  • Handheld
  • Stationary

By Application:

  • On-field
  • Off-field

By End Use:

  • Wastewater Treatment
  • Chemical & Materials
  • Oil & Gas
  • Pharmaceutical
  • Pulp & paper
  • Food & Beverages
  • Research & Academia
  • Others

By Region:

  • North America
  • Latin America
  • Europe
  • South Asia
  • East Asia
  • Middle East and Africa(MEA)
  • Oceania

Table of Content

  1. Executive Summary
  2. Industry Introduction, including Taxonomy and Market Definition
  3. Market Trends and Success Factors, including Macro-economic Factors, Market Dynamics, and Recent Industry Developments
  4. Global Market Demand Analysis 2020 to 2024 and Forecast 2025 to 2035, including Historical Analysis and Future Projections
  5. Pricing Analysis
  6. Global Market Analysis 2020 to 2024 and Forecast 2025 to 2035
    • Portability Type
    • Application
    • End Use
  7. Global Market Analysis 2020 to 2024 and Forecast 2025 to 2035, By Portability Type
    • Handheld
    • Stationary
  8. Global Market Analysis 2020 to 2024 and Forecast 2025 to 2035, By Application
    • On-field
    • Off-field
  9. Global Market Analysis 2020 to 2024 and Forecast 2025 to 2035, By End Use
    • Wastewater Treatment
    • Chemical & Materials
    • Oil & Gas
    • Pharmaceutical
    • Pulp & paper
    • Food & Beverages
    • Research & Academia
    • Others
  10. Global Market Analysis 2020 to 2024 and Forecast 2025 to 2035, By Region
    • North America
    • Latin America
    • Western Europe
    • Eastern Europe
    • East Asia
    • South Asia Pacific
    • Middle East and Africa
  11. North America Sales Analysis 2020 to 2024 and Forecast 2025 to 2035, by Key Segments and Countries
  12. Latin America Sales Analysis 2020 to 2024 and Forecast 2025 to 2035, by Key Segments and Countries
  13. Western Europe Sales Analysis 2020 to 2024 and Forecast 2025 to 2035, by Key Segments and Countries
  14. Eastern Europe Sales Analysis 2020 to 2024 and Forecast 2025 to 2035, by Key Segments and Countries
  15. East Asia Sales Analysis 2020 to 2024 and Forecast 2025 to 2035, by Key Segments and Countries
  16. South Asia Pacific Sales Analysis 2020 to 2024 and Forecast 2025 to 2035, by Key Segments and Countries
  17. Middle East and Africa Sales Analysis 2020 to 2024 and Forecast 2025 to 2035, by Key Segments and Countries
  18. Sales Forecast 2025 to 2035 by Portability Type, Application, and End Use for 30 Countries
  19. Competition Outlook, including Market Structure Analysis, Company Share Analysis by Key Players, and Competition Dashboard
  20. Company Profile
    • Thermo Fisher Scientific Inc.
    • Danaher (Hach) Corp.
    • Emerson Electric Co.
    • Xylem Inc.
    • METTLER TOLEDO
    • Merck KGaA
    • PCE Instruments
    • Hanna Instruments Inc.
    • Tintometer Inc.
    • LaMotte Company

List of Tables

Table 01: Global Market Size (US$ Million) and Volume (Units) Forecast by Portability Type, 2014 to 2029

Table 02: Global Market Size (US$ Million) and Volume (Units) Forecast by Application, 2014 to 2029

Table 03: Global Market Size (US$ Million) and Volume (Units) Forecast by End-Use, 2014 to 2029

Table 04: Global Market Size (US$ Million) and Volume (Units) Forecast by Region, 2014 to 2029

Table 05: North America Market Size (US$ Million) and Volume (Units) Forecast by Country, 2014 to 2029

Table 06: North America Market Size (US$ Million) and Volume (Units) Forecast by Portability Type, 2014 to 2029

Table 07: North America Market Size (US$ Million) and Volume (Units) Forecast by Application, 2014 to 2029

Table 08: North America Market Size (US$ Million) and Volume (Units) Forecast by End-Use, 2014 to 2029

Table 09: Latin America Market Size (US$ Million) and Volume (Units) Forecast by Country, 2014 to 2029

Table 10: Latin America Market Size (US$ Million) and Volume (Units) Forecast by Portability Type, 2014 to 2029

Table 11: Latin America Market Size (US$ Million) and Volume (Units) Forecast by Application, 2014 to 2029

Table 12: Latin America Market Size (US$ Million) and Volume (Units) Forecast by End-Use, 2014 to 2029

Table 13: Europe Market Size (US$ Million) and Volume (Units) Forecast by Country, 2014 to 2029

Table 14: Europe Market Size (US$ Million) and Volume (Units) Forecast by Portability Type, 2014 to 2029

Table 15: Europe Market Size (US$ Million) and Volume (Units) Forecast by Application, 2014 to 2029

Table 16: Europe Market Size (US$ Million) and Volume (Units) Forecast by End-Use, 2014 to 2029

Table 17: South Asia Market Size (US$ Million) and Volume (Units) Forecast by Country, 2014 to 2029

Table 18: South Asia Market Size (US$ Million) and Volume (Units) Forecast by Portability Type, 2014 to 2029

Table 19: South Asia Market Size (US$ Million) and Volume (Units) Forecast by Application, 2014 to 2029

Table 20: South Asia Market Size (US$ Million) and Volume (Units) Forecast by End-Use, 2014 to 2029

Table 21: East Asia Market Size (US$ Million) and Volume (Units) Forecast by Country, 2014 to 2029

Table 22: East Asia Market Size (US$ Million) and Volume (Units) Forecast by Portability Type, 2014 to 2029

Table 23: East Asia Market Size (US$ Million) and Volume (Units) Forecast by Application, 2014 to 2029

Table 24: East Asia Market Size (US$ Million) and Volume (Units) Forecast by End-Use, 2014 to 2029

Table 25: Oceania Market Size (US$ Million) and Volume (Units) Forecast by Country, 2014 to 2029

Table 26: Oceania Market Size (US$ Million) and Volume (Units) Forecast by Portability Type, 2014 to 2029

Table 27: Oceania Market Size (US$ Million) and Volume (Units) Forecast by Application, 2014 to 2029

Table 28: Oceania Market Size (US$ Million) and Volume (Units) Forecast by End-Use, 2014 to 2029

Table 29: Middle East & Africa Market Size (US$ Million) and Volume (Units) Forecast by Country, 2014 to 2029

Table 30: Middle East & Africa Market Size (US$ Million) and Volume (Units) Forecast by Portability Type, 2014 to 2029

Table 31: Middle East & Africa Market Size (US$ Million) and Volume (Units) Forecast by Application, 2014 to 2029

Table 32: Middle East & Africa Market Size (US$ Million) and Volume (Units) Forecast by End-Use, 2014 to 2029

Table 33: India Market Size (US$ Million) and Volume (Units) Forecast by Portability Type, 2014 to 2029

Table 34: India Market Size (US$ Million) and Volume (Units) Forecast by Application, 2014 to 2029

Table 35: India Market Size (US$ Million) and Volume (Units) Forecast by End-Use, 2014 to 2029

Table 37: GCC Countries Market Size (US$ Million) and Volume (Units) Forecast by Portability Type, 2014 to 2029

Table 38: GCC Countries Market Size (US$ Million) and Volume (Units) Forecast by Application, 2014 to 2029

Table 39: GCC Countries Market Size (US$ Million) and Volume (Units) Forecast by End-Use, 2014 to 2029

Table 40: Mexico Market Size (US$ Million) and Volume (Units) Forecast by Portability Type, 2014 to 2029

Table 41: Mexico Market Size (US$ Million) and Volume (Units) Forecast by Application, 2014 to 2029

Table 42: Mexico Market Size (US$ Million) and Volume (Units) Forecast by End-Use, 2014 to 2029

List of Figures

Figure 01: Global Market Volume (Units) and Y-o-Y Growth Rate from 2022 to 2029

Figure 02: Global Market Value (US$ Million) and Y-o-Y Growth Rate from 2022 to 2029

Figure 03: Global Market Absolute $ Opportunity Analysis, 2022 to 2029

Figure 04: Global Market Share and BPS Analysis by Portability Type, 2022 & 2029

Figure 05: Global Market Y-o-Y Growth by Portability Type, 2021 to 2029

Figure 06: Global Market Attractiveness Analysis by Portability Type, 2022 to 2029

Figure 07: Global Market Absolute $ Opportunity by Handheld Portability Type Segment, 2022 to 2029

Figure 08: Global Market Absolute $ Opportunity by Stationary Portability Type Segment, 2022 to 2029

Figure 09: Global Market Share and BPS Analysis by Application, 2022 & 2029

Figure 10: Global Market Y-o-Y Growth by Application, 2021 to 2029

Figure 11: Global Market Attractiveness Analysis by Application, 2022 to 2029

Figure 12: Global Market Absolute $ Opportunity by On-Field Application Segment, 2022 to 2029

Figure 13: Global Market Absolute $ Opportunity by Off-Field Application Segment, 2022 to 2029

Figure 14: Global Market Share and BPS Analysis by End-Use, 2022 & 2029

Figure 15: Global Market Y-o-Y Growth by End-Use, 2021 to 2029

Figure 16: Global Market Attractiveness Analysis by End-Use, 2022 to 2029

Figure 17: Global Market Absolute $ Opportunity by Wastewater Treatment End-Use Segment, 2022 to 2029

Figure 18: Global Market Absolute $ Opportunity by Chemical & Materials End-Use Segment, 2022 to 2029

Figure 19: Global Market Absolute $ Opportunity by Oil & Gas End-Use Segment, 2022 to 2029

Figure 20: Global Market Absolute $ Opportunity by Pharmaceutical End-Use Segment, 2022 to 2029

Figure 21: Global Market Absolute $ Opportunity by Pulp & Paper End-Use Segment, 2022 to 2029

Figure 22: Global Market Absolute $ Opportunity by Food & Beverages End-Use Segment, 2022 to 2029

Figure 23: Global Market Absolute $ Opportunity by Research & Academia End-Use Segment, 2022 to 2029

Figure 24: Global Market Absolute $ Opportunity by Others End-Use Segment, 2022 to 2029

Figure 25: Global Market Share and BPS Analysis by Region, 2022 & 2029

Figure 26: Global Market Y-o-Y Growth by Region, 2021 to 2029

Figure 27: Global Market Attractiveness Analysis by Region, 2022 to 2029

Figure 28: Global Market Absolute $ Opportunity by North America Region Segment, 2022 to 2029

Figure 29: Global Market Absolute $ Opportunity by Latin America Region Segment, 2022 to 2029

Figure 30: Global Market Absolute $ Opportunity by Europe Region Segment, 2022 to 2029

Figure 31: Global Market Absolute $ Opportunity by South Asia Region Segment, 2022 to 2029

Figure 32: Global Market Absolute $ Opportunity by East Asia Region Segment, 2022 to 2029

Figure 33: Global Market Absolute $ Opportunity by Oceania Region Segment, 2022 to 2029

Figure 34: Global Market Absolute $ Opportunity by Middle East & Africa Region Segment, 2022 to 2029

Figure 35: North America Market Share and BPS Analysis by Country, 2022 & 2029

Figure 36: North America Market Y-o-Y Growth by Country, 2021 to 2029

Figure 37: North America Market Attractiveness Analysis by Country, 2022 to 2029

Figure 38: U.S. Market Absolute $ Opportunity, 2022 to 2029

Figure 39: Canada Market Absolute $ Opportunity, 2022 to 2029

Figure 40: North America Market Share and BPS Analysis by Portability Type, 2022 & 2029

Figure 41: North America Market Y-o-Y Growth by Portability Type, 2021 to 2029

Figure 42: North America Market Attractiveness Analysis by Portability Type, 2022 to 2029

Figure 43: North America Market Share and BPS Analysis by Application, 2022 & 2029

Figure 44: North America Market Y-o-Y Growth by Application, 2021 to 2029

Figure 45: North America Market Attractiveness Analysis by Application, 2022 to 2029

Figure 46: North America Market Share and BPS Analysis by End-Use, 2022 & 2029

Figure 47: North America Market Y-o-Y Growth by End-Use, 2021 to 2029

Figure 48: North America Market Attractiveness Analysis by End-Use, 2022 to 2029

Figure 49: Latin America Market Share and BPS Analysis by Country, 2022 & 2029

Figure 50: Latin America Market Y-o-Y Growth by Country, 2021 to 2029

Figure 51: Latin America Market Attractiveness Analysis by Country, 2022 to 2029

Figure 52: Brazil Market Absolute $ Opportunity, 2022 to 2029

Figure 53: Mexico Market Absolute $ Opportunity, 2022 to 2029

Figure 54: Rest of Latin America Market Absolute $ Opportunity, 2022 to 2029

Figure 55: Latin America Market Share and BPS Analysis by Portability Type, 2022 & 2029

Figure 56: Latin America Market Y-o-Y Growth by Portability Type, 2021 to 2029

Figure 57: Latin America Market Attractiveness Analysis by Portability Type, 2022 to 2029

Figure 58: Latin America Market Share and BPS Analysis by Application, 2022 & 2029

Figure 59: Latin America Market Y-o-Y Growth by Application, 2021 to 2029

Figure 60: Latin America Market Attractiveness Analysis by Application, 2022 to 2029

Figure 61: Latin America Market Share and BPS Analysis by End-Use, 2022 & 2029

Figure 62: Latin America Market Y-o-Y Growth by End-Use, 2021 to 2029

Figure 63: Latin America Market Attractiveness Analysis by End-Use, 2022 to 2029

Figure 64: Europe Market Share and BPS Analysis by Country, 2022 & 2029

Figure 65: Europe Market Y-o-Y Growth by Country, 2021 to 2029

Figure 66: Europe Market Attractiveness Analysis by Country, 2022 to 2029

Figure 67: Germany Market Absolute $ Opportunity, 2022 to 2029

Figure 68: Italy Market Absolute $ Opportunity, 2022 to 2029

Figure 69: France Market Absolute $ Opportunity, 2022 to 2029

Figure 70: U.K. Market Absolute $ Opportunity, 2022 to 2029

Figure 71: Italy Market Absolute $ Opportunity, 2022 to 2029

Figure 72: Russia Market Absolute $ Opportunity, 2022 to 2029

Figure 73: Russia Market Absolute $ Opportunity, 2022 to 2029

Figure 74: Rest of Europe Market Absolute $ Opportunity, 2022 to 2029

Figure 75: Europe Market Share and BPS Analysis by Portability Type, 2022 & 2029

Figure 76: Europe Market Y-o-Y Growth by Portability Type, 2021 to 2029

Figure 77: Europe Market Attractiveness Analysis by Portability Type, 2022 to 2029

Figure 78: Europe Market Share and BPS Analysis by Application, 2022 & 2029

Figure 79: Europe Market Y-o-Y Growth by Application, 2021 to 2029

Figure 80: Europe Market Attractiveness Analysis by Application, 2022 to 2029

Figure 81: Europe Market Share and BPS Analysis by End-Use, 2022 & 2029

Figure 82: Europe Market Y-o-Y Growth by End-Use, 2021 to 2029

Figure 83: Europe Market Attractiveness Analysis by End-Use, 2022 to 2029

Figure 84: South Asia Market Share and BPS Analysis by Country, 2022 & 2029

Figure 85: South Asia Market Y-o-Y Growth by Country, 2021 to 2029

Figure 86: South Asia Market Attractiveness Analysis by Country, 2022 to 2029

Figure 87: India Market Absolute $ Opportunity, 2022 to 2029

Figure 88: Thailand Market Absolute $ Opportunity, 2022 to 2029

Figure 89: Indonesia Market Absolute $ Opportunity, 2022 to 2029

Figure 90: Malaysia Market Absolute $ Opportunity, 2022 to 2029

Figure 91: Rest of South Asia Market Absolute $ Opportunity, 2022 to 2029

Figure 92: South Asia Market Share and BPS Analysis by Portability Type, 2022 & 2029

Figure 93: South Asia Market Y-o-Y Growth by Portability Type, 2021 to 2029

Figure 94: South Asia Market Attractiveness Analysis by Portability Type, 2022 to 2029

Figure 95: South Asia Market Share and BPS Analysis by Application, 2022 & 2029

Figure 96: South Asia Market Y-o-Y Growth by Application, 2021 to 2029

Figure 97: South Asia Market Attractiveness Analysis by Application, 2022 to 2029

Figure 98: South Asia Market Share and BPS Analysis by End-Use, 2022 & 2029

Figure 99: South Asia Market Y-o-Y Growth by End-Use, 2021 to 2029

Figure 100: South Asia Market Attractiveness Analysis by End-Use, 2022 to 2029

Figure 101: East Asia Market Share and BPS Analysis by Country, 2022 & 2029

Figure 102: East Asia Market Y-o-Y Growth by Country, 2021 to 2029

Figure 103: East Asia Market Attractiveness Analysis by Country, 2022 to 2029

Figure 104: China Market Absolute $ Opportunity, 2022 to 2029

Figure 105: Japan Market Absolute $ Opportunity, 2022 to 2029

Figure 106: South Korea Market Absolute $ Opportunity, 2022 to 2029

Figure 107: East Asia Market Share and BPS Analysis by Portability Type, 2022 & 2029

Figure 108: East Asia Market Y-o-Y Growth by Portability Type, 2021 to 2029

Figure 109: East Asia Market Attractiveness Analysis by Portability Type, 2022 to 2029

Figure 110: East Asia Market Share and BPS Analysis by Application, 2022 & 2029

Figure 111: East Asia Market Y-o-Y Growth by Application, 2021 to 2029

Figure 112: East Asia Market Attractiveness Analysis by Application, 2022 to 2029

Figure 113: East Asia Market Share and BPS Analysis by End-Use, 2022 & 2029

Figure 114: East Asia Market Y-o-Y Growth by End-Use, 2021 to 2029

Figure 115: East Asia Market Attractiveness Analysis by End-Use, 2022 to 2029

Figure 116: Oceania Market Share and BPS Analysis by Country, 2022 & 2029

Figure 117: Oceania Market Y-o-Y Growth by Country, 2021 to 2029

Figure 118: Oceania Market Attractiveness Analysis by Country, 2022 to 2029

Figure 119: Australia Market Absolute $ Opportunity, 2022 to 2029

Figure 120: New Zealand Market Absolute $ Opportunity, 2022 to 2029

Figure 121: Oceania Market Share and BPS Analysis by Portability Type, 2022 & 2029

Figure 122: Oceania Market Y-o-Y Growth by Portability Type, 2021 to 2029

Figure 123: Oceania Market Attractiveness Analysis by Portability Type, 2022 to 2029

Figure 124: Oceania Market Share and BPS Analysis by Application, 2022 & 2029

Figure 125: Oceania Market Y-o-Y Growth by Application, 2021 to 2029

Figure 126: Oceania Market Attractiveness Analysis by Application, 2022 to 2029

Figure 127: Oceania Market Share and BPS Analysis by End-Use, 2022 & 2029

Figure 128: Oceania Market Y-o-Y Growth by End-Use, 2022 to 2029

Figure 129: Oceania Market Attractiveness Analysis by End-Use, 2022 to 2029

Figure 130: Middle East & Africa Market Share and BPS Analysis by Country, 2022 & 2029

Figure 131: Middle East & Africa Market Y-o-Y Growth by Country, 2021 to 2029

Figure 132: Middle East & Africa Market Attractiveness Analysis by Country, 2022 to 2029

Figure 133: GCC Countries Market Absolute $ Opportunity, 2022 to 2029

Figure 134: Turkey Market Absolute $ Opportunity, 2022 to 2029

Figure 135: North Africa Market Absolute $ Opportunity, 2022 to 2029

Figure 136: South Africa Market Absolute $ Opportunity, 2022 to 2029

Figure 137: Rest of MEA Market Absolute $ Opportunity, 2022 to 2029

Figure 138: Middle East & Africa Market Share and BPS Analysis by Portability Type, 2022 & 2029

Figure 139: Middle East & Africa Market Y-o-Y Growth by Portability Type, 2021 to 2029

Figure 140: Middle East & Africa Market Attractiveness Analysis by Portability Type, 2022 to 2029

Figure 141: Middle East & Africa Market Share and BPS Analysis by Application, 2022 & 2029

Figure 142: Middle East & Africa Market Y-o-Y Growth by Application, 2021 to 2029

Figure 143: Middle East & Africa Market Attractiveness Analysis by Application, 2022 to 2029

Figure 144: Middle East & Africa Market Share and BPS Analysis by End-Use, 2022 & 2029

Figure 145: Middle East & Africa Market Y-o-Y Growth by End-Use, 2021 to 2029

Figure 146: Middle East & Africa Market Attractiveness Analysis by End-Use, 2022 to 2029

Figure 147: Global Market Value Share by Region, 2022

Figure 148: Emerging Markets Market Value Share by Country, 2022

Figure 149: Global and Emerging Countries Market Value Share, 2022

Figure 150: Global and Emerging Countries Market Value Y-o-Y Growth Projections, 2022

Figure 151: India Market Share and BPS Analysis by Portability Type, 2022 & 2029

Figure 152: India Market Y-o-Y Growth by Portability Type, 2021 to 2029

Figure 153: India Market Attractiveness Analysis by Portability Type, 2022 to 2029

Figure 154: India Market Share and BPS Analysis by Application, 2022 & 2029

Figure 155: India Market Y-o-Y Growth by Application, 2021 to 2029

Figure 156: India Market Attractiveness Analysis by Application, 2022 to 2029

Figure 157: India Market Share and BPS Analysis by End-Use, 2022 & 2029

Figure 158: India Market Y-o-Y Growth by End-Use, 2021 to 2029

Figure 159: India Market Attractiveness Analysis by End-Use, 2022 to 2029

Figure 160: GCC Countries Market Share and BPS Analysis by Portability Type, 2022 & 2029

Figure 161: GCC Countries Market Y-o-Y Growth by Portability Type, 2021 to 2029

Figure 162: GCC Countries Market Attractiveness Analysis by Portability Type, 2022 to 2029

Figure 163: GCC Countries Market Share and BPS Analysis by Application, 2022 & 2029

Figure 164: GCC Countries Market Y-o-Y Growth by Application, 2021 to 2029

Figure 165: GCC Countries Market Attractiveness Analysis by Application, 2022 to 2029

Figure 166: GCC Countries Market Share and BPS Analysis by End-Use, 2022 & 2029

Figure 167: GCC Countries Market Y-o-Y Growth by End-Use, 2021 to 2029

Figure 168: GCC Countries Market Attractiveness Analysis by End-Use, 2022 to 2029

Figure 169: Mexico Market Share and BPS Analysis by Portability Type, 2022 & 2029

Figure 170: Mexico Market Y-o-Y Growth by Portability Type, 2021 to 2029

Figure 171: Mexico Market Attractiveness Analysis by Portability Type, 2022 to 2029

Figure 172: Mexico Market Share and BPS Analysis by Application, 2022 & 2029

Figure 173: Mexico Market Y-o-Y Growth by Application, 2021 to 2029

Figure 174: Mexico Market Attractiveness Analysis by Application, 2022 to 2029

Figure 175: Mexico Market Share and BPS Analysis by End-Use, 2022 & 2029

Figure 176: Mexico Market Y-o-Y Growth by End-Use, 2021 to 2029

Figure 177: Mexico Market Attractiveness Analysis by End-Use, 2022 to 2029

Frequently Asked Questions

What was the overall size of the Turbidimeter Market in 2025?

The overall market size for the Turbidimeter Market was approximately USD 656.9 million in 2025.

How big is the Turbidimeter Market expected to be in 2035?

The Turbidimeter Market is expected to reach around USD 926.7 Million By 2035.

What will drive the demand for the Turbidimeter Market during the forecast period?

The demand is driven by increasing awareness about water quality, stringent government regulations regarding environmental monitoring, and the expansion of industries.

List the top 5 regions contributing to the Turbidimeter Market.

The top 5 regions driving market growth are USA, UK, Europe, Japan, and South Korea.

Which segment in application is expected to lead in the Turbidimeter Market?

The wastewater treatment segment is expected to command a significant share over the assessment period.

Future Market Insights

Turbidimeter Market