Vein Finder Market Size and Share Forecast Outlook 2025 to 2035

The vein finder market is valued at USD 38.78 million in 2025 and is slated to reach USD 54.18 million by 2035, which shows a CAGR of 3.4%. The increasing demand for non-invasive, accurate, and quick solutions for locating veins is driving market growth.
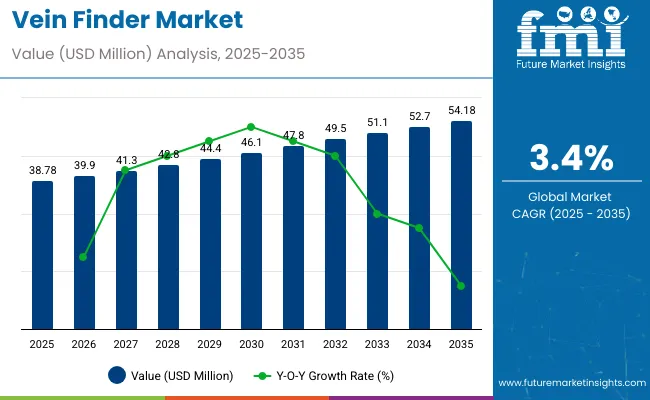
Quick Stats of Vein Finder Market

  • Market Value (2025): USD 38.78 million
  • Forecast Value (2035): USD 54.18 million
  • Forecast CAGR: 3.4%
  • Leading Product Type Segment: Portable Devices (55.3% share)
  • Key Growth Region: Asia Pacific (China-7% CAGR)
  • Key Players: VeinVision, AccuVein, Christie Medical Holdings, Infrared Imaging Systems, and others

Vein finders are crucial in medical procedures, particularly in intravenous (IV) therapy, blood draws, and dialysis, where precision is paramount. As healthcare systems strive for improved patient care, the adoption of vein finding technology is increasing, especially in regions with a high incidence of chronic diseases and an aging population requiring frequent medical procedures.

Technological advancements in vein finder devices are a major factor propelling the market forward. The development of infrared-based devices, ultrasound, and near-infrared spectroscopy technologies has enhanced the precision and effectiveness of vein finders, making them more reliable and user-friendly.

Additionally, these devices are being integrated with artificial intelligence (AI) and machine learning to improve their ability to detect veins in patients with difficult-to-locate veins. These innovations are expected to improve the speed and accuracy of vein localization, reducing the risk of complications during procedures and enhancing overall patient satisfaction.

Government regulations and healthcare policies are further supporting market growth, as many countries are increasingly focusing on improving healthcare quality and patient safety. These regulations encourage the use of advanced medical technologies, including vein finders, to enhance care standards.

As healthcare providers continue to prioritize efficiency, accuracy, and patient comfort, the adoption of vein finder devices is expected to increase, contributing to the steady growth of the market. The growing focus on reducing medical errors and improving procedural outcomes also positions vein finding technologies as a critical tool in modern healthcare systems.

Analyzing Vein Finder Market by Top Investment Segments

The market is segmented based on product type, technology, end user, and region. By product type, the market is divided into portable and benchtop devices. In terms of technology, the market is categorized into infrared, ultrasound, and transillumination.

Based on end user, the market is classified into hospitals, clinics, ambulatory surgical centers, diagnostic centers and path labs, and blood banks. Regionally, the market is segmented into North America, Latin America, East Asia, South Asia & Pacific, Western Europe, Eastern Europe, and Middle East & Africa.
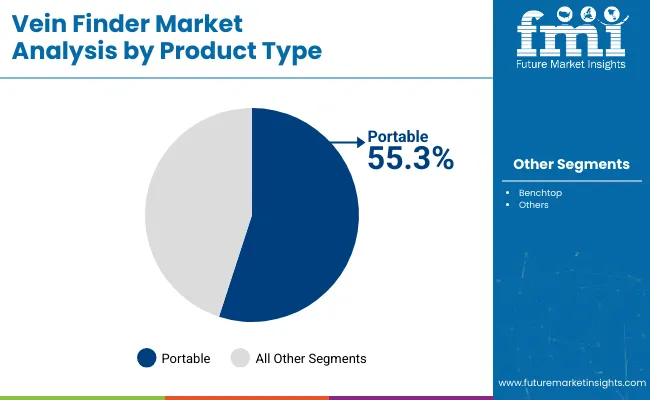
By Product Type, Portable to Capture 55.3% Market Share in 2025

The portable product type is expected to capture 55.3% of the market share in 2025. Portable devices are highly favored due to their mobility, versatility, and adaptability across various healthcare settings. Their compact nature allows them to be easily transported and used in point-of-care diagnostics, emergency medical situations, and remote healthcare environments, making them essential in modern healthcare.

With the rise in demand for home healthcare services and at-home diagnostics, the portable segment is expected to experience significant growth. These devices offer convenience for both patients and healthcare providers, allowing medical tests and monitoring to take place outside of traditional clinical settings.

The affordability and ease of use also contribute to the increasing adoption of portable devices, especially in ambulatory surgical centers, clinics, and blood banks. As the healthcare industry continues to emphasize cost-effective, flexible, and patient-centric solutions, portable devices are anticipated to remain a dominant product type in the market. The trend toward home-based healthcare services and the need for point-of-care diagnostics are expected to drive further growth in this segment throughout the forecast period.

Product Type Segment Market Share (2025)
Portable 55.3%

By Technology, Infrared to Witness a CAGR of 6.7% from 2025 to 2035

Infrared technology is projected to experience a CAGR of 6.7% from 2025 to 2035, driven by its wide-ranging applications in medical diagnostics. Infrared technology is most commonly used for non-invasive temperature measurement, thermography, and blood circulation monitoring, offering healthcare providers a reliable, quick, and accurate diagnostic tool.

The increasing demand for non-invasive and patient-friendly medical technologies is supporting the adoption of infrared technology, particularly in thermometers and imaging devices. Its ability to provide fast results with minimal discomfort has made infrared technology an essential component in both clinical and home healthcare environments.

Infrared devices are used extensively in hospitals, clinics, and diagnostic centers due to their precision and ease of integration into existing healthcare workflows. The growing demand for wearable health monitors and the rise in remote patient monitoring are also contributing to the growth of infrared technology in medical diagnostics.

As healthcare providers continue to focus on improving the quality and speed of diagnosis while reducing costs, infrared technology’s non-invasive nature and rapid diagnostics will drive its significant growth in the coming years, particularly in temperature screening and monitoring applications.
Technology Segment CAGR (2025 to 2035)
Infrared 6.7%

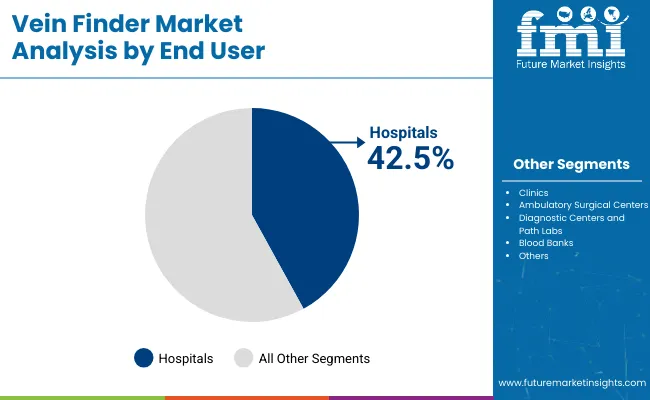
By End User, Hospitals to Dominate with a Market Share of 42.5% in 2025

Hospitals are expected to dominate the end-user segment, capturing 42.5% of the market share in 2025. As the largest consumers of medical diagnostic equipment, hospitals rely on a wide array of diagnostic tools for patient care, emergency services, and various medical procedures.

The growing need for advanced diagnostic solutions in hospitals is driven by the rising number of patients, the increasing complexity of treatments, and the growing demand for more accurate and timely diagnoses. Technologies such as infrared, ultrasound, and transillumination are integral to many hospital departments, including emergency rooms, intensive care units, and outpatient care facilities, providing healthcare professionals with the tools to detect diseases, monitor patient conditions, and guide treatment decisions.

Additionally, hospitals are increasingly adopting portable and user-friendly diagnostic devices that improve patient access to care, especially in critical and emergency situations. With ongoing investments in healthcare infrastructure, digital health technologies, and the expansion of hospital networks, the hospital sector is expected to remain the dominant end-user segment for diagnostic equipment.

The need for accurate, reliable, and non-invasive diagnostic solutions will continue to drive the growth of hospitals as a key market segment throughout the forecast period.

End User Segment Market Share (2025)
Hospitals 42.5%

Vein Finder Market Overview

Vein finders are becoming essential devices in the healthcare industry. These advanced devices are intended to improve patient care by assisting physicians in venipuncture. Growing adoption of these vein finder devices in a variety of healthcare settings is expected to boost market growth.

Vein finders are becoming critical in several tasks, including starting intravenous lines, locating veins for injections, and drawing blood. Increasing adoption of vein finders in these procedures is expected to boost growth of the vein finder market.

Growing number of surgical procedures globally necessitates accurate venous access for blood sampling, intravenous injections, and other medical procedures. This will continue to propel demand for vein finders.

Rising emphasis on improving patient safety and comfort is expected to fuel sales of vein finders during the forecast period. These vein detection devices help ensure successful first attempts at venipuncture while reducing the number of needle sticks.

Portable vein finders are witnessing higher demand globally due to their small size and easy maneuverability. They are easy for physicians to work with in various clinical settings. Portable vein finders are also ideal for delivering at-home care to the patient.

An increasing shift towards the integration of advanced technologies such as augmented reality and near-infrared spectroscopy in vein finder devices enhances their accuracy and depth of vein detection. This, in turn, is affecting the vein locator market constructively.

Top vein finder manufacturers are constantly looking to develop advanced solutions to boost their sales. This technological evolution is driven by the pursuit of more effective and user-friendly solutions for healthcare professionals.

There has also been a growing emphasis on patient-centric features in vein finder development. Manufacturers are incorporating features that enhance patient comfort during venipuncture, contributing to a positive healthcare experience.

The ongoing trends collectively reflect the market's commitment to technological innovation, adaptability to diverse healthcare settings, and a patient-centered approach to advancing vein finder technologies. As a result, a healthy CAGR has been predicted for the target industry.

Historical Performance Vs. Vein Finder Market Future Demand Outlook

Global sales of vein finders increased at a CAGR of 4.8% from 2020 to 2024. In the assessment period, the global vein finder industry is poised to grow at a CAGR of 3.4%.

Chronic diseases such as diabetes, cardiovascular disorders, and renal diseases have become increasingly prevalent on a global scale. This surge in chronic illnesses is increasing the demand for medical procedures that require accurate and efficient vein visualization. This makes vein finders an indispensable tool in contemporary healthcare settings.

Rising geriatric population globally is expected to propel vein finder demand during the forecast period. Due to aging, older people often suffer from conditions like poor venous access, creating need for vein finder devices.

According to the Journal of Frontiers in Public Health, the population of people above 50 years old in the United States is expected to rise by 61.11%, increasing from 137.25 million in 2020 to 221.13 million in 2050. Among this population group, the number of people having at least one chronic disease is estimated to increase to 142.66 million in 2050. This will positively impact vein finder sales.

Amid rising geriatric population and rising prevalence of chronic diseases, healthcare providers face an increasing need for tools that enhance the success rates of medical interventions. Modern vein finders address this need by offering healthcare professionals a reliable means to visualize veins.

Key Opportunities in the Vein Finder Market

Vein finders are increasingly used for intravenous nutritional support, intravenous fluid administration, and intravenous drug administration. Similarly, they find application in intravenous chemotherapy administration and parenteral nutrition, thereby driving their demand.

Due to their increasing application in IV procedures, demand for vein finders is expected to grow rapidly during the forecast period. Vein finders are also used in vascular procedures, dialysis, and cosmetic procedures, contributing to their higher sales.

Increasing usage of vein finders in procedures such as cosmetic makeovers is expected to support market growth over the forecast period. Vein finders help in locating veins before, during, and after cosmetic and vascular procedures. They also help to prevent severe bruising and vein damage during cosmetic procedures.

Vein finders have traditionally been used in healthcare settings for purposes such as IV access, blood draws, and other medical procedures. However, in recent years, there has been an increasing trend toward the use of vein finders in the cosmetic industry as well. This will likely create growth opportunities for vein finder manufacturers.

Factors Limiting Vein Finder Market Growth

Despite the significant opportunity for vein finder industry, the high cost of vein finders acts as a restraint for the market, particularly in lower economic regions. Advanced vein finder devices, especially benchtop ones, are expensive, which negatively impacts their sales.

Lack of knowledge and experience in operating a vein finder can lead to complicated intravenous (IV) procedures that are uncomfortable for the patient. In addition, improper use of the vein finder may cause unnecessary bruising, damage to the vein, or other complications.

Patients who have had negative experiences with IV procedures, such as repeated needle sticks or multiple IV insertion attempts, may be reluctant to undergo the procedure again. Consequently, medical professionals may be less inclined to use a vein finder if they are unsure whether they can use it effectively.

If medical professionals are not properly trained in using a vein finder, they may not recognize the device's value or be aware of its benefits. This may result in low demand for vein finders, as medical professionals are more likely to use traditional, more familiar methods of locating veins, such as palpation or visualization.

Country-wise Insights

The table below shows the predicted growth rates of the top nations. China, France, and Japan are anticipated to record high CAGRs of 7.0%, 2.6%, and 2.1%, respectively from 2025 to 2035.
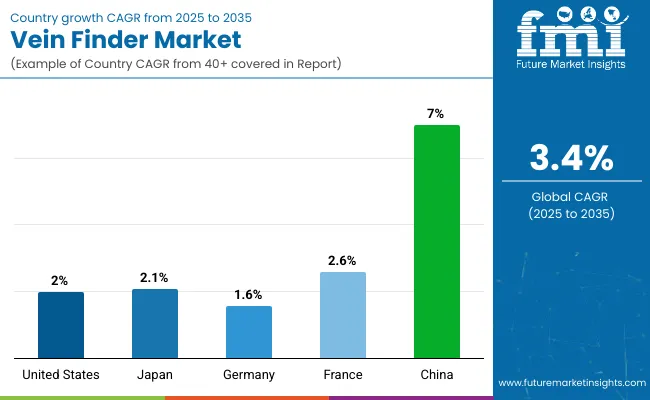
Market Growth Outlook by Key Countries

Countries Value CAGR
United States 2%
Japan 2.1%
Germany 1.6%
France 2.6%
China 7%

United States Remains a Key Market for Vein Finders Globally

As per the latest analysis, the United States accounted for a dominant global market share of 34.2% in 2024. Over the forecast period, the United States vein finder market is expected to exhibit a CAGR of 2.0%.

The United States has a well-established healthcare infrastructure, which contributes to the growing demand for vein finders. Advanced healthcare facilities and a strong emphasis on medical innovation contribute to the widespread integration of vein finder technologies within the nation.

Growing prevalence of chronic diseases, such as diabetes and cardiovascular conditions, in the United States is creating a substantial demand for precise vein visualization in various procedures. This will likely foster growth of the vein finder industry from 2025 to 2035.

Substantial investment has been made in state-of-the-art medical technologies, including vein finders, in the United States. The nation's regulatory environment is conducive to the approval and adoption of innovative healthcare devices, further solidifying its position as a dominating region in the vein finder industry.

Increasing Geriatric Population Propelling Vein Find Demand in Japan

Japan remains a lucrative market for vein finder manufacturers across East Asia. As per the latest report, demand for vein finders in Japan is anticipated to increase at a CAGR of 2.1% throughout the forecast period.

The geriatric population in Japan has significantly increased, which has led to the adoption of vein finders. The increasing prevalence of chronic diseases necessitates precise venipuncture, further augmenting the market.

The above factors coupled with strong regulatory framework are expected to boost Japan vein finder market during the forecast period. Similarly, a culture of early adoption of healthcare innovations will likely support market expansion.
Competitive Landscape

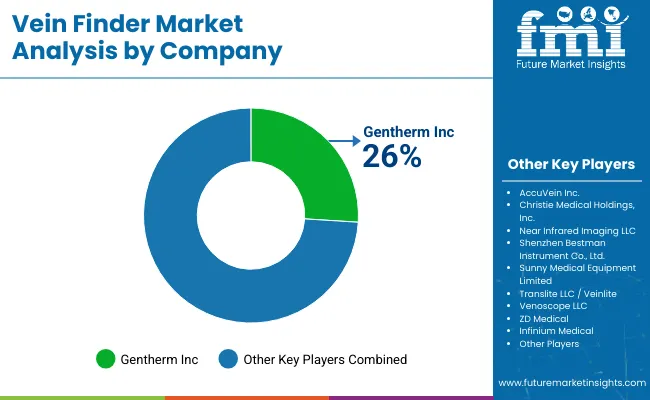
Leading manufacturers of vein finders are constantly developing innovative products to meet the evolving end user requirements. They are focusing on enhancing vein visualization through advancements in near-infrared (NIR) and exploring novel techniques like electrical impedance or ultrasound.

For instance, players like Christie Medical Holdings, Shenzhen Bestman Instrument, and AccuVein are developing new vein finders that use improved visualization technologies. Similarly, companies are employing strategies like partnerships, mergers, acquisitions, distribution agreements, and collaborations to gain a competitive edge in the market.

Recent Developments in the Vein Finder Market

  • In June 2023, Merz Aesthetics, the leading medical aesthetics business globally, and AccuVein entered an exclusive partnership. This collaboration grants Merz Aesthetics exclusive rights as the sole authorized distributor of AccuVein's vein visualization system in the aesthetics market of the United States.
  • In 2023, Christie Medical Holdings, Inc. partnered with DO-PA A.S. for Turkish distribution of Christie's United States-made VeinViewer Vision2 and VeinViewer® Flex. DO-PA A.S. is one of the oldest medical distribution companies in Türkiye.

Key Coverage in Global Vein Finder Market Research Report

  • Adjacent Study on Global Varicose Vein Treatment Market, Peripheral Intravenous Catheters Market, Vein Illuminator Market, Palm Vein Scanner market, and Near-infrared Vein Finder Market
  • Detailed Portable Vein Finder Market Overview
  • Future Growth Prospects of Global Portable Vein Finder Market
  • Key Players in the Vein Detection Technology Market
  • Regional Analysis of Vein Visualization Device Industry
  • Scope of Blood Vessel Imaging Device Market in India and other Emerging Nations
  • Market Dynamics of Vein Detection Technology
  • Emerging Trends in Vein Imaging Devices
  • Recent Developments in Vein Imaging Device Market
  • Drivers for Vein Detection System Market
  • Top Segments in Vein Mapping Technology Market

Key Players in the Vein Finder Market

  • AccuVein Inc.
  • Christie Medical Holdings, Inc.
  • Near Infrared Imaging LLC
  • Shenzhen Bestman Instrument Co., Ltd.
  • Gentherm Inc.
  • Sunny Medical Equipment Limited
  • Translite LLC / Veinlite
  • Venoscope LLC
  • ZD Medical
  • Infinium Medical
  • NextVein
  • International Biomedical
  • Shenzhen Vivolight Medical Device & Technology Co., Ltd.
  • BLZ Technology Inc.
  • iiSM Inc.

Key Segmentation

By Product Type:

  • Portable
  • Benchtop

By Technology:

  • Infrared
  • Ultrasound
  • Transillumination

By End-user:

  • Hospitals
  • Clinics
  • Ambulatory Surgical Centers
  • Diagnostic Centers and Path Labs
  • Blood Banks

By Region:

  • North America
  • Latin America
  • East Asia
  • South Asia & Pacific
  • Western Europe
  • Eastern Europe
  • Middle East & Africa

Table of Content

  • 1. Executive Summary
  • 2. Market Overview
  • 3. Key Market Trends
  • 4. Value-Added Insights
  • 5. Market Background
  • 6. Global Market Demand (in Volume Units) Analysis 2020 to 2024 and Forecast, 2025 to 2035
  • 7. Global Market - Pricing Analysis
  • 8. Global Market Demand (in Value or Size in USD million) Analysis 2020 to 2024 and Forecast, 2025 to 2035
  • 9. Global Market Analysis 2020 to 2024 and Forecast 2025 to 2035, By Product Type
    • 9.1. Portable
    • 9.2. Benchtop
  • 10. Global Market Analysis 2020 to 2024 and Forecast 2025 to 2035, By Technology
    • 10.1. Infrared
    • 10.2. Ultrasound
    • 10.3. Transillumination
  • 11. Global Market Analysis 2020 to 2024 and Forecast 2025 to 2035, By End User
    • 11.1. Hospitals
    • 11.2. Clinics
    • 11.3. Ambulatory Surgical Centers
    • 11.4. Diagnostic Centers and Path Labs
    • 11.5. Blood Banks
  • 12. Global Market Analysis 2020 to 2024 and Forecast 2025 to 2035, By Region
    • 12.1. North America
    • 12.2. Latin America
    • 12.3. East Asia
    • 12.4. South Asia & Pacific
    • 12.5. Western Europe
    • 12.6. Eastern Europe
    • 12.7. Middle East & Africa
  • 13. North America Market Analysis 2020 to 2024 and Forecast 2025 to 2035
  • 14. Latin America Market Analysis 2020 to 2024 and Forecast 2025 to 2035
  • 15. East Asia Market Analysis 2020 to 2024 and Forecast 2025 to 2035
  • 16. South Asia & Pacific Market Analysis 2020 to 2024 and Forecast 2025 to 2035
  • 17. Western Europe Market Analysis 2020 to 2024 and Forecast 2025 to 2035
  • 18. Eastern Europe Market Analysis 2020 to 2024 and Forecast 2025 to 2035
  • 19. Middle East & Africa Market Analysis 2020 to 2024 and Forecast 2025 to 2035
  • 20. Market Structure Analysis
  • 21. Competition Analysis
    • 21.1. AccuVein Inc.
    • 21.2. Christie Medical Holdings, Inc.
    • 21.3. Near Infrared Imaging LLC
    • 21.4. Shenzhen Bestman Instrument Co., Ltd.
    • 21.5. Gentherm Inc.
    • 21.6. Sunny Medical Equipment Limited
    • 21.7. Translite LLC / Veinlite
    • 21.8. Venoscope LLC
    • 21.9. ZD Medical
    • 21.10. Infinium Medical
    • 21.11. NextVein
    • 21.12. International Biomedical
    • 21.13. Shenzhen Vivolight Medical Device & Technology Co., Ltd.
    • 21.14. BLZ Technology Inc.
    • 21.15. iiSM Inc.
  • 22. Assumptions and Acronyms Used
  • 23. Research Methodology

List of Tables

  • Table 1: Global Market Volume (Units) Analysis 2020 to 2024 and Forecast 2025 to 2035, by Product Type
  • Table 2: Global Market Size (USD million) Analysis 2020 to 2024 and Forecast 2025 to 2035, by Product Type
  • Table 3: Global Market Size (USD million) Analysis 2020 to 2024 and Forecast 2025 to 2035, by Technology
  • Table 4: Global Market Size (USD million) Analysis 2020 to 2024 and Forecast 2025 to 2035, by End User
  • Table 5: Global Market Size (USD million) Analysis 2020 to 2024 and Forecast 2025 to 2035, by Region
  • Table 6: North America Market Size (USD million) Analysis 2020 to 2024 and Forecast 2025 to 2035, by Country
  • Table 7: North America Market Volume (Units) Analysis 2020 to 2024 and Forecast 2025 to 2035, by Product Type
  • Table 8: North America Market Size (USD million) Analysis 2020 to 2024 and Forecast 2025 to 2035, by Product Type
  • Table 9: North America Market Size (USD million) Analysis 2020 to 2024 and Forecast 2025 to 2035, by Technology
  • Table 10: North America Market Size (USD million) Analysis 2020 to 2024 and Forecast 2025 to 2035, by End User
  • Table 11: United States Market Size (USD million) Analysis 2020 to 2024 and Forecast 2025 to 2035, by Product Type
  • Table 12: United States Market Size (USD million) Analysis 2020 to 2024 and Forecast 2025 to 2035, by Technology
  • Table 13: United States Market Size (USD million) Analysis 2020 to 2024 and Forecast 2025 to 2035, by End User
  • Table 14: Canada Market Size (USD million) Analysis 2020 to 2024 and Forecast 2025 to 2035, by Product Type
  • Table 15: Canada Market Size (USD million) Analysis 2020 to 2024 and Forecast 2025 to 2035, by Technology
  • Table 16: Canada Market Size (USD million) Analysis 2020 to 2024 and Forecast 2025 to 2035, by End User
  • Table 17: Mexico Market Size (USD million) Analysis 2020 to 2024 and Forecast 2025 to 2035, by Product Type
  • Table 18: Mexico Market Size (USD million) Analysis 2020 to 2024 and Forecast 2025 to 2035, by Technology
  • Table 19: Mexico Market Size (USD million) Analysis 2020 to 2024 and Forecast 2025 to 2035, by End User
  • Table 20: Latin America Market Size (USD million) Analysis 2020 to 2024 and Forecast 2025 to 2035, by Country
  • Table 21: Latin America Market Volume (Units) Analysis 2020 to 2024 and Forecast 2025 to 2035, by Product Type
  • Table 22: Latin America Market Size (USD million) Analysis 2020 to 2024 and Forecast 2025 to 2035, by Product Type
  • Table 23: Latin America Market Size (USD million) Analysis 2020 to 2024 and Forecast 2025 to 2035, by Technology
  • Table 24: Latin America Market Size (USD million) Analysis 2020 to 2024 and Forecast 2025 to 2035, by End User
  • Table 25: Brazil Market Size (USD million) Analysis 2020 to 2024 and Forecast 2025 to 2035, by Product Type
  • Table 26: Brazil Market Size (USD million) Analysis 2020 to 2024 and Forecast 2025 to 2035, by Technology
  • Table 27: Brazil Market Size (USD million) Analysis 2020 to 2024 and Forecast 2025 to 2035, by End User
  • Table 28: Chile Market Size (USD million) Analysis 2020 to 2024 and Forecast 2025 to 2035, by Product Type
  • Table 29: Chile Market Size (USD million) Analysis 2020 to 2024 and Forecast 2025 to 2035, by Technology
  • Table 30: Chile Market Size (USD million) Analysis 2020 to 2024 and Forecast 2025 to 2035, by End User
  • Table 31: East Asia Market Size (USD million) Analysis 2020 to 2024 and Forecast 2025 to 2035, by Country
  • Table 32: East Asia Market Volume (Units) Analysis 2020 to 2024 and Forecast 2025 to 2035, by Product Type
  • Table 33: East Asia Market Size (USD million) Analysis 2020 to 2024 and Forecast 2025 to 2035, by Product Type
  • Table 34: East Asia Market Size (USD million) Analysis 2020 to 2024 and Forecast 2025 to 2035, by Technology
  • Table 35: East Asia Market Size (USD million) Analysis 2020 to 2024 and Forecast 2025 to 2035, by End User
  • Table 36: China Market Size (USD million) Analysis 2020 to 2024 and Forecast 2025 to 2035, by Product Type
  • Table 37: China Market Size (USD million) Analysis 2020 to 2024 and Forecast 2025 to 2035, by Technology
  • Table 38: China Market Size (USD million) Analysis 2020 to 2024 and Forecast 2025 to 2035, by End User
  • Table 39: Japan Market Size (USD million) Analysis 2020 to 2024 and Forecast 2025 to 2035, by Product Type
  • Table 40: Japan Market Size (USD million) Analysis 2020 to 2024 and Forecast 2025 to 2035, by Technology
  • Table 41: Japan Market Size (USD million) Analysis 2020 to 2024 and Forecast 2025 to 2035, by End User
  • Table 42: South Korea Market Size (USD million) Analysis 2020 to 2024 and Forecast 2025 to 2035, by Product Type
  • Table 43: South Korea Market Size (USD million) Analysis 2020 to 2024 and Forecast 2025 to 2035, by Technology
  • Table 44: South Korea Market Size (USD million) Analysis 2020 to 2024 and Forecast 2025 to 2035, by End User
  • Table 45: South Asia and Pacific Market Size (USD million) Analysis 2020 to 2024 and Forecast 2025 to 2035, by Country
  • Table 46: South Asia and Pacific Market Volume (Units) Analysis 2020 to 2024 and Forecast 2025 to 2035, by Product Type
  • Table 47: South Asia and Pacific Market Size (USD million) Analysis 2020 to 2024 and Forecast 2025 to 2035, by Product Type
  • Table 48: South Asia and Pacific Market Size (USD million) Analysis 2020 to 2024 and Forecast 2025 to 2035, by Technology
  • Table 49: South Asia and Pacific Market Size (USD million) Analysis 2020 to 2024 and Forecast 2025 to 2035, by End User
  • Table 50: India Market Size (USD million) Analysis 2020 to 2024 and Forecast 2025 to 2035, by Product Type
  • Table 51: India Market Size (USD million) Analysis 2020 to 2024 and Forecast 2025 to 2035, by Technology
  • Table 52: India Market Size (USD million) Analysis 2020 to 2024 and Forecast 2025 to 2035, by End User
  • Table 53: ASEAN Countries Market Size (USD million) Analysis 2020 to 2024 and Forecast 2025 to 2035, by Product Type
  • Table 54: ASEAN Countries Market Size (USD million) Analysis 2020 to 2024 and Forecast 2025 to 2035, by Technology
  • Table 55: ASEAN Countries Market Size (USD million) Analysis 2020 to 2024 and Forecast 2025 to 2035, by End User
  • Table 56: Australia and New Zealand Market Size (USD million) Analysis 2020 to 2024 and Forecast 2025 to 2035, by Product Type
  • Table 57: Australia and New Zealand Market Size (USD million) Analysis 2020 to 2024 and Forecast 2025 to 2035, by Technology
  • Table 58: Australia and New Zealand Market Size (USD million) Analysis 2020 to 2024 and Forecast 2025 to 2035, by End User
  • Table 59: Western Europe Market Size (USD million) Analysis 2020 to 2024 and Forecast 2025 to 2035, by Country
  • Table 60: Western Europe Market Volume (Units) Analysis 2020 to 2024 and Forecast 2025 to 2035, by Product Type
  • Table 61: Western Europe Market Size (USD million) Analysis 2020 to 2024 and Forecast 2025 to 2035, by Product Type
  • Table 62: Western Europe Market Size (USD million) Analysis 2020 to 2024 and Forecast 2025 to 2035, by Technology
  • Table 63: Western Europe Market Size (USD million) Analysis 2020 to 2024 and Forecast 2025 to 2035, by End User
  • Table 64: Germany Market Size (USD million) Analysis 2020 to 2024 and Forecast 2025 to 2035, by Product Type
  • Table 65: Germany Market Size (USD million) Analysis 2020 to 2024 and Forecast 2025 to 2035, by Technology
  • Table 66: Germany Market Size (USD million) Analysis 2020 to 2024 and Forecast 2025 to 2035, by End User
  • Table 67: Italy Market Size (USD million) Analysis 2020 to 2024 and Forecast 2025 to 2035, by Product Type
  • Table 68: Italy Market Size (USD million) Analysis 2020 to 2024 and Forecast 2025 to 2035, by Technology
  • Table 69: Italy Market Size (USD million) Analysis 2020 to 2024 and Forecast 2025 to 2035, by End User
  • Table 70: France Market Size (USD million) Analysis 2020 to 2024 and Forecast 2025 to 2035, by Product Type
  • Table 71: France Market Size (USD million) Analysis 2020 to 2024 and Forecast 2025 to 2035, by Technology
  • Table 72: France Market Size (USD million) Analysis 2020 to 2024 and Forecast 2025 to 2035, by End User
  • Table 73: United Kingdom Market Size (USD million) Analysis 2020 to 2024 and Forecast 2025 to 2035, by Product Type
  • Table 74: United Kingdom Market Size (USD million) Analysis 2020 to 2024 and Forecast 2025 to 2035, by Technology
  • Table 75: United Kingdom Market Size (USD million) Analysis 2020 to 2024 and Forecast 2025 to 2035, by End User
  • Table 76: Spain Market Size (USD million) Analysis 2020 to 2024 and Forecast 2025 to 2035, by Product Type
  • Table 77: Spain Market Size (USD million) Analysis 2020 to 2024 and Forecast 2025 to 2035, by Technology
  • Table 78: Spain Market Size (USD million) Analysis 2020 to 2024 and Forecast 2025 to 2035, by End User
  • Table 79: BENELUX Market Size (USD million) Analysis 2020 to 2024 and Forecast 2025 to 2035, by Product Type
  • Table 80: BENELUX Market Size (USD million) Analysis 2020 to 2024 and Forecast 2025 to 2035, by Technology
  • Table 81: BENELUX Market Size (USD million) Analysis 2020 to 2024 and Forecast 2025 to 2035, by End User
  • Table 82: Nordic Countries Market Size (USD million) Analysis 2020 to 2024 and Forecast 2025 to 2035, by Product Type
  • Table 83: Nordic Countries Market Size (USD million) Analysis 2020 to 2024 and Forecast 2025 to 2035, by Technology
  • Table 84: Nordic Countries Market Size (USD million) Analysis 2020 to 2024 and Forecast 2025 to 2035, by End User
  • Table 85: Eastern Europe Market Size (USD million) Analysis 2020 to 2024 and Forecast 2025 to 2035, by Country
  • Table 86: Eastern Europe Market Volume (Units) Analysis 2020 to 2024 and Forecast 2025 to 2035, by Product Type
  • Table 87: Eastern Europe Market Size (USD million) Analysis 2020 to 2024 and Forecast 2025 to 2035, by Product Type
  • Table 88: Eastern Europe Market Size (USD million) Analysis 2020 to 2024 and Forecast 2025 to 2035, by Technology
  • Table 89: Eastern Europe Market Size (USD million) Analysis 2020 to 2024 and Forecast 2025 to 2035, by End User
  • Table 90: Russia Market Size (USD million) Analysis 2020 to 2024 and Forecast 2025 to 2035, by Product Type
  • Table 91: Russia Market Size (USD million) Analysis 2020 to 2024 and Forecast 2025 to 2035, by Technology
  • Table 92: Russia Market Size (USD million) Analysis 2020 to 2024 and Forecast 2025 to 2035, by End User
  • Table 93: Hungary Market Size (USD million) Analysis 2020 to 2024 and Forecast 2025 to 2035, by Product Type
  • Table 94: Hungary Market Size (USD million) Analysis 2020 to 2024 and Forecast 2025 to 2035, by Technology
  • Table 95: Hungary Market Size (USD million) Analysis 2020 to 2024 and Forecast 2025 to 2035, by End User
  • Table 96: Poland Market Size (USD million) Analysis 2020 to 2024 and Forecast 2025 to 2035, by Product Type
  • Table 97: Poland Market Size (USD million) Analysis 2020 to 2024 and Forecast 2025 to 2035, by Technology
  • Table 98: Poland Market Size (USD million) Analysis 2020 to 2024 and Forecast 2025 to 2035, by End User
  • Table 99: Middle East and Africa Market Size (USD million) Analysis 2020 to 2024 and Forecast 2025 to 2035, by Country
  • Table 100: Middle East and Africa Market Volume (Units) Analysis 2020 to 2024 and Forecast 2025 to 2035, by Product Type
  • Table 101: Middle East and Africa Market Size (USD million) Analysis 2020 to 2024 and Forecast 2025 to 2035, by Product Type
  • Table 102: Middle East and Africa Market Size (USD million) Analysis 2020 to 2024 and Forecast 2025 to 2035, by Technology
  • Table 103: Middle East and Africa Market Size (USD million) Analysis 2020 to 2024 and Forecast 2025 to 2035, by End User
  • Table 104: Saudi Arabia Market Size (USD million) Analysis 2020 to 2024 and Forecast 2025 to 2035, by Product Type
  • Table 105: Saudi Arabia Market Size (USD million) Analysis 2020 to 2024 and Forecast 2025 to 2035, by Technology
  • Table 106: Saudi Arabia Market Size (USD million) Analysis 2020 to 2024 and Forecast 2025 to 2035, by End User
  • Table 107: Turkiye Market Size (USD million) Analysis 2020 to 2024 and Forecast 2025 to 2035, by Product Type
  • Table 108: Turkiye Market Size (USD million) Analysis 2020 to 2024 and Forecast 2025 to 2035, by Technology
  • Table 109: Turkiye Market Size (USD million) Analysis 2020 to 2024 and Forecast 2025 to 2035, by End User
  • Table 110: South Africa Market Size (USD million) Analysis 2020 to 2024 and Forecast 2025 to 2035, by Product Type
  • Table 111: South Africa Market Size (USD million) Analysis 2020 to 2024 and Forecast 2025 to 2035, by Technology
  • Table 112: South Africa Market Size (USD million) Analysis 2020 to 2024 and Forecast 2025 to 2035, by End User
  • Table 113: Other African Union Market Size (USD million) Analysis 2020 to 2024 and Forecast 2025 to 2035, by Product Type
  • Table 114: Other African Union Market Size (USD million) Analysis 2020 to 2024 and Forecast 2025 to 2035, by Technology
  • Table 115: Other African Union Market Size (USD million) Analysis 2020 to 2024 and Forecast 2025 to 2035, by End User

List of Figures

  • Figure 1: Global Market Value Share by Product Type 2025 (E)
  • Figure 2: Global Market Value Share by Technology 2025 (E)
  • Figure 3: Global Market Split by End User 2025 (E)
  • Figure 4: Global Market Split by Region 2025 (E)
  • Figure 5: Global Market Volume (Units) Analysis, 2020 to 2024
  • Figure 6: Global Market Volume (Units) and Y-o-Y Growth (%) Analysis, 2025 to 2035
  • Figure 7: Portable Pricing Analysis (USD) for Per Unit, by Region, 2024
  • Figure 8: Benchtop Pricing Analysis (USD) for Per Unit, by Region, 2024
  • Figure 9: Global Market Historical Market Value, 2020 to 2024
  • Figure 10: Global Market Value (USD million) and Y-o-Y Growth (%), 2025 to 2035
  • Figure 11: Global Market Absolute USD Opportunity, 2025 to 2035
  • Figure 12: Global Market Analysis by Product Type to 2025 (E) and 2035 (F)
  • Figure 13: Global Market Y-o-Y Growth Projections by Product Type, 2025 to 2035
  • Figure 14: Global Market Size (USD million) Analysis 2020 to 2024 and Forecast 2025 to 2035, by Product Type
  • Figure 15: Global Market Analysis by Technology 2025 (E) and 2035 (F)
  • Figure 16: Global Market Y-o-Y Growth Projections by Technology, 2025 to 2035
  • Figure 17: Global Market Size (USD million) Analysis 2020 to 2024 and Forecast 2025 to 2035, by Technology
  • Figure 18: Global Market Analysis by End User 2025 (E) and 2035 (F)
  • Figure 19: Global Market Y-o-Y Growth Projections by End User, 2025 to 2035
  • Figure 20: Global Market Size (USD million) Analysis 2020 to 2024 and Forecast 2025 to 2035, by End User
  • Figure 21: Global Market Analysis by Region 2025 (E) and 2035 (F)
  • Figure 22: Global Market Y-o-Y Growth Projections by Region, 2025 to 2035
  • Figure 23: Global Market Size (USD million) Analysis 2020 to 2024 and Forecast 2025 to 2035, by Region
  • Figure 24: North America Market Value Share by Product Type 2025 (E)
  • Figure 25: North America Market Value Share by Technology 2025 (E)
  • Figure 26: North America Market Split by End User 2025 (E)
  • Figure 27: North America Market Split by Country 2025 (E)
  • Figure 28: North America Market Value (USD million) Analysis, 2020 to 2024
  • Figure 29: North America Market Value (USD million) and Y-o-Y Growth (%), 2025 to 2035
  • Figure 30: North America Market Attractiveness Analysis, by Country
  • Figure 31: North America Market Attractiveness Analysis, by Product Type
  • Figure 32: North America Market Attractiveness Analysis, by Technology
  • Figure 33: North America Market Attractiveness Analysis, by End User
  • Figure 34: Latin America Market Value Share by Product Type 2025 (E)
  • Figure 35: Latin America Market Value Share by Technology 2025 (E)
  • Figure 36: Latin America Market Split by End User 2025 (E)
  • Figure 37: Latin America Market Split by Country 2025 (E)
  • Figure 38: Latin America Market Value (USD million) Analysis, 2020 to 2024
  • Figure 39: Latin America Market Value (USD million) and Y-o-Y Growth (%), 2025 to 2035
  • Figure 40: Latin America Market Attractiveness Analysis, by Country
  • Figure 41: Latin America Market Attractiveness Analysis, by Product Type
  • Figure 42: Latin America Market Attractiveness Analysis, by Technology
  • Figure 43: Latin America Market Attractiveness Analysis, by End User
  • Figure 44: East Asia Market Value Share by Product Type 2025 (E)
  • Figure 45: East Asia Market Value Share by Technology 2025 (E)
  • Figure 46: East Asia Market Split by End User 2025 (E)
  • Figure 47: East Asia Market Split by Country 2025 (E)
  • Figure 48: East Asia Market Value (USD million) Analysis, 2020 to 2024
  • Figure 49: East Asia Market Value (USD million) and Y-o-Y Growth (%), 2025 to 2035
  • Figure 50: East Asia Market Attractiveness Analysis, by Country
  • Figure 51: East Asia Market Attractiveness Analysis, by Product Type
  • Figure 52: East Asia Market Attractiveness Analysis, by Technology
  • Figure 53: East Asia Market Attractiveness Analysis, by End User
  • Figure 54: South Asia and Pacific Market Value Share by Product Type 2025 (E)
  • Figure 55: South Asia and Pacific Market Value Share by Technology 2025 (E)
  • Figure 56: South Asia and Pacific Market Split by End User 2025 (E)
  • Figure 57: South Asia and Pacific Market Split by Country 2025 (E)
  • Figure 58: South Asia and Pacific Market Value (USD million) Analysis, 2020 to 2024
  • Figure 59: South Asia and Pacific Market Value (USD million) and Y-o-Y Growth (%), 2025 to 2035
  • Figure 60: South Asia and Pacific Market Attractiveness Analysis, by Country
  • Figure 61: South Asia and Pacific Market Attractiveness Analysis, by Product Type
  • Figure 62: South Asia and Pacific Market Attractiveness Analysis, by Technology
  • Figure 63: South Asia and Pacific Market Attractiveness Analysis, by End User
  • Figure 64: Western Europe Market Value Share by Product Type 2025 (E)
  • Figure 65: Western Europe Market Value Share by Technology 2025 (E)
  • Figure 66: Western Europe Market Split by End User 2025 (E)
  • Figure 67: Western Europe Market Split by Country 2025 (E)
  • Figure 68: Western Europe Market Value (USD million) Analysis, 2020 to 2024
  • Figure 69: Western Europe Market Value (USD million) and Y-o-Y Growth (%), 2025 to 2035
  • Figure 70: Western Europe Market Attractiveness Analysis, by Country
  • Figure 71: Western Europe Market Attractiveness Analysis, by Product Type
  • Figure 72: Western Europe Market Attractiveness Analysis, by Technology
  • Figure 73: Western Europe Market Attractiveness Analysis, by End User
  • Figure 74: Eastern Europe Market Value Share by Product Type 2025 (E)
  • Figure 75: Eastern Europe Market Value Share by Technology 2025 (E)
  • Figure 76: Eastern Europe Market Split by End User 2025 (E)
  • Figure 77: Eastern Europe Market Split by Country 2025 (E)
  • Figure 78: Eastern Europe Market Value (USD million) Analysis, 2020 to 2024
  • Figure 79: Eastern Europe Market Value (USD million) and Y-o-Y Growth (%), 2025 to 2035
  • Figure 80: Eastern Europe Market Attractiveness Analysis, by Country
  • Figure 81: Eastern Europe Market Attractiveness Analysis, by Product Type
  • Figure 82: Eastern Europe Market Attractiveness Analysis, by Technology
  • Figure 83: Eastern Europe America Market Attractiveness Analysis, by End User
  • Figure 84: Middle East and Africa Market Value Share by Product Type 2024 (E)
  • Figure 85: Middle East and Africa Market Value Share by Technology 2024 (E)
  • Figure 86: Middle East and Africa Market Split by End User 2025 (E)
  • Figure 87: Middle East and Africa Market Split by Country 2025 (E)
  • Figure 88: Middle East and Africa Market Value (USD million) Analysis, 2020 to 2024
  • Figure 89: Middle East and Africa Market Value (USD million) and Y-o-Y Growth (%), 2025 to 2035
  • Figure 90: Middle East and Africa Market Attractiveness Analysis, by Country
  • Figure 91: Middle East and Africa Market Attractiveness Analysis, by Product Type
  • Figure 92: Middle East and Africa Market Attractiveness Analysis, by Technology

Frequently Asked Questions

What is the projected size of the vein finder market by 2035?

The market is expected to grow from USD 38.78 million in 2025 to USD 54.18 million by 2035, at a CAGR of 3.4%.

Which product type segment is expected to dominate the vein finder market?

The portable product type is projected to capture 55.3% of the market share in 2025 due to its mobility and adaptability in various healthcare settings.

Which technology segment is anticipated to experience the highest growth?

Infrared technology is expected to witness a CAGR of 6.7% from 2025 to 2035, driven by its wide applications in medical diagnostics.

Which end-user segment is forecasted to hold the largest market share in 2025?

Hospitals are expected to dominate the end-user segment, capturing 42.5% of the market share due to their extensive use of diagnostic equipment.

Which region is predicted to have the fastest-growing vein finder market?

China is expected to experience the highest growth, with a CAGR of 7.0% from 2025 to 2035, driven by the increasing demand for healthcare technologies.

Explore Similar Insights

Future Market Insights

Vein Finder Market