
- Market Size (2026)
- USD 194.8 Mn
- Forecast (2036)
- USD 335.9 Mn
- CAGR (2026 to 2036)
- 5.6%
How big is Vinpocetine Market in 2026?
Registering a value of USD 184.5 million in 2025, the vinpocetine market expanded to USD 194.8 million in 2026 and is slated to reach USD 335.9 million by 2036 on the back of a 5.6% CAGR.
The global vinpocetine market reached a valuation of USD 184.5 million in 2025 and rose to USD 194.8 million in 2026. Global market value is forecast by FMI to reach USD 335.9 million by 2036, advancing at a 5.6% CAGR over the 2026 to 2036 assessment period. Prescription Cerebrovascular Cavinton and Generic Tablets secure 58.6% of 2026 regulatory channel value as hospital neurology departments across Central Europe and East Asia dispense oral ethyl apovincaminate for chronic post-stroke hypoperfusion. Structural demographic aging across reimbursing prescription markets anchors this growth in contrast to consumer nootropic supplement blends expanding at a 12.5% CAGR, because prescription vasodilators follow clinical stroke prevalence whereas retail cognitive stacks face United States regulatory exclusions. In March 2026, pharmacological investigators at Gedeon Richter Plc publishing in Biomolecules confirmed that vinpocetine inhibits voltage-gated sodium channels and phosphodiesterase-1 while suppressing microglial nuclear factor-kappa B neuroinflammation. A May 2026 Alzheimer's & Dementia registry analysis also tracked 88 clinical trials across 62 vasoactive compounds targeting vascular cognitive impairment. Gedeon Richter Plc reported HUF 448.1 billion in first-half 2026 pharmaceutical receipts in August 2026 with active-ingredient consolidation at its Dorog facility, positioning prescription neurovascular tenders and self-microemulsifying oral delivery systems to drive category value through 2036.
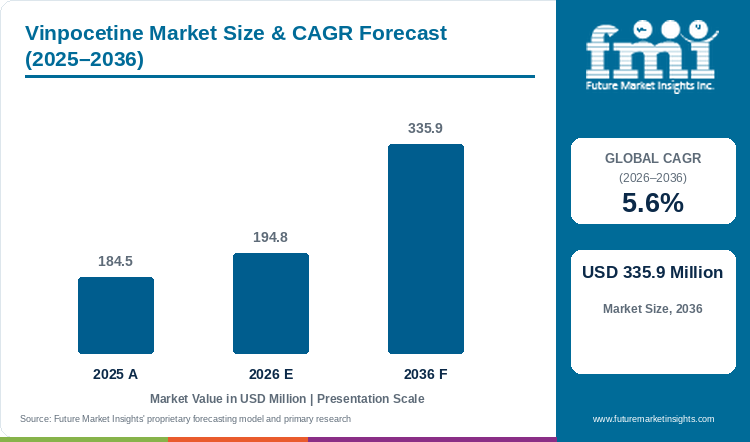
Key Market Trends & Insights
- By regulatory channel: Prescription Cerebrovascular Cavinton and Generic Tablets hold an estimated 58.6% share in 2026 because national health formularies across Central Europe and Asia reimburse ethyl apovincaminate for chronic cerebrovascular insufficiency.
- By dosage form: Oral 5 mg and 10 mg Compressed Tablets represent 64.4% in 2026 as outpatient neurology maintenance protocols prescribe 15 mg to 30 mg daily divided oral doses.
- By clinical application: Cerebral Blood-Flow and Vascular Dementia Management accounts for 53.2% in 2026 because aging post-stroke cohorts require long-term microcirculatory and neuroprotective therapy.
- By source pathway: Semi-Synthetic Vincamine and Tabersonine Extraction secures 67.2% in 2026 owing to established Voacanga africana seed and Vinca minor leaf alkaloid isolation routes.
- By distribution channel: Hospital and Outpatient Neurology Pharmacies command 54.8% in 2026 through institutional stroke-rehabilitation tenders and neurologist prescription refills.
Regional Highlights
- Top national expansion: South Korea tops national growth rankings at a 6.3% CAGR to 2036 on rapid geriatric demographic expansion and outpatient cerebrovascular prescribing.
- Broader country progression: Poland tracks at a 6.1% CAGR ahead of Japan at 5.8% and Italy at 5.5%, while Germany records 5.4% and the United States registers 5.2%.
Market Size & Forecast
Table 1: Market Size and Forecast for the Vinpocetine Market (USD million and CAGR percentage), 2025 to 2036
| Metric | Value |
|---|---|
| 2025 Market Size | USD 184.5 million |
| Estimated Market Size in 2026 | USD 194.8 million |
| Projected Market Size by 2036 | USD 335.9 million |
| CAGR, 2026 to 2036 | 5.6% |
| Added Value, 2026 to 2036 | USD 141.1 million |
Active pharmaceutical ingredient synthesizers and neurovascular tablet formulators operate across a split global market where Central European and Asian hospitals reimburse vinpocetine as a frontline post-stroke drug while North America restricts retail supplement labels. According to a September 2025 clinical review from Seoul National University Hospital in the Journal of Clinical Medicine, vascular dementia accounts for 15% to 20% of all dementia cases and selective phosphodiesterase inhibition restores cerebral blood flow while protecting white-matter oligodendrocytes. Procurement teams supplying vascular dementia therapeutics specify European Pharmacopoeia 11.0 compliant API lots with apovincaminic acid impurities held below 0.1%.
Bulk Alkaloid API Tonnage and Clinical Regimen Sizing
Table 2: Bulk Alkaloid API Tonnage and Clinical Regimen Sizing for the Vinpocetine Market (USD million and operational ranges), 2025 to 2036
| Metric | 2025 | 2026 | 2036 |
|---|---|---|---|
| Market size (USD million) | 184.5 | 194.8 | 335.9 |
| Global vinpocetine API production (metric tons) | 92.0 to 102.0 | 97.0 to 108.0 | 162.0 to 180.0 |
| Equivalent 15 mg to 30 mg daily patient regimens (million days) | 1,280 to 1,420 | 1,350 to 1,500 | 2,250 to 2,500 |
| Average EP/USP pharmaceutical API value per kg (USD) | 820.0 to 940.0 | 835.0 to 960.0 | 880.0 to 1,020.0 |
Operational note: API tonnage and clinical regimen ranges apply standard 5 mg to 10 mg three-times-daily oral tablet maintenance dosing (15 mg to 30 mg/day) and 20 mg/2 mL slow intravenous infusion ampoule protocols across acute and chronic cerebrovascular care.
Unformulated crystalline vinpocetine dissolves poorly at neutral intestinal pH (below 2.4 micrograms per milliliter) and undergoes rapid first-pass hepatic esterase conversion into inactive apovincaminic acid. A June 2026 delivery review in the International Journal of Molecular Sciences confirmed that co-milling indole alkaloids with organic acidifiers or encapsulating them in self-microemulsifying lipid carriers multiplies oral absorption. Contract manufacturers of softgel capsule delivery systems use these acidified lipid matrices to achieve two-to-three-fold higher cerebral bioavailability without increasing tablet milligram loads.
Per Capita & Neurovascular Formulary Line Sizing
Table 3: Per Capita and Neurovascular Formulary Indicators for the Vinpocetine Market (USD), 2025 to 2036
| Metric | 2025 | 2026 | 2036 |
|---|---|---|---|
| World population (billion) | 8.2 | 8.3 | 9.0 |
| Market value per 1,000 people (USD) | 22.5 | 23.5 | 37.3 |
| Annual procurement per neurovascular tablet/ampoule plant (USD thousand) | 640.0 to 720.0 | 675.0 to 760.0 | 1,160.0 to 1,310.0 |
| Prescription Cavinton & generic hospital-pharmacy share (%) | 57.5% to 59.0% | 58.6% to 60.2% | 61.5% to 64.0% |
Table 4: Pharmaceutical Plant & Channel Value Indicators for the Vinpocetine Market (USD million and percentages), 2026
| Metric | Value | Institutional Reference Basis |
|---|---|---|
| Market size, 2026 | USD 194.8 million | 2026 global market value baseline |
| Qualified cGMP alkaloid API & neurovascular dosage plants | 275 plants | European, Asian & North American finished dosage lines |
| Annualized vinpocetine allocation per plant | USD 0.71 million | Mean annual ethyl apovincaminate procurement per facility |
| Hospital & Outpatient Neurology Pharmacies value, 2026 | USD 106.8 million | 54.8% distribution channel allocation |
Semi-synthetic conversion of tabersonine extracted from West African Voacanga africana seeds or vincamine isolated from Vinca minor leaves requires strict chiral control at carbons 3 and 16 during ethyl esterification. In June 2025, a real-world cohort study of 133,336 patients in Neuroepidemiology demonstrated why selective cerebral phosphodiesterase-1 modulation differs clinically from systemic PDE5 vasodilation in older cognitive cohorts. Institutional buyers supplying dementia management clinics audit Certificate of Suitability dossiers issued by the European Directorate for the Quality of Medicines before qualifying bulk API extractors.
Analyst Perspective
"Vinpocetine operates as two distinct commercial markets globally. While FDA dietary-ingredient restrictions cap over-the-counter nootropic marketing in the United States, prescription Cavinton and generic neurovascular tablets continue to expand steadily across Central European and East Asian geriatric stroke formularies."
- Nandini Roy Choudhury, Principal Consultant, Future Market Insights.
How is the vinpocetine market segmented?
The vinpocetine market is segmented by regulatory channel, dosage form, clinical application, source pathway, and distribution channel. In 2026, Prescription Cerebrovascular Cavinton and Generic Tablets is projected at 58.6%, Oral 5 mg and 10 mg Compressed Tablets at 64.4%, Cerebral Blood-Flow and Vascular Dementia Management at 53.2%, Semi-Synthetic Vincamine and Tabersonine Extraction at 67.2%, and Hospital and Outpatient Neurology Pharmacies at 54.8%.
By regulatory channel: Prescription Cerebrovascular Cavinton and Generic Tablets and OTC Cognitive Nootropic and Memory Supplements.
By dosage form: Oral 5 mg and 10 mg Compressed Tablets with Softgels and Multi-Ingredient Nootropic Capsules and Parenteral Intravenous Ampoules for Acute Stroke Care.
By clinical application: Cerebral Blood-Flow and Vascular Dementia Management and Healthy Aging Memory and Focus with Tinnitus Support.
By source pathway: Semi-Synthetic Vincamine and Tabersonine Extraction and Total Synthetic Indole Alkaloid Synthesis.
By distribution channel: Hospital and Outpatient Neurology Pharmacies with Retail Health Stores and OTC Pharmacies and Direct-to-Consumer e-Commerce Portals.
Why do Prescription Cerebrovascular Cavinton and Generic Tablets lead the regulatory channel category?
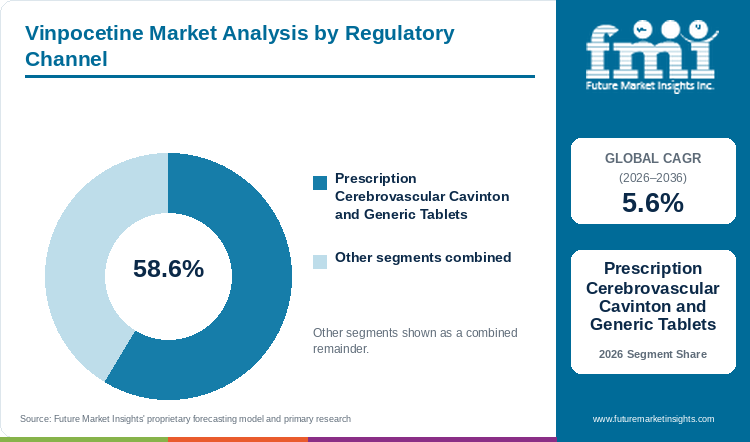
Prescription Cerebrovascular Cavinton and Generic Tablets hold an estimated 58.6% of regulatory channel demand in 2026, anchored by national neurology formulary reimbursement in Europe and Asia.
Table 5: Regulatory Channel Share for the Vinpocetine Market (percentage share), 2026
| Regulatory Channel | Share (2026) |
|---|---|
| Prescription Cerebrovascular Cavinton and Generic Tablets | 58.6% |
| Other Segments Combined | 41.4%* |
| Total | 100.0% |
*Note: OTC Cognitive Nootropic and Memory Supplements account for the remaining 41.4% of 2026 global vinpocetine demand.
Table 6: Regulatory Channel Leadership and Market Growth for the Vinpocetine Market (segment and CAGR percentage), 2026 to 2036
| Metric | Value |
|---|---|
| Global CAGR (2026 to 2036) | 5.6% |
| Leading Segment | Prescription Cerebrovascular Cavinton and Generic Tablets |
Since Gedeon Richter Plc introduced Cavinton in Hungary in 1978, prescription ethyl apovincaminate tablets and ampoules have remained standard outpatient therapy for chronic cerebral ischemia across Central and Eastern Europe and East Asia. Whereas OTC Cognitive Nootropic and Memory Supplements compete within cognitive health supplements in e-commerce channels, prescription generics generate recurring 90-day hospital and neurology refill volume.
- Prescription Cerebrovascular Cavinton and Generic Tablets hold 58.6% of regulatory channel value in 2026 because physician-supervised post-stroke protocols mandate uninterrupted multi-month oral dosing.
- Gedeon Richter Plc reported HUF 448.1 billion in first-half 2026 pharmaceutical receipts in August 2026 with General Medicines expanding 9.4% year-on-year across Central European and Asian hospital tenders.
What sustains Oral 5 mg and 10 mg Compressed Tablets leadership in the dosage form segment?
Oral 5 mg and 10 mg Compressed Tablets represent 64.4% of the dosage form category in 2026, supported by Cavinton Forte 10 mg outpatient maintenance protocols.
Compressed 5 mg and 10 mg oral tablets blister-packed in 30-count to 90-count cartons represent the primary outpatient maintenance format following acute inpatient stroke discharge. Softgels and Multi-Ingredient Nootropic Capsules pair vinpocetine with standardized Ginkgo biloba extracts or huperzine A, while Parenteral Intravenous Ampoules for Acute Stroke Care (10 mg/2 mL) serve inpatient neurology wards.
- Oral 5 mg and 10 mg Compressed Tablets account for 64.4% of the dosage form segment in 2026 as chronic cerebrovascular patients transition from hospital intravenous drips to oral home maintenance.
- In April 2025, drug-delivery scientists publishing in the Journal of Controlled Release demonstrated that vinpocetine microemulsion pre-administration selectively boosts cerebral blood flow and enhances central nervous system drug distribution.
How does Cerebral Blood-Flow and Vascular Dementia Management lead the clinical application category?
Cerebral Blood-Flow and Vascular Dementia Management accounts for 53.2% of clinical application value in 2026, driven by lacunar stroke and cerebral small vessel disease rehabilitation.
Chronic cerebral hypoperfusion and white-matter hyperintensities with post-apoplectic cognitive impairment represent the core medical indications for selective phosphodiesterase-1 inhibition. Meanwhile, Healthy Aging Memory and Focus with Tinnitus Support captures demand across tinnitus management therapies and memory support supplements where inner-ear and cochlear microcirculatory vasodilation relieves sensorineural ringing and vertigo.
- Cerebral Blood-Flow and Vascular Dementia Management represents 53.2% of clinical application demand in 2026 because vascular cognitive impairment requires lifelong microcirculatory support.
- An April 2026 systematic review and meta-analysis in Frontiers in Neurology across 236 cerebral small vessel disease patients confirmed that phosphodiesterase inhibition significantly increases cerebral blood flow in white-matter hyperintensity regions by 1.31 mL/100 g/min.
Why does Semi-Synthetic Vincamine and Tabersonine Extraction lead the source pathway category?
Semi-Synthetic Vincamine and Tabersonine Extraction secures 67.2% of source pathway value in 2026, supported by stereoselective alkaloid yield from Voacanga africana seeds.
Industrial manufacture of pharmaceutical-grade vinpocetine relies primarily on extracting tabersonine from West African Voacanga africana seeds or vincamine from European Vinca minor foliage followed by semi-synthetic dehydration and ethyl esterification. Total Synthetic Indole Alkaloid Synthesis avoids agricultural harvest swings, yet stereoselective semi-synthesis through European phytochemical extractors such as Linnea SA and Covex S.A. remains more economical at commercial scale.
- Semi-Synthetic Vincamine and Tabersonine Extraction secures 67.2% of source pathway demand in 2026 because natural indole alkaloids already possess the required cis-eburnamine stereochemistry.
- In March 2026, Gedeon Richter researchers noted in Biomolecules that while total synthesis of vinpocetine has been established since 1983, semi-synthesis from Vinca minor and Voacanga alkaloids remains the industrial backbone.
What gives Hospital and Outpatient Neurology Pharmacies the leading position in distribution channel?
Hospital and Outpatient Neurology Pharmacies command 54.8% of distribution channel share in 2026, anchored by acute stroke ampoule administration and neurologist prescription refills.
Hospital stroke units initiate parenteral Cavinton infusions during acute ischemic recovery and discharge patients with outpatient neurology pharmacy prescriptions for 5 mg or 10 mg tablets. Retail Health Stores and OTC Pharmacies plus Direct-to-Consumer e-Commerce Portals distribute cognitive supplements with citicoline cognitive ingredients, though regulatory restrictions in the United States and European Union limit OTC shelf space.
- Hospital and Outpatient Neurology Pharmacies secure 54.8% of channel demand in 2026 as prescription rules in Europe and Asia route dispensation through clinical dispensaries.
- A May 2025 prospective clinical stroke study in Stroke Research and Treatment tracked long-term post-ischemic cognitive recovery across hospital neurology cohorts, supporting sustained outpatient neuroprotective prescribing.
What are the drivers, restraints, and opportunities in the vinpocetine market?
In the vinpocetine market, aging post-stroke cohorts and pleiotropic NaV1.8/PDE1 neuroprotection are projected to drive adoption whereas FDA New Dietary Ingredient exclusions and low oral solubility restrain OTC supplements and brain-targeted microemulsions with peripheral neuropathy indications unlock new growth.
- Driver: Elevated global incidence of ischemic stroke and vascular cognitive impairment with multi-target PDE1 and NaV1.8 plus NF-kappa B neuroprotective validation sustains hospital and outpatient prescription volume.
- Restraint: United States FDA exclusion of vinpocetine from the definition of a dietary ingredient and reproductive developmental toxicity warnings restrict over-the-counter supplement marketing.
- Opportunity: Development of self-microemulsifying oral capsules and brain-targeted nanocarrier ligands with repurposed chemotherapy-induced peripheral neuropathy indications opens high-value pharmaceutical pipelines.
Growth Analysis and Future Potential: Qualitative Demand Catalysts
Geriatric patient cohorts with hypertension-induced cerebral small vessel disease and post-stroke cognitive decline drive steady neurology prescribing of ethyl apovincaminate across Europe and Asia. In August 2025, pharmacologists publishing in Biomedicine & Pharmacotherapy demonstrated that vinpocetine alleviates chemotherapy-induced peripheral neuropathy in mice by reducing oxidative stress and activating mitochondrial biogenesis, while an August 2026 study in Naunyn-Schmiedeberg's Archives of Pharmacology confirmed protection against myocardial ischemia-reperfusion injury. Additional June 2025 and May 2025 studies in the Journal of Biochemical and Molecular Toxicology verified neuroprotection via cAMP/PI3K/AKT/CREB activation and hepatorenal antioxidant preservation, complementing brain health supplement demand.
Risk Assessment of the Vinpocetine Market: Operational and Formulation Friction
Regulatory classification of semi-synthetic vinpocetine as an unapproved drug rather than a lawful dietary supplement in North America and the European Union represents the primary barrier to retail nootropic expansion. In its May 2026 Select Dietary Supplement Ingredients regulatory directory, the United States Food and Drug Administration reaffirmed its tentative conclusion that vinpocetine does not qualify as a dietary ingredient under federal statute and maintained its reproductive safety warning for women of childbearing potential based on National Toxicology Program fetal resorption data. Furthermore, unformulated crystalline vinpocetine suffers from ~6.7% fasting oral bioavailability in humans, requiring co-administration with food or acidic solubilizers to achieve therapeutic cerebral concentrations.
Commercial Opportunity Analysis: Formulation Differentiation and Value-Add Formats
Pharmaceutical formulators and specialty API suppliers unlock new commercial value by deploying vinpocetine as a blood-brain-barrier targeting ligand and repurposing the molecule into orthopedic and neurodegenerative indications. In April 2025, investigators in the Journal of Controlled Release proved that conjugating vinpocetine onto liposomes and pre-dosing vinpocetine microemulsions selectively elevates cerebral blood flow and brain drug accumulation above glutathione or angiopep-2 ligands. Concurrently, a January 2026 study in Biomedicines and a December 2024 Phytomedicine investigation showing vinpocetine inhibits chondrocyte ferroptosis via the Nrf2/GPX4 pathway position the compound for disease-modifying clinical trials.
Vinpocetine Market by Country (2026 to 2036)
Country-level projections place South Korea first in vinpocetine growth at a 6.3% CAGR through 2036, with Poland next at 6.1% and Japan at 5.8%. Italy records 5.5% before Germany at 5.4% and the United States at 5.2%.
Table 7: Country CAGR and Primary Growth Levers for the Vinpocetine Market (CAGR percentage and operational driver), 2026 to 2036
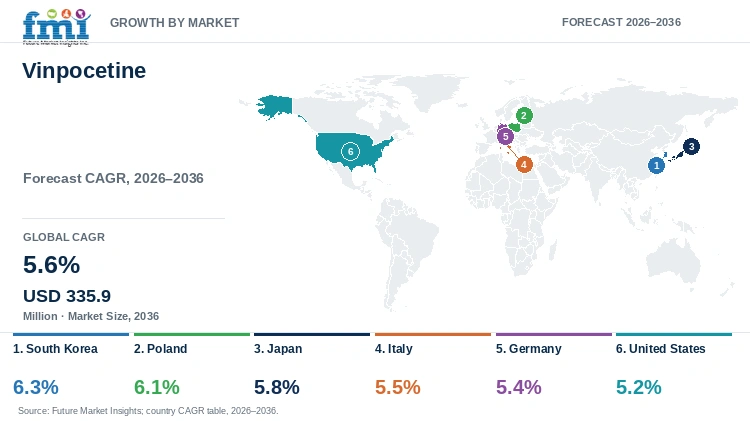
| Country | CAGR (2026 to 2036) | Primary Growth Lever |
|---|---|---|
| South Korea | 6.3% | Rapidly aging post-stroke outpatient cohorts and neurology clinic tinnitus prescribing |
| Poland | 6.1% | Reimbursed Cavinton Forte 10 mg neurology refills and domestic generic tablet volume |
| Japan | 5.8% | Super-aging vascular cognitive impairment management and precision generic API quality |
| Italy | 5.5% | Geriatric cerebrovascular rehabilitation and semi-synthetic Vinca alkaloid extraction |
| Germany | 5.4% | Outpatient neurovascular & cochlear microcirculation prescribing under EP standards |
| United States | 5.2% | Dedicated e-commerce nootropic stack demand balanced by FDA Category 2 label scrutiny |
Source: Future Market Insights analysis
South Korea Vinpocetine Market Outlook (2026 to 2036)
Propelled by rapid demographic aging and outpatient neuroimaging screening, South Korea leads global growth in cerebrovascular and cochlear microcirculation pharmacotherapy. Vinpocetine valuation in South Korea climbs at a pace-setting 6.3% annual rate through 2036 across hospital neurology wards and otolaryngology tinnitus clinics. The May 2026 USDA Foreign Agricultural Service Seoul filing recorded strong functional longevity demand among older adults in South Korea, while a May 2026 Alzheimer's & Dementia study examined East Asian clinical trial activity across 62 vascular cognitive impairment drugs. Domestic pharmaceutical formulators combine oral 5 mg and 10 mg vinpocetine tablets with choline alfoscerate and nicergoline in geriatric memory protocols.
Key takeaway: Across South Korea, rapid demographic aging and outpatient neurovascular plus tinnitus prescribing sustain a top 6.3% rate to 2036.
Poland Vinpocetine Market Outlook (2026 to 2036)
Unlike Western European markets where symptomatic cerebral vasodilators face restricted reimbursement, Poland maintains high-volume neurologist and general-practitioner prescribing of Cavinton and domestic generic vinpocetine tablets. Polish vinpocetine demand rises at a 6.1% compound annual pace from 2026 through 2036 across 5 mg and 10 mg oral maintenance packs and 10 mg/2 mL hospital ampoules. In August 2026, Gedeon Richter Plc reported HUF 448.1 billion in first-half 2026 pharmaceutical receipts on strong Central European General Medicines volume, while the March 2026 USDA Foreign Agricultural Service report for Poland documented 3.5% projected 2026 GDP growth supporting household health purchasing. Retail pharmacies across Poland dispense 90-tablet Cavinton Forte packs for chronic post-stroke dizziness and cochlear hypoperfusion.
Key takeaway: In Poland, entrenched neurologist prescribing of Cavinton Forte 10 mg tablets and generic hospital ampoules is expected to sustain a 6.1% CAGR.
Japan Vinpocetine Market Outlook (2026 to 2036)
Whereas consumption in North America centers on non-prescription nootropic capsules, Japan integrates cerebrovascular vasodilators and semi-synthetic indole alkaloids within strict Pharmaceuticals and Medical Devices Agency quality standards and geriatric stroke rehabilitation pathways. Vinpocetine market size in Japan advances at a 5.8% compound annual rate between 2026 and 2036. An April 2026 meta-analysis in Frontiers in Neurology confirmed that selective phosphodiesterase inhibition elevates cerebral blood flow in white-matter hyperintensity zones by 1.31 mL/100 g/min, while the April 2026 USDA Foreign Agricultural Service Tokyo report highlighted sustained geriatric nutrition demand across Japan. Pharmaceutical API importers in Japan source high-purity semi-synthetic vinpocetine from European and Asian cGMP phytochemical plants.
Key takeaway: Across Japan, lacunar stroke rehabilitation and high-purity neurovascular API procurement generate a 5.8% annual expansion.
Italy Vinpocetine Market Outlook (2026 to 2036)
Supported by a large over-65 population and established phytochemical extraction expertise across northern Italy and neighboring Ticino, Italy operates as a key Southern European hub for semi-synthetic Vinca minor and Voacanga alkaloid processing. Vinpocetine industry valuation in Italy grows at a 5.5% annual pace between 2026 and 2036 across geriatric vascular cognitive impairment clinics and bulk API export contracts. The April 2026 USDA Foreign Agricultural Service report for Italy documented USD 43.4 billion in consumer-oriented health and food imports, while August 2025 Aging Clinical and Experimental Research cohort data confirmed lower chronic disease risk among older supplement users. Outpatient geriatricians in Italy combine oral vasoactive alkaloids with citicoline to manage vascular cognitive decline.
Key takeaway: Within Italy, geriatric neurovascular rehabilitation and regional European Pharmacopoeia alkaloid extraction sustain a 5.5% annual rate.
Germany Vinpocetine Market Outlook (2026 to 2036)
Compared with over-the-counter supplement markets, Germany regulates vinpocetine strictly as a pharmacy-dispensed medicinal active while supporting clinical research into microcirculatory tinnitus and cerebral small vessel disease. Vinpocetine demand within Germany expands at a 5.4% annual clip over the 10-year window through 2036. In August 2026, Naunyn-Schmiedeberg's Archives of Pharmacology published preclinical evidence showing that vinpocetine suppresses oxidative stress and NF-kappa B inflammation in ischemic tissue, while the March 2026 USDA Foreign Agricultural Service report for Germany tracked steady preventive health demand. Generic marketing authorization holders in Germany source CEP-certified API from Gedeon Richter and Covex S.A. with Linnea SA to supply neurology practices.
Key takeaway: In Germany, pharmacy-regulated neurovascular and cochlear microcirculation therapies supported by European Pharmacopoeia CEP dossiers are slated to sustain a 5.4% CAGR.
United States Vinpocetine Market Outlook (2026 to 2036)
Unlike European prescription markets, the United States market is shaped by Food and Drug Administration New Dietary Ingredient scrutiny that restricts mass retail chains while concentrating demand in direct-to-consumer cognitive stacks. United States vinpocetine valuation progresses at a moderated 5.2% annual rate from 2026 through 2036. In May 2026, the FDA updated its Select Dietary Supplement Ingredients directory reiterating its reproductive safety warning for vinpocetine, while the March 2026 NIH LiverTox record and June 2025 Nutrients safety review emphasized compliant adult dosing. Established United States brands including Jarrow Formulas and Life Extension with Swanson Health Products maintain strict label warnings and interaction screening.
Key takeaway: Across the United States, direct-to-consumer cognitive stack demand balanced by FDA New Dietary Ingredient scrutiny yields a 5.2% growth rate.
Full report country CAGRs cover: North America; Latin America; Western Europe; Eastern Europe; East Asia; South Asia and Pacific; Middle East and Africa.
Who are the notable companies in the vinpocetine market?
Gedeon Richter Plc, Covex S.A., Linnea SA, Alchem International Pvt. Ltd, Jarrow Formulas, Inc., Life Extension Foundation, Swanson Health Products, Northeast Pharmaceutical Group Co., Ltd., Source Naturals, Inc., and Nutricost are the notable companies in the vinpocetine market.
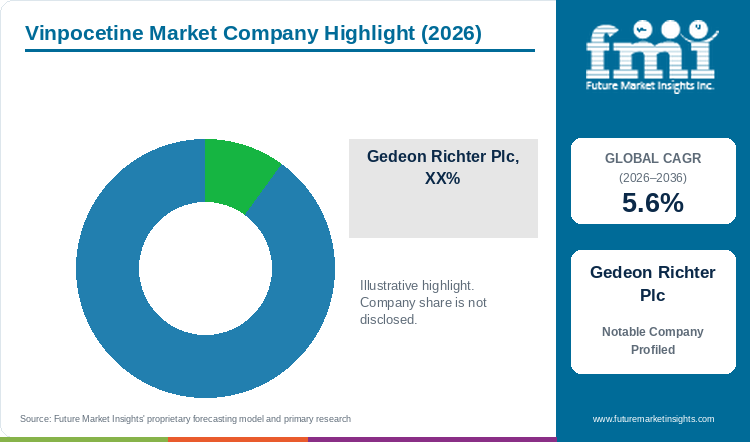
Market structure across the vinpocetine sector divides originator and generic prescription drugmakers from European and Asian cGMP semi-synthetic phytochemical API extractors and cognitive nootropic brands in North America.
- Originator and Prescription Neurovascular Pharmaceutical Producers: Gedeon Richter Plc and Covex S.A. with Northeast Pharmaceutical Group Co. Ltd. manufacture prescription Cavinton and Intelectol plus generic oral tablets and parenteral ampoules with bulk API.
- cGMP Semi-Synthetic Alkaloid API Extractors: Linnea SA and Alchem International Pvt. Ltd extract tabersonine and vincamine from Voacanga africana and Vinca minor to synthesize European Pharmacopoeia and US DMF grade vinpocetine.
- Branded Cognitive Nootropic and Memory Supplement Formulators: Jarrow Formulas Inc. and Life Extension Foundation with Swanson Health Products plus Source Naturals Inc. and Nutricost market 5 mg to 30 mg oral tablets and multi-ingredient cognitive capsules.
Competitive Benchmarking: Vinpocetine Market
Table 8: Competitive Benchmarking for the Vinpocetine Market (qualitative capability ratings), 2026
| Company | EP/CEP & DMF API Scale | Prescription Formulary Reach | Oral & Parenteral Breadth | Geographic Reach |
|---|---|---|---|---|
| Gedeon Richter Plc | High | High | High | Hungary originator of Cavinton (5 mg, 10 mg tablets & ampoules); CEE & Asian neurology leader |
| Covex S.A. | High | High | High | Spain cGMP API and finished dosage producer of Intelectol and generic vinpocetine across 50+ countries |
| Linnea SA | High | Medium | Low | Switzerland CEP-certified semi-synthetic Voacanga/Vinca alkaloid API supplier to global pharma |
| Alchem International | High | Medium | Low | India US-DMF and EU-GMP phytochemical extractor of vincamine and vinpocetine API |
| Jarrow Formulas, Inc. | Low | Low | Medium | United States and international cognitive supplement brand offering 5 mg vinpocetine capsules |
| Life Extension Foundation | Low | Low | Medium | United States science-backed longevity brand marketing 10 mg vinpocetine tablets and stacks |
| Swanson Health Products | Low | Low | Medium | North America and global e-commerce marketer of 10 mg and 30 mg vinpocetine capsules |
| Northeast Pharmaceutical | High | High | High | China large-scale synthetic and semi-synthetic API and hospital parenteral ampoule manufacturer |
| Source Naturals, Inc. | Low | Low | Medium | United States pioneer in nootropic tablet combinations and 10 mg vinpocetine cognitive SKUs |
| Nutricost | Low | Low | Medium | United States cGMP direct-to-consumer e-commerce brand supplying 10 mg and 30 mg capsules |
Scoring basis: EP/CEP & DMF API Scale evaluates primary active pharmaceutical ingredient synthesis and pharmacopeial filings. Prescription Formulary Reach reflects hospital and neurology reimbursement. Oral & Parenteral Breadth measures tablet and softgel with intravenous ampoule offerings.
Key Developments in the Vinpocetine Market
- Gedeon Richter Plc reported HUF 448.1 billion in first-half 2026 pharmaceutical receipts on August 7, 2026, achieving 9.4% General Medicines growth while centralizing active pharmaceutical ingredient production at its Dorog facility.
- Neuropharmacologists E. Sylvester Vizi and Bela Kiss at Gedeon Richter Plc published a comprehensive mechanistic review of Cavinton (vinpocetine) in Biomolecules on March 17, 2026 detailing combined PDE1 and NaV1.8 with anti-inflammatory stroke recovery pathways.
- The United States Food and Drug Administration updated its Select Dietary Supplement Ingredients regulatory directory on May 1, 2026, maintaining active regulatory monitoring and reproductive safety advisories for vinpocetine in retail supplements.
Key Players in the Vinpocetine Market
Originator and Prescription Neurovascular Pharmaceutical Producers
- Gedeon Richter Plc
- Covex S.A.
- Northeast Pharmaceutical Group Co., Ltd.
cGMP Semi-Synthetic Alkaloid API Extractors
- Linnea SA
- Alchem International Pvt. Ltd
Branded Cognitive Nootropic and Memory Supplement Formulators
- Jarrow Formulas, Inc.
- Life Extension Foundation
- Swanson Health Products
- Source Naturals, Inc.
- Nutricost
Vinpocetine Market - Report Scope
Table 9: Report Scope for the Vinpocetine Market (coverage fields and definitions), 2026 to 2036
| Coverage field | Report scope |
|---|---|
| Market breakdown | Regulatory Channel; Dosage Form; Clinical Application; Source Pathway; Distribution Channel |
| Quantitative Units | USD Million |
| Market Definition | Includes commercial supplier market value from bulk pharmaceutical-grade and supplement-grade vinpocetine (ethyl apovincaminate) and formulated prescription tablets (Cavinton and generics), parenteral intravenous ampoules, and over-the-counter cognitive nootropic capsules/tablets. Category Scope Note: Excludes unesterified vincamine monopreparations, standalone Ginkgo biloba extracts, and prescription cholinesterase inhibitors (donepezil, rivastigmine). |
| Regions Covered | North America; Latin America; Western Europe; Eastern Europe; East Asia; South Asia and Pacific; Middle East and Africa |
| Countries Covered | South Korea, Poland, Japan, Italy, Germany, United States, and additional countries in the full report |
| Key Companies Covered | Gedeon Richter Plc; Covex S.A.; Linnea SA; Alchem International Pvt. Ltd; Jarrow Formulas, Inc.; Life Extension Foundation; Swanson Health Products; Northeast Pharmaceutical Group Co., Ltd.; Source Naturals, Inc.; Nutricost |
| Forecast Period | 2026 to 2036 |
| Approach | Primary and secondary research with top-down and bottom-up market triangulation. |
Vinpocetine Market - Research Methodology
Table 10: Research Methodology for the Vinpocetine Market (research methods and approach), 2026 edition
| Method | Approach |
|---|---|
| Primary Research | Structured interviews with European and Indian phytochemical alkaloid API directors, Central European and East Asian hospital neurology pharmacists, and North American nootropic formulators to validate EP API pricing and 15 to 30 mg daily regimen volumes. |
| Secondary Research | Analysis of European Directorate for the Quality of Medicines CEP registries, FDA Dietary Supplement Ingredient Advisory lists, Gedeon Richter Plc financial reports, and PubMed/PMC cerebrovascular and neuroprotection trials. |
| Market Sizing and Forecasting | Top-down vascular dementia treatment and nootropic supplement baselines reconciled against bottom-up global vinpocetine API output (97.0 to 108.0 MT in 2026) and finished tablet/ampoule tender values from 2026 to 2036. |
| Country Forecasting Model | Econometric national projections weight ischemic stroke incidence, national formulary reimbursement of Cavinton and generics, geriatric tinnitus prevalence, and OTC regulatory status across six priority markets. |
| Operational Benchmark Traceability | API tonnage and neurovascular plant indicators in Tables 2, 3, and 4 trace to European Pharmacopoeia vinpocetine monograph specifications, Biomolecules clinical dosing schedules, and Alzheimer's & Dementia trial registries. |
| Data Triangulation and Validation | Market value estimates isolate ethyl apovincaminate API and finished dosage forms while strictly excluding unesterified vincamine, citicoline, and piracetam. |
Vinpocetine Market by Segments
Vinpocetine Market segmented by Regulatory Channel:
- Prescription Cerebrovascular Cavinton and Generic Tablets
- OTC Cognitive Nootropic and Memory Supplements
- Hospital Inpatient Parenteral Formulary Ampoules
- Practitioner-Dispensed Neurovascular Combinations
Vinpocetine Market segmented by Dosage Form:
- Oral 5 mg and 10 mg Compressed Tablets
- Softgels and Multi-Ingredient Nootropic Capsules
- Parenteral Intravenous Ampoules for Acute Stroke Care
- Orally Disintegrating Tablets and Self-Microemulsifying Systems
Vinpocetine Market segmented by Clinical Application:
- Cerebral Blood-Flow and Vascular Dementia Management
- Healthy Aging Memory and Focus with Tinnitus Support
- Post-Ischemic Stroke Neurological Rehabilitation
- Vascular Retinopathy and Choroidal Microcirculation
- Experimental Chemotherapy-Induced Peripheral Neuropathy
Vinpocetine Market segmented by Source Pathway:
- Semi-Synthetic Vincamine and Tabersonine Extraction
- Total Synthetic Indole Alkaloid Synthesis
- Voacanga africana Seed Alkaloid Esterification
- Vinca minor Leaf Alkaloid Derivatization
Vinpocetine Market segmented by Distribution Channel:
- Hospital and Outpatient Neurology Pharmacies
- Retail Health Stores and OTC Pharmacies
- Direct-to-Consumer e-Commerce Portals
- Bulk Pharmaceutical API B2B Contracts
Vinpocetine Market by Region
- North America
- United States
- Canada
- Latin America
- Brazil
- Mexico
- Argentina
- Chile
- Western Europe
- Germany
- France
- United Kingdom
- Italy
- Spain
- Benelux
- Nordics
- Eastern Europe
- Poland
- Czech Republic
- Romania
- Hungary
- East Asia
- China
- Japan
- South Korea
- South Asia and Pacific
- India
- ASEAN
- Australia and New Zealand
- Middle East and Africa
- GCC Countries
- South Africa
- Türkiye
- Israel
Research Sources and Bibliography
- [1] Vizi, E. S., & Kiss, B. (2026, March 17). Vinpocetine An Old Drug with a New Face Moving Toward a Better Understanding of Its Neuroprotective Mechanism of Action. Biomolecules, 16(3), 454 (PMCID PMC13023651).
- [2] Xia, Y., Chen, L., & Zhang, H. (2026, August 20). Vinpocetine attenuates myocardial ischemia/reperfusion injury in mice by suppressing oxidative stress, inflammation, and apoptosis. Naunyn-Schmiedeberg's Archives of Pharmacology, Online ahead of print (PubMed PMID 42618639).
- [3] Nan, G., Wang, S., & Liu, M. (2025, August 6). Vinpocetine alleviates chemotherapy-induced peripheral neuropathy by reducing oxidative stress and enhancing mitochondrial biogenesis in mice. Biomedicine & Pharmacotherapy, 190, 118434 (PubMed PMID 40774018).
- [4] Hafez, M. M., Al-Harbi, N. O., & Al-Rejaie, S. S. (2025, June 1). Vinpocetine Alleviates Valproic Acid-Induced Hepatotoxicity and Neurotoxicity Through Activation of cAMP and PI3K/AKT/CREB Pathway in Rats. Journal of Biochemical and Molecular Toxicology, 39(6), e70316 (PubMed PMID 40421768).
- [5] Ma, X., Zhao, Y., Li, Q., & Chen, J. (2025, April 22). Vinpocetine-mediated multidimensional active targeted delivery to the brain for central nervous system disease therapy. Journal of Controlled Release, 381, 412-428 (PubMed PMID 40274071).
- [6] Kamel, E. M., & Hussein, A. M. (2025, May 15). Protective Mechanisms of Vinpocetine Against Drug-Induced Organ Toxicity via Nrf2/HO-1 and NF-kappa B Modulation. Journal of Biochemical and Molecular Toxicology, 39(5), e70289 (PubMed PMID 40342225).
- [7] Ravi, P., Kumar, S., & Nair, R. (2025, May 18). Long-Term Functional and Cognitive Trajectories Following Acute Ischemic Stroke Rehabilitation. Stroke Research and Treatment, 2025, 8841209 (PMCID PMC12103972).
- [8] Sigdel, K., Bhattarai, S., & Park, J. (2026, January 13). Neurovascular Unit Preservation and Phosphodiesterase Modulation in Chronic Cerebral Hypoperfusion. Biomedicines, 14(1), 182 (PMCID PMC12838627).
- [9] Xu, W., Tan, L., & Yu, J. T. (2026, May 11). Landscape of clinical trials for vascular cognitive impairment and dementia: A registry analysis of 88 trials and 62 agents. Alzheimer's & Dementia: Translational Research & Clinical Interventions, 12(2), e70091 (PMCID PMC13160922).
- [10] Yan, L., Chen, L., Tao, M., Zhang, X., He, R., & Man, L. (2026, April 13). Phosphodiesterase-5 inhibitors for cerebral small vessel disease-related ischemic stroke and cognitive decline: systematic review and meta-analysis. Frontiers in Neurology, 17, 1776589 (PMCID PMC13111112).
- [11] Gedeon Richter Plc. (2026, August 7). Gedeon Richter Plc Financial Report for Q2 and H1 2026: General Medicines and Dorog API Consolidation. Gedeon Richter Plc Official Investor Relations Release.
- [12] United States Food and Drug Administration. (2026, May 1). Information on Select Dietary Supplement Ingredients and Other Substances: Vinpocetine Regulatory Status and Safety Advisory. U.S. Food and Drug Administration Official Directory.
- [13] Wang, J., Yang, J., Fang, Y., Lou, C., Yu, H., Li, Y., Lv, J., Chen, H., Cai, L., & Zheng, W. (2024, December 15). Vinpocetine protects against osteoarthritis by inhibiting ferroptosis and extracellular matrix degradation via activation of the Nrf2/GPX4 pathway. Phytomedicine, 135, 156115 (PubMed PMID 39368343).
- [14] Yang, H. M. (2025, September 19). Vascular Dementia: From Pathophysiology to Therapeutic Frontiers. Journal of Clinical Medicine, 14(18), 6611 (PMCID PMC12470695).
- [15] Gronich, N., Stein, N., & Saliba, W. (2025, June 1). Phosphodiesterase-5 Inhibitors and Dementia Risk: A Real-World Study. Neuroepidemiology, 59(3), 193-202 (PMCID PMC12136505).
- [16] USDA Foreign Agricultural Service. (2026, May 27). South Korea: Food Processing Ingredients Annual. United States Department of Agriculture Foreign Agricultural Service.
- [17] USDA Foreign Agricultural Service. (2026, April 1). Japan: Food Processing Ingredients Annual (Report JA2026-0012). United States Department of Agriculture Foreign Agricultural Service.
- [18] National Institute of Diabetes and Digestive and Kidney Diseases. (2026, March 1). LiverTox Clinical and Research Information on Drug-Induced Liver Injury for Herbal and Dietary Supplements. National Institutes of Health NCBI Bookshelf (NBK547852).
- [19] USDA Foreign Agricultural Service. (2026, March 30). Poland: Food Processing Ingredients Annual (Report PL2026-0004). United States Department of Agriculture Foreign Agricultural Service.
- [20] USDA Foreign Agricultural Service. (2026, April 2). Italy: Food Processing Ingredients Annual (Report IT2026-0001). United States Department of Agriculture Foreign Agricultural Service.
- [21] USDA Foreign Agricultural Service. (2026, March 30). Germany: Food Processing Ingredients Annual (Report GM2026-0007). United States Department of Agriculture Foreign Agricultural Service.
- [22] Baden, K. M., Hoeksema, S. L., Gibson, N., Gadi, I., Craig, E., Draime, J. A., Tubb, S. M., & Chen, A. M. H. (2025, June 24). The Safety and Efficacy of Preventive Nutraceuticals in Aging Adults: A Systematic Review. Nutrients, 17(13), 2093 (PMCID PMC12250884).
- [23] He, Y., Huang, S., Zhang, K., Liu, J., Chen, L., Wang, Y., & Li, X. (2025, August 29). Regular dietary supplementation and risk of age-related chronic diseases: evidence from a propensity score-matched cohort study. Aging Clinical and Experimental Research, 37, 241 (PMCID PMC12397181).
- [24] Tang, L., Chen, M., & Zhao, Q. (2026, June 9). Alkaloids in Neurovascular and Metabolic Homeostasis: Molecular Targets and Delivery Advances. International Journal of Molecular Sciences, 27(12), 6418 (PMCID PMC13299313).
- [25] Mazi, T. A., & Alqahtani, A. S. (2025, October 17). Clinician and consumer perspectives on botanical and semi-synthetic supplement-drug interactions. Journal of Family and Community Medicine, 32(4), 275-283 (PMCID PMC12611053).
This bibliography is provided for reader reference and is not exhaustive. The full report contains the complete citation list and detailed source mapping.
This Report Answers
- How large is the vinpocetine market in 2026 and what is forecast for 2036?
- Why do Central European and East Asian prescription neurovascular formularies anchor demand for vinpocetine?
- Why do Prescription Cerebrovascular Cavinton and Generic Tablets lead the regulatory channel category?
- Why do Oral 5 mg and 10 mg Compressed Tablets lead the dosage form category globally?
- How do growth rates differ across South Korea and Poland with Japan and Italy plus Germany and the United States?
- Which leading companies manufacture CEP-certified vinpocetine API and prescription Cavinton versus OTC nootropics today?
- How do FDA New Dietary Ingredient exclusions and low fasting oral bioavailability restrain the vinpocetine market?
- What drug-delivery and clinical repurposing opportunities can pharmaceutical formulators capture through 2036?
Table of Content
- Key Takeaways
- Market Size and CAGR
- Top Growth Driver
- Fastest Growing Segment
- Leading Region
- Key Companies
- Emerging Opportunities
- Executive Summary
- Global Market Outlook
- Demand-side Trends
- Supply-side Trends
- Technology Roadmap Analysis
- Analysis and Recommendations
- Analyst Perspective (What is happening? Why now? What should investors know?)
- Key Questions Answered
- How large is the market?
- What is the CAGR?
- What are key trends?
- Which region dominates?
- Who are the leaders?
Read More...
- Market Overview
- Market Coverage / Taxonomy
- Market Definition / Scope / Limitations
- Research Methodology
- Chapter Orientation
- Analytical Lens and Working Hypotheses
- Market Structure, Signals, and Trend Drivers
- Benchmarking and Cross-market Comparability
- Market Sizing, Forecasting, and Opportunity Mapping
- Research Design and Evidence Framework
- Desk Research Programme (Secondary Evidence)
- Expert Input and Fieldwork (Primary Evidence)
- Tooling, Models, and Reference Databases
- Data Engineering and Model Build
- Quality Assurance and Audit Trail
- Market Background
- Market Dynamics (Drivers, Restraints, Opportunity, Trends)
- Scenario Forecast (Optimistic, Likely, Conservative)
- Impact Analysis
- AI Impact
- Sustainability Impact
- Regulatory Impact
- Technology Impact
- Consumer / Buyer Analysis
- Purchase Drivers
- Adoption Barriers
- Buyer Journey
- Opportunity Map Analysis
- Product Life Cycle Analysis
- Supply Chain Analysis
- Investment Feasibility Matrix
- Value Chain Analysis
- PESTLE and Porter's Analysis
- Regulatory Landscape
- Regional Parent Market Outlook
- Production and Consumption Statistics
- Import and Export Statistics
- Global Market Analysis and Forecast, 2021 to 2036
- Historical Market Size Value (USD Million) Analysis, 2021 to 2025
- Current and Future Market Size Value (USD Million) Projections, 2026 to 2036
- Y-o-Y Growth Trend Analysis
- Absolute $ Opportunity Analysis
- Global Market Pricing Analysis, 2021 to 2036
- Global Market Analysis and Forecast, By Regulatory Channel, 2021 to 2036
- Introduction / Key Findings
- Historical Market Size Value (USD Million) Analysis By Regulatory Channel, 2021 to 2025
- Current and Future Market Size Value (USD Million) Analysis and Forecast By Regulatory Channel, 2026 to 2036
- Prescription Cerebrovascular Cavinton and Generic Tablets
- OTC Cognitive Nootropic and Memory Supplements
- Hospital Inpatient Parenteral Formulary Ampoules
- Practitioner-Dispensed Neurovascular Combinations
- Y-o-Y Growth Trend Analysis By Regulatory Channel, 2021 to 2025
- Absolute $ Opportunity Analysis By Regulatory Channel, 2026 to 2036
- Global Market Analysis and Forecast, By Dosage Form, 2021 to 2036
- Introduction / Key Findings
- Historical Market Size Value (USD Million) Analysis By Dosage Form, 2021 to 2025
- Current and Future Market Size Value (USD Million) Analysis and Forecast By Dosage Form, 2026 to 2036
- Oral 5 mg and 10 mg Compressed Tablets
- Softgels and Multi-Ingredient Nootropic Capsules
- Parenteral Intravenous Ampoules for Acute Stroke Care
- Orally Disintegrating Tablets and Self-Microemulsifying Systems
- Y-o-Y Growth Trend Analysis By Dosage Form, 2021 to 2025
- Absolute $ Opportunity Analysis By Dosage Form, 2026 to 2036
- Global Market Analysis and Forecast, By Clinical Application, 2021 to 2036
- Introduction / Key Findings
- Historical Market Size Value (USD Million) Analysis By Clinical Application, 2021 to 2025
- Current and Future Market Size Value (USD Million) Analysis and Forecast By Clinical Application, 2026 to 2036
- Cerebral Blood-Flow and Vascular Dementia Management
- Healthy Aging Memory and Focus with Tinnitus Support
- Post-Ischemic Stroke Neurological Rehabilitation
- Vascular Retinopathy and Choroidal Microcirculation
- Experimental Chemotherapy-Induced Peripheral Neuropathy
- Y-o-Y Growth Trend Analysis By Clinical Application, 2021 to 2025
- Absolute $ Opportunity Analysis By Clinical Application, 2026 to 2036
- Global Market Analysis and Forecast, By Source Pathway, 2021 to 2036
- Introduction / Key Findings
- Historical Market Size Value (USD Million) Analysis By Source Pathway, 2021 to 2025
- Current and Future Market Size Value (USD Million) Analysis and Forecast By Source Pathway, 2026 to 2036
- Semi-Synthetic Vincamine and Tabersonine Extraction
- Total Synthetic Indole Alkaloid Synthesis
- Voacanga africana Seed Alkaloid Esterification
- Vinca minor Leaf Alkaloid Derivatization
- Y-o-Y Growth Trend Analysis By Source Pathway, 2021 to 2025
- Absolute $ Opportunity Analysis By Source Pathway, 2026 to 2036
- Global Market Analysis and Forecast, By Distribution Channel, 2021 to 2036
- Introduction / Key Findings
- Historical Market Size Value (USD Million) Analysis By Distribution Channel, 2021 to 2025
- Current and Future Market Size Value (USD Million) Analysis and Forecast By Distribution Channel, 2026 to 2036
- Hospital and Outpatient Neurology Pharmacies
- Retail Health Stores and OTC Pharmacies
- Direct-to-Consumer e-Commerce Portals
- Bulk Pharmaceutical API B2B Contracts
- Y-o-Y Growth Trend Analysis By Distribution Channel, 2021 to 2025
- Absolute $ Opportunity Analysis By Distribution Channel, 2026 to 2036
- Global Market Analysis and Forecast, By Region, 2021 to 2036
- Introduction
- Historical Market Size Value (USD Million) Analysis By Region, 2021 to 2025
- Current Market Size Value (USD Million) Analysis and Forecast By Region, 2026 to 2036
- North America
- Latin America
- Western Europe
- Eastern Europe
- East Asia
- South Asia and Pacific
- Middle East and Africa
- Market Attractiveness Analysis By Region
- North America Market Analysis and Forecast, By Country, 2021 to 2036
- Historical Market Size Value (USD Million) Trend Analysis By Market Taxonomy, 2021 to 2025
- Market Size Value (USD Million) Forecast By Market Taxonomy, 2026 to 2036
- By Country
- United States
- Canada
- By Regulatory Channel
- By Dosage Form
- By Clinical Application
- By Source Pathway
- By Distribution Channel
- By Country
- Market Attractiveness Analysis
- By Country
- By Regulatory Channel
- By Dosage Form
- By Clinical Application
- By Source Pathway
- By Distribution Channel
- Key Takeaways
- Latin America Market Analysis and Forecast, By Country
- Historical Market Size Value (USD Million) Trend Analysis By Market Taxonomy, 2021 to 2025
- Market Size Value (USD Million) Forecast By Market Taxonomy, 2026 to 2036
- By Country
- Brazil
- Mexico
- Argentina
- Chile
- By Regulatory Channel
- By Dosage Form
- By Clinical Application
- By Source Pathway
- By Distribution Channel
- By Country
- Market Attractiveness Analysis
- By Country
- By Regulatory Channel
- By Dosage Form
- By Clinical Application
- By Source Pathway
- By Distribution Channel
- Key Takeaways
- Western Europe Market Analysis and Forecast, By Country
- Historical Market Size Value (USD Million) Trend Analysis By Market Taxonomy, 2021 to 2025
- Market Size Value (USD Million) Forecast By Market Taxonomy, 2026 to 2036
- By Country
- Germany
- France
- United Kingdom
- Italy
- Spain
- Benelux
- Nordics
- By Regulatory Channel
- By Dosage Form
- By Clinical Application
- By Source Pathway
- By Distribution Channel
- By Country
- Market Attractiveness Analysis
- By Country
- By Regulatory Channel
- By Dosage Form
- By Clinical Application
- By Source Pathway
- By Distribution Channel
- Key Takeaways
- Eastern Europe Market Analysis and Forecast, By Country
- Historical Market Size Value (USD Million) Trend Analysis By Market Taxonomy, 2021 to 2025
- Market Size Value (USD Million) Forecast By Market Taxonomy, 2026 to 2036
- By Country
- Poland
- Czech Republic
- Romania
- Hungary
- By Regulatory Channel
- By Dosage Form
- By Clinical Application
- By Source Pathway
- By Distribution Channel
- By Country
- Market Attractiveness Analysis
- By Country
- By Regulatory Channel
- By Dosage Form
- By Clinical Application
- By Source Pathway
- By Distribution Channel
- Key Takeaways
- East Asia Market Analysis and Forecast, By Country
- Historical Market Size Value (USD Million) Trend Analysis By Market Taxonomy, 2021 to 2025
- Market Size Value (USD Million) Forecast By Market Taxonomy, 2026 to 2036
- By Country
- China
- Japan
- South Korea
- By Regulatory Channel
- By Dosage Form
- By Clinical Application
- By Source Pathway
- By Distribution Channel
- By Country
- Market Attractiveness Analysis
- By Country
- By Regulatory Channel
- By Dosage Form
- By Clinical Application
- By Source Pathway
- By Distribution Channel
- Key Takeaways
- South Asia and Pacific Market Analysis and Forecast, By Country
- Historical Market Size Value (USD Million) Trend Analysis By Market Taxonomy, 2021 to 2025
- Market Size Value (USD Million) Forecast By Market Taxonomy, 2026 to 2036
- By Country
- India
- ASEAN
- Australia and New Zealand
- By Regulatory Channel
- By Dosage Form
- By Clinical Application
- By Source Pathway
- By Distribution Channel
- By Country
- Market Attractiveness Analysis
- By Country
- By Regulatory Channel
- By Dosage Form
- By Clinical Application
- By Source Pathway
- By Distribution Channel
- Key Takeaways
- Middle East and Africa Market Analysis and Forecast, By Country
- Historical Market Size Value (USD Million) Trend Analysis By Market Taxonomy, 2021 to 2025
- Market Size Value (USD Million) Forecast By Market Taxonomy, 2026 to 2036
- By Country
- GCC Countries
- South Africa
- Türkiye
- Israel
- By Regulatory Channel
- By Dosage Form
- By Clinical Application
- By Source Pathway
- By Distribution Channel
- By Country
- Market Attractiveness Analysis
- By Country
- By Regulatory Channel
- By Dosage Form
- By Clinical Application
- By Source Pathway
- By Distribution Channel
- Key Takeaways
- Key Countries Market Analysis
- United States
- Pricing Analysis
- Market Share Analysis, 2025
- By Regulatory Channel
- By Dosage Form
- By Clinical Application
- By Source Pathway
- By Distribution Channel
- Canada
- Pricing Analysis
- Market Share Analysis, 2025
- By Regulatory Channel
- By Dosage Form
- By Clinical Application
- By Source Pathway
- By Distribution Channel
- Mexico
- Pricing Analysis
- Market Share Analysis, 2025
- By Regulatory Channel
- By Dosage Form
- By Clinical Application
- By Source Pathway
- By Distribution Channel
- Brazil
- Pricing Analysis
- Market Share Analysis, 2025
- By Regulatory Channel
- By Dosage Form
- By Clinical Application
- By Source Pathway
- By Distribution Channel
- Chile
- Pricing Analysis
- Market Share Analysis, 2025
- By Regulatory Channel
- By Dosage Form
- By Clinical Application
- By Source Pathway
- By Distribution Channel
- Germany
- Pricing Analysis
- Market Share Analysis, 2025
- By Regulatory Channel
- By Dosage Form
- By Clinical Application
- By Source Pathway
- By Distribution Channel
- United Kingdom
- Pricing Analysis
- Market Share Analysis, 2025
- By Regulatory Channel
- By Dosage Form
- By Clinical Application
- By Source Pathway
- By Distribution Channel
- Italy
- Pricing Analysis
- Market Share Analysis, 2025
- By Regulatory Channel
- By Dosage Form
- By Clinical Application
- By Source Pathway
- By Distribution Channel
- Spain
- Pricing Analysis
- Market Share Analysis, 2025
- By Regulatory Channel
- By Dosage Form
- By Clinical Application
- By Source Pathway
- By Distribution Channel
- France
- Pricing Analysis
- Market Share Analysis, 2025
- By Regulatory Channel
- By Dosage Form
- By Clinical Application
- By Source Pathway
- By Distribution Channel
- India
- Pricing Analysis
- Market Share Analysis, 2025
- By Regulatory Channel
- By Dosage Form
- By Clinical Application
- By Source Pathway
- By Distribution Channel
- ASEAN
- Pricing Analysis
- Market Share Analysis, 2025
- By Regulatory Channel
- By Dosage Form
- By Clinical Application
- By Source Pathway
- By Distribution Channel
- Australia and New Zealand
- Pricing Analysis
- Market Share Analysis, 2025
- By Regulatory Channel
- By Dosage Form
- By Clinical Application
- By Source Pathway
- By Distribution Channel
- China
- Pricing Analysis
- Market Share Analysis, 2025
- By Regulatory Channel
- By Dosage Form
- By Clinical Application
- By Source Pathway
- By Distribution Channel
- Japan
- Pricing Analysis
- Market Share Analysis, 2025
- By Regulatory Channel
- By Dosage Form
- By Clinical Application
- By Source Pathway
- By Distribution Channel
- South Korea
- Pricing Analysis
- Market Share Analysis, 2025
- By Regulatory Channel
- By Dosage Form
- By Clinical Application
- By Source Pathway
- By Distribution Channel
- Poland
- Pricing Analysis
- Market Share Analysis, 2025
- By Regulatory Channel
- By Dosage Form
- By Clinical Application
- By Source Pathway
- By Distribution Channel
- Hungary
- Pricing Analysis
- Market Share Analysis, 2025
- By Regulatory Channel
- By Dosage Form
- By Clinical Application
- By Source Pathway
- By Distribution Channel
- Türkiye
- Pricing Analysis
- Market Share Analysis, 2025
- By Regulatory Channel
- By Dosage Form
- By Clinical Application
- By Source Pathway
- By Distribution Channel
- South Africa
- Pricing Analysis
- Market Share Analysis, 2025
- By Regulatory Channel
- By Dosage Form
- By Clinical Application
- By Source Pathway
- By Distribution Channel
- United States
- Market Structure Analysis
- Competition Dashboard
- Competition Benchmarking
- Market Share Analysis of Top Players
- By Regional
- By Regulatory Channel
- By Dosage Form
- By Clinical Application
- By Source Pathway
- By Distribution Channel
- Emerging Startups
- Innovation Benchmarking
- Competition Analysis
- Competition Deep Dive
- Gedeon Richter Plc
- Overview
- Product Portfolio
- Profitability by Market Segments
- Sales Footprint
- Strategy Overview
- Marketing Strategy
- Product Strategy
- Channel Strategy
- Covex S.A.
- Linnea SA
- Alchem International
- Jarrow Formulas, Inc.
- Life Extension Foundation
- Swanson Health Products
- Northeast Pharmaceutical
- Source Naturals, Inc.
- Nutricost
- Northeast Pharmaceutical Group Co., Ltd.
- Alchem International Pvt. Ltd
- Gedeon Richter Plc
- Case Studies
- Success Stories
- Recent Developments
- Competition Deep Dive
- Assumptions & Acronyms Used
List of Tables
- Table 1: Global Market Value (USD Million) Forecast by Region, 2021 to 2036
- Table 2: Global Market Value (USD Million) Forecast by Regulatory Channel, 2021 to 2036
- Table 3: Global Market Value (USD Million) Forecast by Dosage Form, 2021 to 2036
- Table 4: Global Market Value (USD Million) Forecast by Clinical Application, 2021 to 2036
- Table 5: Global Market Value (USD Million) Forecast by Source Pathway, 2021 to 2036
- Table 6: Global Market Value (USD Million) Forecast by Distribution Channel, 2021 to 2036
- Table 7: North America Market Value (USD Million) Forecast by Country, 2021 to 2036
- Table 8: North America Market Value (USD Million) Forecast by Regulatory Channel, 2021 to 2036
- Table 9: North America Market Value (USD Million) Forecast by Dosage Form, 2021 to 2036
- Table 10: North America Market Value (USD Million) Forecast by Clinical Application, 2021 to 2036
- Table 11: North America Market Value (USD Million) Forecast by Source Pathway, 2021 to 2036
- Table 12: North America Market Value (USD Million) Forecast by Distribution Channel, 2021 to 2036
- Table 13: Latin America Market Value (USD Million) Forecast by Country, 2021 to 2036
- Table 14: Latin America Market Value (USD Million) Forecast by Regulatory Channel, 2021 to 2036
- Table 15: Latin America Market Value (USD Million) Forecast by Dosage Form, 2021 to 2036
- Table 16: Latin America Market Value (USD Million) Forecast by Clinical Application, 2021 to 2036
- Table 17: Latin America Market Value (USD Million) Forecast by Source Pathway, 2021 to 2036
- Table 18: Latin America Market Value (USD Million) Forecast by Distribution Channel, 2021 to 2036
- Table 19: Western Europe Market Value (USD Million) Forecast by Country, 2021 to 2036
- Table 20: Western Europe Market Value (USD Million) Forecast by Regulatory Channel, 2021 to 2036
- Table 21: Western Europe Market Value (USD Million) Forecast by Dosage Form, 2021 to 2036
- Table 22: Western Europe Market Value (USD Million) Forecast by Clinical Application, 2021 to 2036
- Table 23: Western Europe Market Value (USD Million) Forecast by Source Pathway, 2021 to 2036
- Table 24: Western Europe Market Value (USD Million) Forecast by Distribution Channel, 2021 to 2036
- Table 25: Eastern Europe Market Value (USD Million) Forecast by Country, 2021 to 2036
- Table 26: Eastern Europe Market Value (USD Million) Forecast by Regulatory Channel, 2021 to 2036
- Table 27: Eastern Europe Market Value (USD Million) Forecast by Dosage Form, 2021 to 2036
- Table 28: Eastern Europe Market Value (USD Million) Forecast by Clinical Application, 2021 to 2036
- Table 29: Eastern Europe Market Value (USD Million) Forecast by Source Pathway, 2021 to 2036
- Table 30: Eastern Europe Market Value (USD Million) Forecast by Distribution Channel, 2021 to 2036
- Table 31: East Asia Market Value (USD Million) Forecast by Country, 2021 to 2036
- Table 32: East Asia Market Value (USD Million) Forecast by Regulatory Channel, 2021 to 2036
- Table 33: East Asia Market Value (USD Million) Forecast by Dosage Form, 2021 to 2036
- Table 34: East Asia Market Value (USD Million) Forecast by Clinical Application, 2021 to 2036
- Table 35: East Asia Market Value (USD Million) Forecast by Source Pathway, 2021 to 2036
- Table 36: East Asia Market Value (USD Million) Forecast by Distribution Channel, 2021 to 2036
- Table 37: South Asia and Pacific Market Value (USD Million) Forecast by Country, 2021 to 2036
- Table 38: South Asia and Pacific Market Value (USD Million) Forecast by Regulatory Channel, 2021 to 2036
- Table 39: South Asia and Pacific Market Value (USD Million) Forecast by Dosage Form, 2021 to 2036
- Table 40: South Asia and Pacific Market Value (USD Million) Forecast by Clinical Application, 2021 to 2036
- Table 41: South Asia and Pacific Market Value (USD Million) Forecast by Source Pathway, 2021 to 2036
- Table 42: South Asia and Pacific Market Value (USD Million) Forecast by Distribution Channel, 2021 to 2036
- Table 43: Middle East and Africa Market Value (USD Million) Forecast by Country, 2021 to 2036
- Table 44: Middle East and Africa Market Value (USD Million) Forecast by Regulatory Channel, 2021 to 2036
- Table 45: Middle East and Africa Market Value (USD Million) Forecast by Dosage Form, 2021 to 2036
- Table 46: Middle East and Africa Market Value (USD Million) Forecast by Clinical Application, 2021 to 2036
- Table 47: Middle East and Africa Market Value (USD Million) Forecast by Source Pathway, 2021 to 2036
- Table 48: Middle East and Africa Market Value (USD Million) Forecast by Distribution Channel, 2021 to 2036
List of Figures
- Figure 1: Global Market Pricing Analysis
- Figure 2: Global Market Value (USD Million) Forecast 2021-2036
- Figure 3: Global Market Value Share and BPS Analysis by Regulatory Channel, 2026 and 2036
- Figure 4: Global Market Y-o-Y Growth Comparison by Regulatory Channel, 2026-2036
- Figure 5: Global Market Attractiveness Analysis by Regulatory Channel
- Figure 6: Global Market Value Share and BPS Analysis by Dosage Form, 2026 and 2036
- Figure 7: Global Market Y-o-Y Growth Comparison by Dosage Form, 2026-2036
- Figure 8: Global Market Attractiveness Analysis by Dosage Form
- Figure 9: Global Market Value Share and BPS Analysis by Clinical Application, 2026 and 2036
- Figure 10: Global Market Y-o-Y Growth Comparison by Clinical Application, 2026-2036
- Figure 11: Global Market Attractiveness Analysis by Clinical Application
- Figure 12: Global Market Value Share and BPS Analysis by Source Pathway, 2026 and 2036
- Figure 13: Global Market Y-o-Y Growth Comparison by Source Pathway, 2026-2036
- Figure 14: Global Market Attractiveness Analysis by Source Pathway
- Figure 15: Global Market Value Share and BPS Analysis by Distribution Channel, 2026 and 2036
- Figure 16: Global Market Y-o-Y Growth Comparison by Distribution Channel, 2026-2036
- Figure 17: Global Market Attractiveness Analysis by Distribution Channel
- Figure 18: Global Market Value (USD Million) Share and BPS Analysis by Region, 2026 and 2036
- Figure 19: Global Market Y-o-Y Growth Comparison by Region, 2026-2036
- Figure 20: Global Market Attractiveness Analysis by Region
- Figure 21: North America Market Incremental Dollar Opportunity, 2026-2036
- Figure 22: Latin America Market Incremental Dollar Opportunity, 2026-2036
- Figure 23: Western Europe Market Incremental Dollar Opportunity, 2026-2036
- Figure 24: Eastern Europe Market Incremental Dollar Opportunity, 2026-2036
- Figure 25: East Asia Market Incremental Dollar Opportunity, 2026-2036
- Figure 26: South Asia and Pacific Market Incremental Dollar Opportunity, 2026-2036
- Figure 27: Middle East and Africa Market Incremental Dollar Opportunity, 2026-2036
- Figure 28: North America Market Value Share and BPS Analysis by Country, 2026 and 2036
- Figure 29: North America Market Value Share and BPS Analysis by Regulatory Channel, 2026 and 2036
- Figure 30: North America Market Y-o-Y Growth Comparison by Regulatory Channel, 2026-2036
- Figure 31: North America Market Attractiveness Analysis by Regulatory Channel
- Figure 32: North America Market Value Share and BPS Analysis by Dosage Form, 2026 and 2036
- Figure 33: North America Market Y-o-Y Growth Comparison by Dosage Form, 2026-2036
- Figure 34: North America Market Attractiveness Analysis by Dosage Form
- Figure 35: North America Market Value Share and BPS Analysis by Clinical Application, 2026 and 2036
- Figure 36: North America Market Y-o-Y Growth Comparison by Clinical Application, 2026-2036
- Figure 37: North America Market Attractiveness Analysis by Clinical Application
- Figure 38: North America Market Value Share and BPS Analysis by Source Pathway, 2026 and 2036
- Figure 39: North America Market Y-o-Y Growth Comparison by Source Pathway, 2026-2036
- Figure 40: North America Market Attractiveness Analysis by Source Pathway
- Figure 41: North America Market Value Share and BPS Analysis by Distribution Channel, 2026 and 2036
- Figure 42: North America Market Y-o-Y Growth Comparison by Distribution Channel, 2026-2036
- Figure 43: North America Market Attractiveness Analysis by Distribution Channel
- Figure 44: Latin America Market Value Share and BPS Analysis by Country, 2026 and 2036
- Figure 45: Latin America Market Value Share and BPS Analysis by Regulatory Channel, 2026 and 2036
- Figure 46: Latin America Market Y-o-Y Growth Comparison by Regulatory Channel, 2026-2036
- Figure 47: Latin America Market Attractiveness Analysis by Regulatory Channel
- Figure 48: Latin America Market Value Share and BPS Analysis by Dosage Form, 2026 and 2036
- Figure 49: Latin America Market Y-o-Y Growth Comparison by Dosage Form, 2026-2036
- Figure 50: Latin America Market Attractiveness Analysis by Dosage Form
- Figure 51: Latin America Market Value Share and BPS Analysis by Clinical Application, 2026 and 2036
- Figure 52: Latin America Market Y-o-Y Growth Comparison by Clinical Application, 2026-2036
- Figure 53: Latin America Market Attractiveness Analysis by Clinical Application
- Figure 54: Latin America Market Value Share and BPS Analysis by Source Pathway, 2026 and 2036
- Figure 55: Latin America Market Y-o-Y Growth Comparison by Source Pathway, 2026-2036
- Figure 56: Latin America Market Attractiveness Analysis by Source Pathway
- Figure 57: Latin America Market Value Share and BPS Analysis by Distribution Channel, 2026 and 2036
- Figure 58: Latin America Market Y-o-Y Growth Comparison by Distribution Channel, 2026-2036
- Figure 59: Latin America Market Attractiveness Analysis by Distribution Channel
- Figure 60: Western Europe Market Value Share and BPS Analysis by Country, 2026 and 2036
- Figure 61: Western Europe Market Value Share and BPS Analysis by Regulatory Channel, 2026 and 2036
- Figure 62: Western Europe Market Y-o-Y Growth Comparison by Regulatory Channel, 2026-2036
- Figure 63: Western Europe Market Attractiveness Analysis by Regulatory Channel
- Figure 64: Western Europe Market Value Share and BPS Analysis by Dosage Form, 2026 and 2036
- Figure 65: Western Europe Market Y-o-Y Growth Comparison by Dosage Form, 2026-2036
- Figure 66: Western Europe Market Attractiveness Analysis by Dosage Form
- Figure 67: Western Europe Market Value Share and BPS Analysis by Clinical Application, 2026 and 2036
- Figure 68: Western Europe Market Y-o-Y Growth Comparison by Clinical Application, 2026-2036
- Figure 69: Western Europe Market Attractiveness Analysis by Clinical Application
- Figure 70: Western Europe Market Value Share and BPS Analysis by Source Pathway, 2026 and 2036
- Figure 71: Western Europe Market Y-o-Y Growth Comparison by Source Pathway, 2026-2036
- Figure 72: Western Europe Market Attractiveness Analysis by Source Pathway
- Figure 73: Western Europe Market Value Share and BPS Analysis by Distribution Channel, 2026 and 2036
- Figure 74: Western Europe Market Y-o-Y Growth Comparison by Distribution Channel, 2026-2036
- Figure 75: Western Europe Market Attractiveness Analysis by Distribution Channel
- Figure 76: Eastern Europe Market Value Share and BPS Analysis by Country, 2026 and 2036
- Figure 77: Eastern Europe Market Value Share and BPS Analysis by Regulatory Channel, 2026 and 2036
- Figure 78: Eastern Europe Market Y-o-Y Growth Comparison by Regulatory Channel, 2026-2036
- Figure 79: Eastern Europe Market Attractiveness Analysis by Regulatory Channel
- Figure 80: Eastern Europe Market Value Share and BPS Analysis by Dosage Form, 2026 and 2036
- Figure 81: Eastern Europe Market Y-o-Y Growth Comparison by Dosage Form, 2026-2036
- Figure 82: Eastern Europe Market Attractiveness Analysis by Dosage Form
- Figure 83: Eastern Europe Market Value Share and BPS Analysis by Clinical Application, 2026 and 2036
- Figure 84: Eastern Europe Market Y-o-Y Growth Comparison by Clinical Application, 2026-2036
- Figure 85: Eastern Europe Market Attractiveness Analysis by Clinical Application
- Figure 86: Eastern Europe Market Value Share and BPS Analysis by Source Pathway, 2026 and 2036
- Figure 87: Eastern Europe Market Y-o-Y Growth Comparison by Source Pathway, 2026-2036
- Figure 88: Eastern Europe Market Attractiveness Analysis by Source Pathway
- Figure 89: Eastern Europe Market Value Share and BPS Analysis by Distribution Channel, 2026 and 2036
- Figure 90: Eastern Europe Market Y-o-Y Growth Comparison by Distribution Channel, 2026-2036
- Figure 91: Eastern Europe Market Attractiveness Analysis by Distribution Channel
- Figure 92: East Asia Market Value Share and BPS Analysis by Country, 2026 and 2036
- Figure 93: East Asia Market Value Share and BPS Analysis by Regulatory Channel, 2026 and 2036
- Figure 94: East Asia Market Y-o-Y Growth Comparison by Regulatory Channel, 2026-2036
- Figure 95: East Asia Market Attractiveness Analysis by Regulatory Channel
- Figure 96: East Asia Market Value Share and BPS Analysis by Dosage Form, 2026 and 2036
- Figure 97: East Asia Market Y-o-Y Growth Comparison by Dosage Form, 2026-2036
- Figure 98: East Asia Market Attractiveness Analysis by Dosage Form
- Figure 99: East Asia Market Value Share and BPS Analysis by Clinical Application, 2026 and 2036
- Figure 100: East Asia Market Y-o-Y Growth Comparison by Clinical Application, 2026-2036
- Figure 101: East Asia Market Attractiveness Analysis by Clinical Application
- Figure 102: East Asia Market Value Share and BPS Analysis by Source Pathway, 2026 and 2036
- Figure 103: East Asia Market Y-o-Y Growth Comparison by Source Pathway, 2026-2036
- Figure 104: East Asia Market Attractiveness Analysis by Source Pathway
- Figure 105: East Asia Market Value Share and BPS Analysis by Distribution Channel, 2026 and 2036
- Figure 106: East Asia Market Y-o-Y Growth Comparison by Distribution Channel, 2026-2036
- Figure 107: East Asia Market Attractiveness Analysis by Distribution Channel
- Figure 108: South Asia and Pacific Market Value Share and BPS Analysis by Country, 2026 and 2036
- Figure 109: South Asia and Pacific Market Value Share and BPS Analysis by Regulatory Channel, 2026 and 2036
- Figure 110: South Asia and Pacific Market Y-o-Y Growth Comparison by Regulatory Channel, 2026-2036
- Figure 111: South Asia and Pacific Market Attractiveness Analysis by Regulatory Channel
- Figure 112: South Asia and Pacific Market Value Share and BPS Analysis by Dosage Form, 2026 and 2036
- Figure 113: South Asia and Pacific Market Y-o-Y Growth Comparison by Dosage Form, 2026-2036
- Figure 114: South Asia and Pacific Market Attractiveness Analysis by Dosage Form
- Figure 115: South Asia and Pacific Market Value Share and BPS Analysis by Clinical Application, 2026 and 2036
- Figure 116: South Asia and Pacific Market Y-o-Y Growth Comparison by Clinical Application, 2026-2036
- Figure 117: South Asia and Pacific Market Attractiveness Analysis by Clinical Application
- Figure 118: South Asia and Pacific Market Value Share and BPS Analysis by Source Pathway, 2026 and 2036
- Figure 119: South Asia and Pacific Market Y-o-Y Growth Comparison by Source Pathway, 2026-2036
- Figure 120: South Asia and Pacific Market Attractiveness Analysis by Source Pathway
- Figure 121: South Asia and Pacific Market Value Share and BPS Analysis by Distribution Channel, 2026 and 2036
- Figure 122: South Asia and Pacific Market Y-o-Y Growth Comparison by Distribution Channel, 2026-2036
- Figure 123: South Asia and Pacific Market Attractiveness Analysis by Distribution Channel
- Figure 124: Middle East and Africa Market Value Share and BPS Analysis by Country, 2026 and 2036
- Figure 125: Middle East and Africa Market Value Share and BPS Analysis by Regulatory Channel, 2026 and 2036
- Figure 126: Middle East and Africa Market Y-o-Y Growth Comparison by Regulatory Channel, 2026-2036
- Figure 127: Middle East and Africa Market Attractiveness Analysis by Regulatory Channel
- Figure 128: Middle East and Africa Market Value Share and BPS Analysis by Dosage Form, 2026 and 2036
- Figure 129: Middle East and Africa Market Y-o-Y Growth Comparison by Dosage Form, 2026-2036
- Figure 130: Middle East and Africa Market Attractiveness Analysis by Dosage Form
- Figure 131: Middle East and Africa Market Value Share and BPS Analysis by Clinical Application, 2026 and 2036
- Figure 132: Middle East and Africa Market Y-o-Y Growth Comparison by Clinical Application, 2026-2036
- Figure 133: Middle East and Africa Market Attractiveness Analysis by Clinical Application
- Figure 134: Middle East and Africa Market Value Share and BPS Analysis by Source Pathway, 2026 and 2036
- Figure 135: Middle East and Africa Market Y-o-Y Growth Comparison by Source Pathway, 2026-2036
- Figure 136: Middle East and Africa Market Attractiveness Analysis by Source Pathway
- Figure 137: Middle East and Africa Market Value Share and BPS Analysis by Distribution Channel, 2026 and 2036
- Figure 138: Middle East and Africa Market Y-o-Y Growth Comparison by Distribution Channel, 2026-2036
- Figure 139: Middle East and Africa Market Attractiveness Analysis by Distribution Channel
- Figure 140: Global Market - Tier Structure Analysis
- Figure 141: Global Market - Company Share Analysis
Frequently Asked Questions
How big is the vinpocetine market in 2026 and what is forecast for 2036?
Global vinpocetine valuation advanced from USD 184.5 million in 2025 to USD 194.8 million in 2026. Total category value is forecast to reach USD 335.9 million by 2036 as geriatric neurology clinics expand post-stroke and vascular dementia prescriptions.
What is the CAGR for the vinpocetine market from 2026 to 2036?
Vinpocetine valuation is slated to grow at a 5.6% annual pace from 2026 through 2036, creating USD 141.1 million in incremental category value over ten years.
Which regulatory channel segment leads the vinpocetine market?
Prescription Cerebrovascular Cavinton and Generic Tablets hold 58.6% of regulatory channel demand in 2026 because hospital and outpatient formularies across Central Europe and East Asia reimburse oral and parenteral ethyl apovincaminate.
Which dosage form segment leads the vinpocetine market?
Oral 5 mg and 10 mg Compressed Tablets represent 64.4% of the dosage form category in 2026 as chronic post-stroke and vascular cognitive impairment patients take 15 mg to 30 mg daily maintenance regimens.
Which country has a notable growth outlook during the assessment period?
South Korea tops national vinpocetine growth rankings at a 6.3% CAGR through 2036 on rapid demographic aging and outpatient cerebrovascular plus tinnitus prescribing.
Who are the key players in the market?
Gedeon Richter Plc and Covex S.A. with Linnea SA and Alchem International Pvt. Ltd plus Northeast Pharmaceutical Group lead pharmaceutical supply. Jarrow Formulas Inc. and Life Extension Foundation with Swanson Health Products plus Source Naturals and Nutricost lead supplement channels.
Preview the report firsthand - request a free sample
Get SampleGet the brochure for pricing and purchase details.
Get PDF
