The 1,2-ethanedithiol market reaches USD 13.9 million in 2025 and is expected to expand to USD 23.5 million by 2035, with a CAGR of 5.4%. Between 2021 and 2025, the market grows from USD 10.7 million to USD 13.9 million, passing through increments of USD 11.2 million, USD 11.8 million, USD 12.5 million, and USD 13.2 million. This early phase of growth is driven by increased demand in chemical manufacturing and pharmaceutical applications, where 1,2-ethanedithiol is used as a reagent and in the synthesis of specialty chemicals. The steady YoY growth reflects the rising need for high-purity chemicals, coupled with their applications in petrochemical industries, which see incremental value addition in product development.
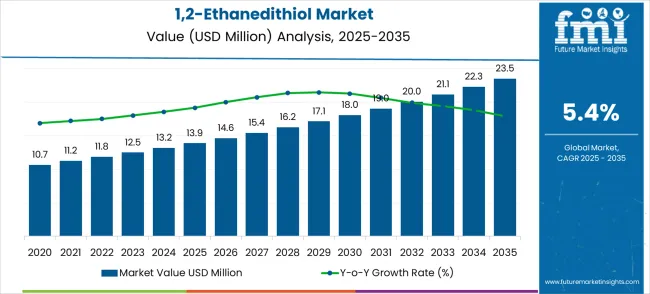
Between 2026 and 2030, the market continues its upward trajectory, advancing from USD 13.9 million to USD 18.0 million. During this phase, values rise through USD 14.6 million, 15.4 million, 16.2 million, and 17.1 million, as the use of 1,2-ethanedithiol expands across new industries such as electronics and automotive, where it is used in corrosion resistance applications. The demand for highly specialized chemicals also bolsters this growth. The market experiences further expansion between 2031 and 2035, moving from USD 18.0 million to USD 23.5 million, with intermediate values of USD 19.0 million, USD 20.0 million, USD 21.1 million, and USD 22.3 million, reflecting stronger industry adoption and increased use in various sectors, including agrochemicals, supporting its consistent YoY growth pattern.
| Metric | Value |
|---|---|
| Estimated Value in (2025E) | USD 13.9 million |
| Forecast Value in (2035F) | USD 23.5 million |
| Forecast CAGR (2025 to 2035) | 5.4% |
The chemical manufacturing market contributes about 25-30%, as 1,2-Ethanedithiol is used as a reagent in various chemical processes, including in the production of specialty chemicals. The petrochemicals market adds roughly 18-22%, where the compound plays a role in the synthesis of sulfur-containing compounds, fuel additives, and petrochemical products. The agriculture and pesticides market provides approximately 12-15%, driven by the use of 1,2-Ethanedithiol in pesticide and fungicide synthesis, boosting demand in crop protection. The flavors and fragrances market accounts for about 8-10%, as the compound is employed for its characteristic sulfurous odor in the creation of specific flavors and fragrances, adding a distinctive note to some food and perfume products. The oil and gas market supplies another 6-8%, where 1,2-Ethanedithiol is used as an odorant for natural gas, ensuring leak detection and safety across gas distribution networks.
Market expansion is being supported by the increasing demand for specialized organic synthesis applications and the corresponding need for high-quality chemical intermediates that can deliver consistent synthetic performance. Modern pharmaceutical and fine chemical manufacturers are increasingly focused on specialty chemicals that can provide reliable reaction outcomes, minimize side products, and enable efficient synthetic processes. The proven effectiveness of 1,2-ethanedithiol as a versatile building block and protecting group reagent makes it an essential component of competitive chemical synthesis operations.
The growing emphasis on pharmaceutical research and fine chemical manufacturing is driving demand for advanced chemical intermediates that address complex synthesis requirements and quality specifications. Chemical industry preference for specialty chemicals that combine high purity with consistent performance is creating opportunities for innovative product development. The rising influence of regulatory compliance and quality assurance standards is also contributing to increased adoption of proven high-purity 1,2-ethanedithiol across different synthesis applications and manufacturing environments.
The 1,2-ethanedithiol market is set for steady growth through 2035, supported by rising demand from pharmaceuticals, fine chemicals, and specialty synthesis sectors. As companies emphasize cost-effective synthesis, regulatory compliance, and green chemical practices, EDT is positioned not just as a niche intermediate but as a strategic enabler of modern chemical manufacturing.
Expanding pharmaceutical R&D, increasing fine chemical production, and growing emphasis on green chemistry are shaping demand. Pathways such as purity optimization, technology integration, application diversification, and geographic expansion represent the strongest growth levers.
Pharma and fine chemical players demand consistent, certified purity grades. The 98% purity segment already dominates, but premium ≥99% grades for advanced synthesis and biologics present an upside pool of USD 400–700 million, especially as regulators demand reproducibility and global supply chains require validated intermediates.
Currently, organic synthesis drives 68% of demand. Expanding EDT use into specialty polymers, catalyst design, petrochemical processing, and advanced materials opens new pools. With technology validation, this pathway could generate USD 600–900 million in incremental opportunity.
Innovation in purification and handling safer formulations, improved storage stability, greener synthesis of EDT can unlock new end-users who avoid EDT today due to volatility or compliance concerns. This environmental responsibility-led technology adoption may create USD 350–600 million in additional value.
Asia-Pacific (China, India) drives current growth, but establishing localized production hubs in Latin America, Middle East, and Africa would reduce logistics risk and improve access for local pharmaceutical and chemical sectors. Expected upside: USD 700 million–1.1 billion in new volume growth.
Global chemical frameworks are adopting green chemistry mandates, driving the demand for intermediates that enable efficient, low-waste synthesis. EDT’s role in protection–deprotection and selectivity optimization aligns with eco-friendly practices-driven synthesis. Companies innovating with recyclable solvents, low-energy purification, and safer formulations could capture USD 300–500 million in environmental responsibility-driven premiums
Collaborations with global pharma and fine chemical firms to co-develop optimized synthesis routes using EDT can secure long-term supply contracts. With contract manufacturing organizations (CMOs/CDMOs) scaling up, this represents USD 500–800 million opportunity through embedded demand.
Handling and regulatory challenges currently restrain EDT. Suppliers who provide stabilized formulations, certified safety protocols, and advanced packaging can unlock hesitant markets, especially smaller manufacturers. This could generate USD 400–650 million in incremental adoption.
The market is segmented by purity grade, application, and region. By purity grade, the market is divided into purity 98%, purity 99%, and others. Based on application, the market is categorized into organic synthesis and pharmaceutical synthesis. Regionally, the market is divided into North America, Europe, East Asia, South Asia & Pacific, Latin America, and Middle East & Africa.
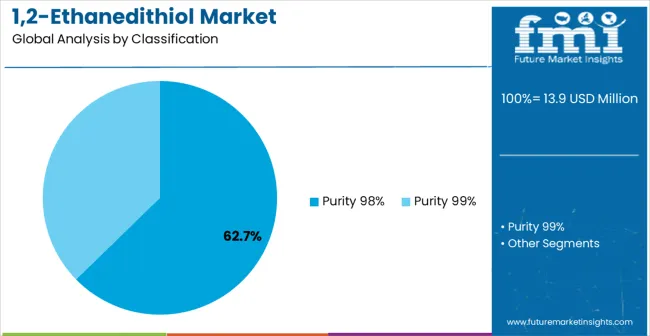
The 98% purity grade segment dominates the 1,2-ethanedithiol market, projected to account for 62.7% share in 2025, reflecting its unrivaled balance of cost, performance, and scalability. Chemical synthesis professionals consistently prioritize this grade because it provides the optimal middle ground between ultra-high-purity formulations, which are often prohibitively expensive, and lower-purity alternatives that may compromise reaction efficiency. For most commercial applications, particularly in large-scale chemical manufacturing, 98% purity has emerged as the “gold standard” because it ensures reliable outcomes in diverse reaction pathways without imposing excessive raw material costs. This level of purity is sufficient to minimize unwanted side reactions, thereby reducing purification expenses and boosting overall process efficiency.
Technical validation studies across multiple end-user industries including pharmaceuticals, fine chemicals, and materials science demonstrate that 98% purity delivers consistent and reproducible results under varied conditions. The segment’s dominance is also reinforced by its widespread regulatory acceptance and availability through established supply chains, making it the most accessible grade for industrial users. As global manufacturing strategies increasingly emphasize both cost optimization and quality assurance, the 98% grade is positioned as the cornerstone of commercial synthesis operations. Its broad applicability ensures it will remain the primary growth driver within the 1,2-ethanedithiol market for the foreseeable future.
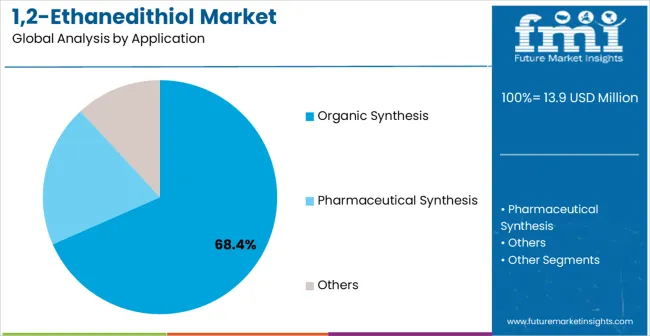
Organic synthesis is set to account for 68.4% of 1,2-ethanedithiol demand in 2025, underscoring its critical role as the primary application driving this specialty chemical’s consumption. As synthetic chemistry continues to evolve toward more complex molecular architectures particularly in pharmaceuticals, agrochemicals, and advanced materials the importance of reliable intermediates like 1,2-ethanedithiol grows proportionally. Its unique performance characteristics, including its role in protection–deprotection strategies and its strong coordination properties with metals, make it a versatile tool across diverse synthetic protocols. Researchers and process chemists value its ability to facilitate controlled reaction environments, thereby improving selectivity and yield in both exploratory laboratory research and large-scale production.
The expanding adoption of integrated synthesis approaches—where manufacturers streamline multiple reaction steps to maximize efficiency—further strengthens demand for 1,2-ethanedithiol. This compound provides the flexibility needed for modular synthesis, ensuring adaptability to various reaction pathways. The rising need for chemical intermediates that enhance process efficiency and reduce waste aligns perfectly with the functional profile of 1,2-ethanedithiol. As global industries shift toward more sophisticated and environmentally conscious production methodologies and organic synthesis applications will remain at the centre of demand, ensuring this segment continues to drive both volume growth and strategic importance within the specialty chemicals market.
The 1,2-ethanedithiol market is advancing steadily due to increasing demand for specialty chemical intermediates and growing adoption of advanced organic synthesis methodologies in pharmaceutical and fine chemical manufacturing. The market faces challenges including limited supplier base, handling and safety considerations, and concerns about storage stability and regulatory compliance requirements. Innovation in purification technologies and application development continue to influence product development and market expansion patterns.
The pharmaceutical industry’s push toward developing complex active pharmaceutical ingredients (APIs) is creating significant demand for versatile intermediates such as 1,2-ethanedithiol. This compound supports diverse reaction mechanisms required in drug synthesis, including protection–deprotection strategies and functional group transformations. Similarly, fine chemical manufacturers rely on intermediates that deliver both consistency and regulatory compliance in high-value synthesis. The ability of 1,2-ethanedithiol to offer reliable performance across these applications makes it integral to production pipelines. With rising R&D spending, increased biologically active compound development, and regulatory pressure on product purity, demand from pharmaceutical and fine chemical sectors continues to accelerate.
Safety, Storage, and Compliance Challenges Restrain Adoption.
Despite strong demand potential, the 1,2-ethanedithiol market faces notable constraints related to handling safety, storage stability, and strict compliance requirements. The compound is volatile and malodorous, requiring specialized containment systems, safety protocols, and trained personnel for safe usage. Storage stability concerns limit its shelf life, adding complexity to logistics and distribution. The environmental and occupational health regulations impose restrictions on usage and disposal, increasing operational costs for manufacturers. These challenges restrict wider adoption, particularly among smaller chemical enterprises with limited infrastructure, and reinforce dependence on a relatively small group of specialized suppliers who can meet stringent compliance standards.
The adoption of green chemistry principles is reshaping the specialty chemicals sector, including the 1,2-ethanedithiol market. Manufacturers are increasingly focusing on atom economy, process efficiency, and waste reduction to align with global environmental responsibility goals. 1,2-ethanedithiol’s role in enabling shorter, cleaner synthetic routes makes it attractive for eco-friendly applications. Companies are investing in advanced purification technologies to reduce impurities and enhance environmental compliance. The shift toward closed-loop chemical processes and green sourcing further strengthens market opportunities. As green chemistry evolves from optional to mandatory in regulatory frameworks, demand for intermediates that support cleaner synthesis will continue to grow.
| Country | CAGR (2025-2035) |
|---|---|
| China | 7.3% |
| India | 6.8% |
| Germany | 6.2% |
| Brazil | 5.7% |
| USA | 5.1% |
| UK | 4.6% |
| Japan | 4.1% |
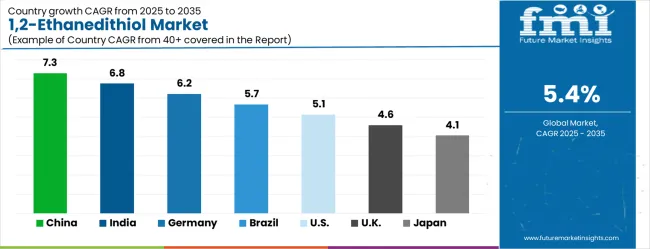
The 1,2-ethanedithiol market is experiencing varied growth globally, with China leading at a 7.3% CAGR through 2035, driven by expanding chemical manufacturing capacity, increasing pharmaceutical industry development, and growing demand for specialty chemical intermediates. India follows at 6.8%, supported by chemical industry expansion, increasing pharmaceutical manufacturing capabilities, and expanding fine chemical production infrastructure. Germany shows growth at 6.2%, emphasizing advanced chemical synthesis technologies and established pharmaceutical industry expertise. Brazil records 5.7% growth, focusing on improved chemical manufacturing infrastructure and pharmaceutical sector development. The USA shows 5.1% growth, representing a mature market with established specialty chemical companies and ongoing technology advancement initiatives.
The report provides an in-depth analysis of over 40 countries, with the top-performing countries highlighted below.
The 1,2-ethanedithiol market in China is projected to expand at a CAGR of 7.3% through 2035, making the country the single largest growth engine for global demand. This growth is primarily fuelled by China’s vast chemical manufacturing base, which is undergoing rapid modernization, and by the rising domestic need for high-quality specialty intermediates. The pharmaceutical sector is a central driver, with accelerated drug development pipelines creating demand for intermediates that ensure precision and regulatory compliance. At the same time, fine chemical producers are integrating advanced intermediates like 1,2-ethanedithiol into increasingly complex synthesis processes to enhance production efficiency. Multinational chemical corporations and domestic players are both scaling their presence by establishing local supply chains and manufacturing hubs, ensuring accessibility across industrial clusters in Jiangsu, Zhejiang, and Guangdong. Government programs encouraging pharmaceutical innovation, stricter regulatory standards, and investment in technology upgrading further reinforce demand. The dual strategy of exporting pharmaceuticals and strengthening local R&D centers ensures continued reliance on reliable intermediates.
The 1,2-ethanedithiol market in India is anticipated to grow at a CAGR of 6.8% through 2035, driven by the country’s rapidly expanding pharmaceutical sector and the adoption of advanced synthesis methodologies. The pharmaceutical industry in India, already the world’s largest supplier of generic drugs, is steadily transitioning into complex molecule development and biosimilars, which demand high-quality intermediates like 1,2-ethanedithiol. Domestic chemical manufacturers are investing in R&D capacity and advanced infrastructure to meet international standards, while multinational players are partnering with Indian firms through joint ventures and technology-transfer agreements. This is fostering broader access to specialty intermediates across the market. The government’s emphasis on self-reliance in pharmaceutical manufacturing, coupled with Production-Linked Incentive (PLI) schemes, ensures that specialty chemicals are prioritized for domestic availability. Infrastructure development in industrial corridors, along with modern laboratory investments, is also expanding the reach of advanced reagents. Growing export competitiveness is creating pressure to meet global quality standards, pushing manufacturers to adopt reliable intermediates that can support both regulatory compliance and production efficiency.
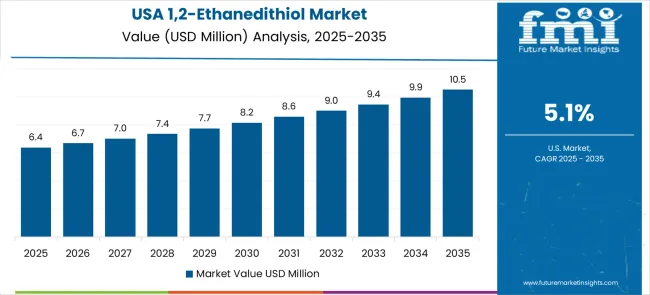
The United States remains a mature but strategically vital market for 1,2-ethanedithiol, with forecasted CAGR growth of 5.1% through 2035. The USA is characterized by its advanced chemical manufacturing infrastructure, strong R&D ecosystem, and a pharmaceutical industry that consistently drives demand for high-quality intermediates. American pharmaceutical and fine chemical companies utilize 1,2-ethanedithiol in synthesis processes that demand both reliability and regulatory compliance, particularly for innovative drug development pipelines. The USA also benefits from highly developed supply chains, ensuring stable distribution of specialty chemicals across academic institutions, biotech firms, and industrial manufacturers. Government-backed initiatives promoting domestic pharmaceutical resilience further reinforce steady demand. The country’s mature regulatory environment emphasizes quality, safety, and performance, aligning perfectly with intermediates that offer consistency. USA companies are early adopters of advanced synthetic technologies, including integrated green chemistry practices and modular synthesis platforms, which highlight the ongoing need for versatile intermediates. The USA also plays a central role in specialty chemical innovation, with companies investing heavily in purification, stability improvement, and eco-friendly synthesis routes.
The 1,2-ethanedithiol market in Brazil is expected to grow at a CAGR of 5.7% through 2035, reflecting the country’s emerging role as a regional hub for chemical and pharmaceutical production. Domestic demand is being shaped by investments in chemical infrastructure, modernization of pharmaceutical manufacturing facilities, and rising recognition of specialty chemical importance in high-quality synthesis. Brazilian companies are increasingly adopting specialty chemical intermediates to enhance manufacturing competitiveness in both domestic and export markets. This shift is supported by industrial development initiatives that encourage modernization and eco-friendly in chemical manufacturing practices. International companies are strengthening their presence in Brazil through partnerships with local firms, enabling technology transfer and access to advanced intermediates such as 1,2-ethanedithiol. The government’s focus on improving industrial self-sufficiency and scaling pharmaceutical production is creating fertile ground for specialty chemical utilization. The integration of research institutions with industrial manufacturing is fostering greater technical expertise, ensuring that adoption is not only demand-driven but also technically environmentally responsible. Brazil’s strategic geographic position also allows it to serve as a distribution hub for Latin America, amplifying its importance beyond domestic consumption. These combined factors position Brazil as a promising growth market, transitioning toward more sophisticated specialty chemical adoption.
The 1,2-ethanedithiol market in Germany is expected to expand at a CAGR of 6.2% through 2035, reflecting its position as a global leader in chemical and pharmaceutical excellence. The German chemical sector is built on strong engineering traditions, advanced manufacturing frameworks, and a relentless focus on quality assurance. Pharmaceutical companies consistently integrate intermediates like 1,2-ethanedithiol into their synthesis processes, leveraging its performance in protection–deprotection reactions, selectivity, and yield optimization. The country’s fine chemical sector also plays a critical role in maintaining steady demand, with manufacturers emphasizing integrated approaches that combine innovation with regulatory compliance. Germany’s innovation-driven ecosystem ensures continuous advancements in purification technologies, green chemistry integration, and performance optimization for specialty intermediates. With strong support from research institutions and government initiatives, the adoption of specialty chemicals aligns with broader goals of environmental responsibility and technological leadership. German manufacturers are also leading exporters, reinforcing the global credibility of their specialty chemical products. The country’s focus on high-value drug development and precision chemical manufacturing ensures that 1,2-ethanedithiol remains a core building block within pharmaceutical pipelines. As Germany balances eco-friendly imperatives with technological innovation, it is poised to maintain its status as a benchmark market for specialty chemical excellence.
The United Kingdom’s 1,2-ethanedithiol market is projected to expand at a CAGR of 4.6% through 2035, reflecting steady but resilient growth in alignment with the country’s pharmaceutical and chemical sector strengths. The UK pharmaceutical industry remains a critical driver, with consistent utilization of specialty intermediates to ensure competitive synthesis and regulatory compliance in drug development pipelines. Chemical manufacturers also rely on intermediates like 1,2-ethanedithiol to optimize efficiency and maintain quality assurance across production processes. Post-Brexit industrial strategies emphasize domestic production and reduced reliance on imports, creating stronger incentives for localized specialty chemical adoption. Technical development programs, often supported by public–private partnerships, are expanding the role of specialty chemicals in research and industrial applications. While the UK market is smaller than Germany’s or China’s, its well-established quality standards and emphasis on operational excellence create strong foundations for consistent demand. The UKis also advancing in chemical innovation, with universities and research institutions playing an active role in developing more efficient applications of intermediates. These factors ensure the UK retains steady growth momentum, with 1,2-ethanedithiol firmly integrated into its pharmaceutical and fine chemical synthesis operations.
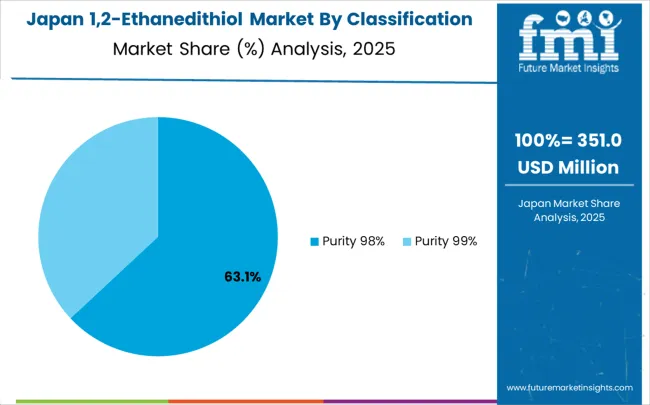
The 1,2-ethanedithiol market in Japan is forecast to grow at a CAGR of 4.1% through 2035, supported by its advanced chemical industry and emphasis on precision engineering. Japanese pharmaceutical and fine chemical companies operate within highly structured manufacturing frameworks that prioritize product quality, regulatory compliance, and process efficiency. 1,2-ethanedithiol plays a role in these frameworks by enabling versatile synthesis methodologies, protection–deprotection strategies, and advanced functional group manipulations. Japan’s leadership is reinforced by its integration of cutting-edge technologies such as process automation, robotics, and AI-enhanced synthesis planning, which require intermediates with high stability and reproducibility. Research institutions collaborate closely with industry, ensuring continuous improvements in specialty chemical utilization and advancing the development of optimized synthetic pathways. Japan’s global role as a technology exporter amplifies its influence, as many exported industrial and pharmaceutical products carry forward stringent Japanese standards. Although growth rates are slower compared to India or China, Japan’s steady emphasis on innovation and quality ensures its continued importance. The country’s balance of traditional precision and modern technological integration positions it as an anchor of reliability and innovation in the global specialty chemical ecosystem.
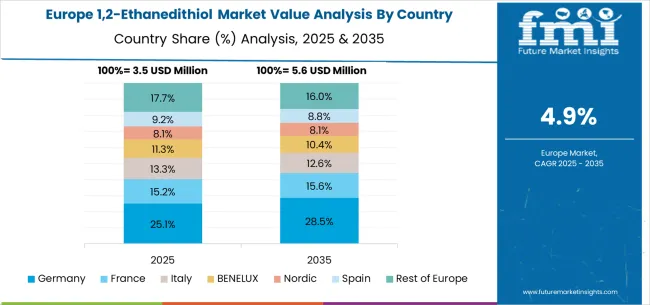
The 1,2-ethanedithiol market in Europe is projected to expand steadily through 2035, supported by increasing adoption of advanced chemical synthesis methodologies, rising demand for pharmaceutical intermediates, and ongoing innovation in specialty chemical applications. Germany will continue to lead the regional market, accounting for 24.8% in 2025 and rising to 25.6% by 2035, supported by strong chemical industry infrastructure, advanced pharmaceutical manufacturing capabilities, and robust specialty chemical development programs. The United Kingdom follows with 18.4% in 2025, increasing to 19.0% by 2035, driven by comprehensive pharmaceutical manufacturing standards, chemical industry excellence, and expanding specialty chemical capabilities.
France holds 16.1% in 2025, edging up to 16.6% by 2035 as chemical manufacturers expand specialty chemical utilization and demand grows for advanced synthetic intermediates. Italy contributes 13.5% in 2025, remaining broadly stable at 14.0% by 2035, supported by growing pharmaceutical sector investment and increasing specialty chemical technology adoption. Spain represents 11.2% in 2025, inching upward to 11.6% by 2035, underpinned by strengthening chemical manufacturing infrastructure and pharmaceutical sector development initiatives.
BENELUX markets together account for 9.3% in 2025, moving to 9.7% by 2035, supported by advanced chemical requirements and pharmaceutical innovation initiatives. The Nordic countries represent 5.8% in 2025, marginally increasing to 6.0% by 2035, with demand fueled by comprehensive quality standards and early adoption of advanced specialty chemicals. The Rest of Western Europe moderates from 0.9% in 2025 to 0.5% by 2035, as larger core markets capture a greater share of specialty chemical investment, pharmaceutical projects, and 1,2-ethanedithiol adoption.
The 1,2-ethanedithiol market is characterized by competition among established specialty chemical manufacturers, specialized fine chemical companies, and comprehensive chemical intermediates suppliers. Companies are investing in production optimization, quality assurance, strategic partnerships, and technical support services to deliver reliable, high-purity, and cost-effective 1,2-ethanedithiol solutions. Product quality, supply reliability, and market access strategies are central to strengthening product portfolios and market presence.
Matrix Fine Chemicals GmbH leads the market with comprehensive specialty chemical solutions focusing on quality excellence and reliable supply chains. Sanmenxia Aoke Chemical Industry provides extensive chemical manufacturing capabilities with emphasis on production efficiency and technical support. Shanghai Zhuorui Chemical focuses on specialized chemical intermediates and custom synthesis solutions for diverse applications. Shanghai Ruifu Chemical delivers innovative chemical products with strong quality characteristics and customer service.
Jinan Xinggao Chemical Technology operates with focus on advanced chemical manufacturing and specialty product development for comprehensive chemical industry applications. These companies provide comprehensive chemical portfolios including technical consulting services, custom synthesis capabilities, and quality assurance programs to enhance market accessibility and customer satisfaction across diverse pharmaceutical and chemical manufacturing environments.
| Items | Values |
|---|---|
| Quantitative Units (2025) | USD 13.9 million |
| Purity Grade | Purity 98%, Purity 99%, Others |
| Application | Organic Synthesis, Pharmaceutical Synthesis |
| Regions Covered | North America, Europe, East Asia, South Asia & Pacific, Latin America, Middle East & Africa |
| Countries Covered | United States, Canada, United Kingdom, Germany, France, China, Japan, South Korea, India, Brazil, Australia and 40+ countries |
| Key Companies Profiled | Matrix Fine Chemicals GmbH, Sanmenxia Aoke Chemical Industry, Shanghai Zhuorui Chemical, Shanghai Ruifu Chemical, Jinan Xinggao Chemical Technology |
| Additional Attributes | Dollar sales by purity grade and application, regional demand trends, competitive landscape, manufacturer preferences for specific grades, integration with synthesis processes, innovations in purification methods, quality control strategies, and supply chain optimization |
The global 1,2-ethanedithiol market is estimated to be valued at USD 13.9 million in 2025.
The market size for the 1,2-ethanedithiol market is projected to reach USD 23.5 million by 2035.
The 1,2-ethanedithiol market is expected to grow at a 5.4% CAGR between 2025 and 2035.
The key product types in 1,2-ethanedithiol market are purity 98% and purity 99%.
In terms of application, organic synthesis segment to command 68.4% share in the 1,2-ethanedithiol market in 2025.

Thank you!
You will receive an email from our Business Development Manager. Please be sure to check your SPAM/JUNK folder too.
Chat With
MaRIA