1,3-Dibromoadamantane Market Size and Share Forecast Outlook 2025 to 2035

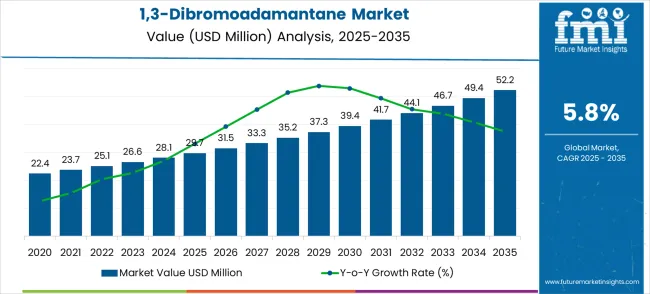
The 1,3-dibromoadamantane market is valued at USD 29.7 million in 2025 and is expected to reach USD 52.2 million by 2035, reflecting a CAGR of 5.8%. The market experiences significant absolute dollar opportunity as it moves from USD 22.4 million in 2021 to USD 29.7 million in 2025, with annual increments through USD 23.7 million, 25.1 million, 26.6 million, and 28.1 million. This early growth phase is driven by the rising use of 1,3-dibromoadamantane in pharmaceutical and chemical applications, particularly in the development of high-performance polymers and organic electronics. The compound’s use as a building block in drug synthesis, particularly in antiviral and anticancer treatments, drives steady value addition during this period.
Quick Stats for 1,3-Dibromoadamantane Market

  • 1,3-Dibromoadamantane Market Value (2025): USD 29.7 million
  • 1,3-Dibromoadamantane Market Forecast Value (2035): USD 52.2 million
  • 1,3-Dibromoadamantane Market Forecast CAGR: 5.8%
  • Leading Purity Grade in 1,3-Dibromoadamantane Market: Purity 98% (62.4%)
  • Key Growth Regions in 1,3-Dibromoadamantane Market: Asia Pacific, North America, and Europe
  • Top Key Players in 1,3-Dibromoadamantane Market: Matrix Fine Chemicals GmbH, Anstar New Material Technology, Chongqing maohuan Chemical, Butterfly New Materials, Hefei Heyu Chemical New Materials, Win-Win chemical, Tianjin Minxiang Biomedical

1,3 Dibromoadamantane Market Market Value Analysis

From 2026 to 2030, the market grows from USD 29.7 million to USD 39.4 million, passing through USD 31.5 million, USD 33.3 million, USD 35.2 million, and USD 37.3 million. This phase sees expanded adoption in the specialty chemical industry, particularly in the production of flame retardants and polymer additives.

The demand for high-purity chemicals and materials continues to rise, contributing to the absolute dollar opportunity in the market. Between 2031 and 2035, the market is expected to reach USD 52.2 million, with intermediate values of USD 41.7 million, USD 44.1 million, USD 46.7 million, and USD 49.4 million. The steady adoption across pharmaceutical, electronics, and chemical industries ensures consistent growth, with significant contributions from innovative applications, positioning 1,3-dibromoadamantane for long-term expansion.

1,3-Dibromoadamantane Market Key Takeaways

Metric Value
Estimated Value in (2025E) USD 29.7 million
Forecast Value in (2035F) USD 52.2 million
Forecast CAGR (2025 to 2035) 5.8%

The chemical manufacturing market contributes about 30-35%, as 1,3-dibromoadamantane is commonly used as an intermediate in the production of specialty chemicals, organic synthesis, and chemical reagents. The pharmaceuticals market adds roughly 20-25%, with the compound being used in pharmaceutical research and development, particularly for the synthesis of antiviral agents and other bioactive molecules. The material science market accounts for about 15-18%, where 1,3-dibromoadamantane plays a role in the creation of polymeric materials and is involved in research on advanced materials and nanotechnology. The agricultural chemicals market provides approximately 10-12%, as the compound is utilized in the development of pesticides and fungicides that aid in crop protection. The electronics and semiconductor market contributes about 8-10%, where 1,3-dibromoadamantane is used in the development of semiconductors, organic electronics, and materials designed to improve conductivity and properties in electronic devices.

Why is the 1,3-Dibromoadamantane Market Growing?

Market expansion is being supported by the increasing global demand for specialized chemical intermediates and the corresponding shift toward advanced dibromoadamantane solutions that can provide superior chemical performance while meeting industry requirements for high-purity synthesis and advanced material applications. Modern pharmaceutical and fine chemical manufacturers are increasingly focused on incorporating high-purity dibromoadamantane to enhance synthesis quality while satisfying demands for ultra-pure chemical intermediates and specialized pharmaceutical synthesis capabilities. Dibromoadamantane's proven ability to deliver superior chemical performance, high purity levels, and versatile synthesis applications makes it essential material for advanced pharmaceutical processes and specialty chemical manufacturing applications.

The growing emphasis on pharmaceutical innovation and advanced materials development is driving demand for high-quality dibromoadamantane products that can support distinctive synthesis capabilities and premium chemical positioning across pharmaceutical synthesis, photosensitive materials, and specialty chemical categories. Chemical manufacturer preference for compounds that combine synthesis excellence with advanced purity characteristics is creating opportunities for innovative dibromoadamantane implementations in both traditional and emerging pharmaceutical applications. The rising influence of advanced synthesis technologies and precision chemical manufacturing is also contributing to increased adoption of premium dibromoadamantane products that can provide authentic high-purity chemical characteristics.

Segmental Analysis

The market is segmented by purity grade, application, and region. By purity grade, the market is divided into purity 98% and purity 99%. Based on application, the market is categorized into photosensitive material, pharmaceutical synthesis, and fine chemicals. Regionally, the market is divided into North America, Europe, Asia Pacific, Latin America, and the Middle East & Africa.
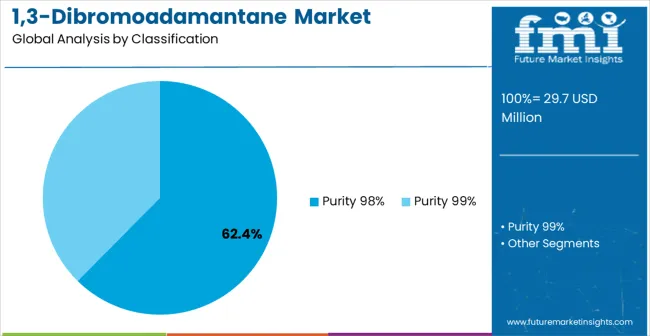
By Purity Grade, the Purity 98% Segment Accounts for 62.4% Market Share

1,3 Dibromoadamantane Market Analysis By Classification

The 98% purity segment is projected to dominate the global 1,3-dibromoadamantane market in 2025, accounting for 62.4% of total demand. This grade has emerged as the industry’s preferred standard because it offers the ideal balance between cost-effectiveness and reliable performance across a wide spectrum of chemical synthesis applications. Manufacturers in the pharmaceutical and specialty chemical sectors increasingly select 98% purity 1,3-dibromoadamantane as it provides the necessary stability, consistency, and compatibility to support precise synthesis processes while keeping production costs manageable. Its standardized composition ensures reproducible outcomes, reducing batch-to-batch variability and enhancing overall efficiency in chemical operations.

This purity level also forms the backbone of modern industrial usage, particularly in large-scale pharmaceutical synthesis, where operational efficiency and regulatory compliance require dependable intermediates. Chemical producers are investing in incremental innovations to further optimize the 98% purity grade, including improvements in crystallization techniques, impurity control, and process safety, making it even more attractive to high-volume users. The segment’s dominance is also supported by its widespread compatibility with diverse synthesis systems and chemical equipment, allowing seamless integration into established workflows. With its combination of industrial scalability, consistent quality control, and affordability, the 98% purity category is expected to remain the foundation of the global dibromoadamantane market through 2035.
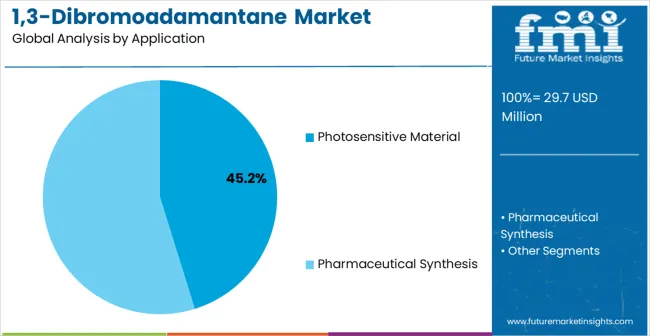
By Application, the Photosensitive Material Segment Leads 45.2% Market Demand

1,3 Dibromoadamantane Market Analysis By Application

Photosensitive material applications are projected to account for the largest share of the global 1,3-dibromoadamantane market in 2025, representing 45.2% of total demand. This dominance underscores the compound’s central role as a high-performance chemical intermediate in the development of advanced photosensitive materials used across imaging technologies, semiconductor processing, and specialty coatings. 1,3-dibromoadamantane is particularly valued for its exceptional chemical stability, resistance to degradation under UV exposure, and compatibility with complex synthesis pathways, making it indispensable in environments that require precise light-response properties.

Material manufacturers favor it for its ability to ensure uniform performance during large-scale production, thereby enhancing process reliability and minimizing variability in final products. As demand rises for next-generation electronic devices, high-resolution imaging solutions, and specialized optical materials, the reliance on stable, high-purity intermediates such as 1,3-dibromoadamantane continues to intensify. Manufacturers are also increasingly integrating this compound into specialty formulations to meet the evolving technical requirements of miniaturized and energy-efficient devices. Its unique molecular structure supports both process innovation and long-term product durability, positioning it as a cornerstone in photosensitive material manufacturing. Going forward, this segment is expected to remain the primary driver of overall market growth, supported by rising adoption in semiconductor and optical technology ecosystems.

What are the Drivers, Restraints, and Key Trends of the 1,3-Dibromoadamantane Market?

The 1,3-dibromoadamantane market is advancing steadily due to increasing pharmaceutical synthesis investments and growing demand for specialty chemical intermediates that emphasize superior chemical purity across pharmaceutical processing and specialty material manufacturing applications. The market faces challenges, including high chemical costs compared to alternative intermediates, technical complexity in synthesis optimization, and competition from substitute chemical compounds. Innovation in chemical purity enhancement and application-specific formulation development continues to influence market development and expansion patterns.

Expansion of Advanced Pharmaceutical Synthesis Applications

The growing adoption of dibromoadamantane in pharmaceutical innovation and advanced synthesis applications is enabling chemical manufacturers to develop products that provide distinctive synthesis capabilities while commanding premium positioning and enhanced purity characteristics. Advanced applications provide superior chemical performance while allowing more sophisticated synthesis development across various pharmaceutical categories and chemical segments. Manufacturers are increasingly recognizing the competitive advantages of high-purity chemical positioning for premium synthesis development and advanced pharmaceutical market penetration.

Integration of Advanced Purification Technology Programs

Modern dibromoadamantane suppliers are incorporating advanced purification techniques, synthesis optimization algorithms, and quality control analytics to enhance chemical purity, improve synthesis reliability, and meet pharmaceutical industry demands for consistent and high-performance chemical intermediates. These programs improve chemical performance while enabling new applications, including advanced pharmaceutical synthesis and specialized material development systems. Advanced purification integration also allows suppliers to support premium market positioning and technology leadership beyond traditional commodity chemicals.
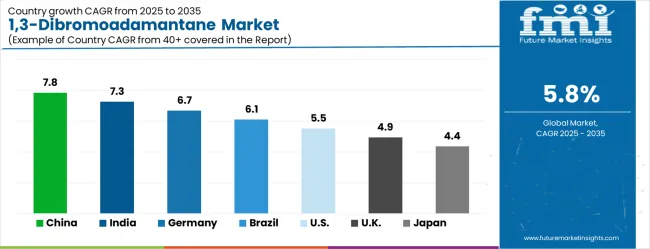
Analysis of the 1,3-Dibromoadamantane Market by Key Country

1,3 Dibromoadamantane Market Cagr Analysis By Country

Country CAGR (2025-2035)
China 7.8%
India 7.3%
Germany 6.7%
Brazil 6.1%
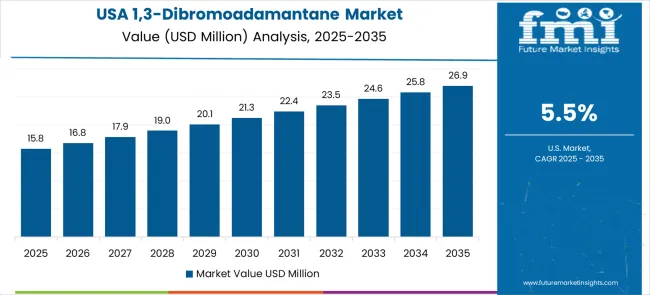
USA 5.5%
UK 4.9%
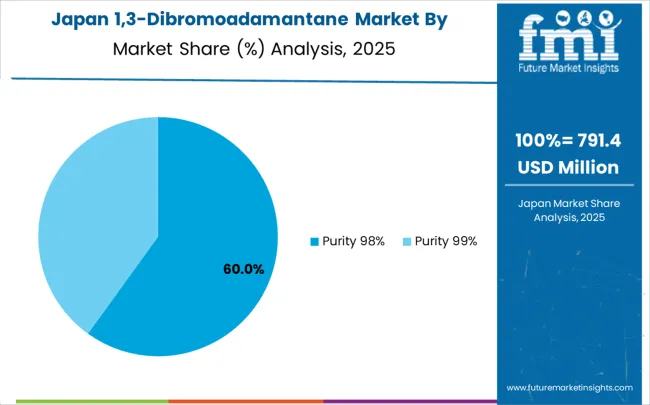
Japan 4.4%

The 1,3-dibromoadamantane market is experiencing steady growth globally, with China leading at a 7.8% CAGR through 2035, driven by the rapidly expanding pharmaceutical manufacturing sector, massive investments in fine chemical production facilities, and increasing adoption of advanced chemical intermediate technologies. India follows at 7.3%, supported by growing pharmaceutical manufacturing, rising chemical industry investments, and expanding specialty material capabilities. Germany shows growth at 6.7%, emphasizing advanced chemical technology and premium pharmaceutical manufacturing. Brazil records 6.1%, focusing on emerging pharmaceutical applications and chemical technology development. The USA demonstrates 5.5% growth, prioritizing advanced pharmaceutical manufacturing and specialty chemical innovation. The UK exhibits 4.9% growth, supported by specialized chemical technology development and advanced pharmaceutical capabilities. Japan shows 4.4% growth, emphasizing pharmaceutical manufacturing excellence and high-quality chemical production.

The report covers an in-depth analysis of 40+ countries, with top-performing countries highlighted below.

China Leads Global Market Growth with Pharmaceutical Manufacturing Expansion

China is expected to remain at the forefront of global demand for 1,3-dibromoadamantane, driven primarily by its rapidly expanding pharmaceutical manufacturing sector and strong state-backed initiatives in fine chemical production. The market in China is projected to grow at a robust CAGR of 7.8% through 2035, supported by both domestic consumption and growing export requirements. Over the past decade, China has consistently invested in upgrading its industrial infrastructure, particularly within large chemical and pharmaceutical hubs such as Shanghai, Jiangsu, and Guangdong. These regions are now becoming key centers for the production of advanced chemical intermediates, including dibromoadamantane, which plays an important role in high-purity pharmaceutical synthesis. Strong government support is further reinforcing this trajectory, with subsidies and policy frameworks designed to accelerate adoption of next-generation chemical technologies and align domestic producers with international regulatory standards. Multinational corporations are also increasing their presence in China, partnering with local firms to establish research, production, and distribution networks that can serve both domestic and overseas markets. This creates a competitive but innovation-oriented environment where demand for premium, high-purity dibromoadamantane continues to expand. China’s scale, government backing, and technology-driven pharmaceutical sector position it as the global growth leader in this market.

  • Rising pharmaceutical manufacturing investments and expanding fine chemical production capacity are driving demand for dibromoadamantane across chemical manufacturers, pharmaceutical producers, and specialty material companies throughout major Chinese industrial centers.
  • Strong government support for pharmaceutical industry development and advanced chemical initiatives is supporting the rapid adoption of specialty chemical intermediates among manufacturers seeking to meet evolving quality requirements and international standards.

India Demonstrates Strong Market Potential with Pharmaceutical Growth

India is emerging as another strong growth region for 1,3-dibromoadamantane, supported by a projected CAGR of 7.3% through 2035. Much of this momentum stems from the country’s rapidly expanding pharmaceutical manufacturing base, which has been reinforced by the “Make in India” initiative and increasing foreign direct investment into the chemical and pharma sectors. As Indian pharmaceutical companies move up the value chain from generics production toward more advanced synthesis and specialty formulations, the demand for high-quality intermediates such as dibromoadamantane is accelerating. Indian states such as Gujarat, Maharashtra, and Telangana are becoming regional hubs for chemical production, with local and multinational companies establishing modern synthesis and processing facilities. The country’s strong academic and research infrastructure is also helping foster innovation in specialty chemicals, ensuring that manufacturers can adopt advanced chemical intermediates with higher purity and performance standards. Government incentives to boost domestic API (Active Pharmaceutical Ingredient) production are reducing reliance on imports and pushing for increased adoption of premium intermediates that meet international quality benchmarks. This confluence of expanding pharmaceutical infrastructure, government-driven industrial growth, and rising technology sophistication is positioning India as one of the most promising markets for dibromoadamantane in the Asia-Pacific region.

  • Rising pharmaceutical manufacturing activities and expanding chemical processing operations are creating opportunities for dibromoadamantane adoption across pharmaceutical manufacturers, chemical producers, and specialty synthesis facilities in major Indian manufacturing regions.
  • Growing government focus on pharmaceutical manufacturing development and Make in India initiatives are driving the adoption of premium chemical intermediates among manufacturers seeking to meet international quality standards and synthesis requirements.

Germany Maintains Strong Position with Advanced Chemical Technology

Germany is expected to maintain a leading position within Europe’s 1,3-dibromoadamantane market, with growth projected at a CAGR of 6.7% through 2035. Germany’s chemical industry is among the most advanced globally, characterized by precision-driven synthesis, high-performance intermediates, and strong adherence to quality standards. Pharmaceutical and chemical producers in Germany place a premium on purity, making dibromoadamantane a highly valuable component for applications in both advanced synthesis and specialty chemical formulations. The country’s emphasis on R&D and continuous innovation fosters the development of customized dibromoadamantane derivatives tailored to specific pharmaceutical applications. Major companies in Germany are also increasingly integrating eco-conscious and green chemistry principles into their operations, ensuring that production aligns with European Union environmental regulations. Germany’s export-oriented chemical sector benefits from this positioning, as high-quality and reliable intermediates continue to command demand in both European and international markets. Collaborative partnerships between industry leaders, research institutions, and government initiatives are further strengthening Germany’s role as a hub for advanced chemical technologies. As pharmaceutical innovation accelerates across Europe, Germany’s capacity to deliver high-purity, performance-oriented dibromoadamantane will remain a defining factor in its strong market trajectory.

  • Rising advanced chemical development and precision pharmaceutical manufacturing are driving demand for premium dibromoadamantane products across chemical companies, pharmaceutical manufacturers, and specialty synthesis producers seeking superior purity characteristics.
  • Strong chemical expertise and synthesis innovation capabilities are supporting the adoption of cutting-edge dibromoadamantane technologies among manufacturers prioritizing chemical quality and operational excellence in pharmaceutical synthesis applications.

Brazil Strengthens Market with Chemical Industry Development

Brazil represents one of the fastest-emerging opportunities for 1,3-dibromoadamantane in Latin America, with revenue projected to grow at a CAGR of 6.1% through 2035. The expansion of Brazil’s domestic chemical industry, coupled with a strengthening pharmaceutical sector, is driving demand for advanced chemical intermediates. Brazilian producers are increasingly investing in technologies that improve synthesis efficiency, purity levels, and compliance with global quality standards. Dibromoadamantane, with its role as a key pharmaceutical intermediate, is gaining adoption not only in local drug manufacturing but also in specialty synthesis facilities that supply regional and export markets. Brazil’s chemical industry hubs, particularly São Paulo and Rio de Janeiro, are seeing growing investment from both domestic firms and multinational chemical companies seeking to establish a foothold in the Latin American market. Government-backed industrial programs and regulatory reforms are also supporting the modernization of chemical production facilities, enabling manufacturers to adopt advanced intermediates like dibromoadamantane more readily. With the country increasingly positioning itself as a regional leader in chemical and pharmaceutical innovation, the adoption of high-purity dibromoadamantane is expected to accelerate, offering Brazilian producers both domestic growth opportunities and export competitiveness across Latin America.
  • Growing chemical industry activities and expanding pharmaceutical capabilities are driving demand for dibromoadamantane products across chemical manufacturers, pharmaceutical producers, and specialty synthesis specialists seeking to enhance operational performance and product quality.
  • Increasing focus on chemical technology advancement and quality improvement initiatives is supporting the adoption of high-purity chemical solutions among manufacturers seeking to differentiate their products in regional and international markets with superior synthesis capabilities.

USA Anchors Growth with Pharmaceutical Manufacturing Innovation Leadership

1,3 Dibromoadamantane Market Country Value Analysis

The United States continues to serve as a critical anchor for global growth in the 1,3-dibromoadamantane market, with revenues projected to expand at a CAGR of 5.5% through 2035. The USA pharmaceutical sector is one of the most advanced globally, characterized by large-scale manufacturing capabilities, extensive R&D investments, and a strong emphasis on innovation. This positions dibromoadamantane as an essential high-purity intermediate for both pharmaceutical synthesis and specialty chemical applications. American manufacturers prioritize product reliability and adherence to stringent FDA regulatory standards, which drives the consistent demand for advanced chemical intermediates capable of meeting these requirements. The USA also benefits from its role as a global center for chemical technology development, where collaborations between pharmaceutical companies, universities, and specialty chemical producers accelerate the adoption of cutting-edge synthesis techniques. Government support for advanced pharmaceutical manufacturing initiatives and investment in technology-driven solutions, such as continuous manufacturing, is further expanding the need for premium intermediates. With a combination of world-class research institutions, advanced production infrastructure, and an innovation-first approach, the USA market for 1,3-dibromoadamantane is expected to remain highly resilient and central to global supply chains.

  • Advanced pharmaceutical manufacturing capabilities and chemical innovation leadership are driving demand for specialized dibromoadamantane products across manufacturers, pharmaceutical companies, and research institutions serving domestic and international markets.
  • Strong focus on pharmaceutical excellence and chemical technology advancement is encouraging companies to adopt premium dibromoadamantane products that support cutting-edge positioning and meet American quality standards for advanced pharmaceutical and chemical manufacturing applications.

UK Demonstrates Stable Growth with Specialized Chemical Development

The United Kingdom is expected to see stable growth in the 1,3-dibromoadamantane market, with a projected CAGR of 4.9% through 2035. British manufacturers and pharmaceutical companies have long been recognized for their emphasis on innovation, technical precision, and adherence to strict quality standards. These attributes drive consistent demand for premium intermediates such as dibromoadamantane, which play a key role in pharmaceutical synthesis and emerging specialty applications. The UK’s strong base of academic research institutions and specialized chemical development facilities supports innovation and ensures a steady pipeline of advanced synthesis technologies. While the UK market is not as large in scale as China or the USA, its focus on specialized, high-value chemical solutions makes it a vital contributor to the global dibromoadamantane landscape. The government’s continued support for pharmaceutical and chemical innovation through funding, R&D tax credits, and strategic life sciences initiatives helps market momentum. British companies are increasingly emphasizing purity optimization and synthesis efficiency, ensuring competitiveness in both domestic and international markets. This steady focus on quality, specialization, and innovation underpins the UK’s stable role in the global 1,3-dibromoadamantane industry.
  • Specialized chemical technology development and advanced pharmaceutical expertise are driving steady demand for high-quality dibromoadamantane products across chemical companies, pharmaceutical manufacturers, and synthesis specialists seeking superior purity characteristics and technical excellence.
  • Strong innovation culture and chemical technology development focus are supporting the adoption of premium dibromoadamantane solutions among manufacturers seeking to meet British quality expectations and purity standards for advanced synthesis and pharmaceutical applications.

Japan Focuses on Pharmaceutical Manufacturing Excellence

1,3 Dibromoadamantane Market Japan Market Share Analysis By Classification

The 1,3-dibromoadamantane market in Japan is projected to grow steadily at a CAGR of 4.4% through 2035, underpinned by the country’s reputation for pharmaceutical manufacturing excellence and advanced chemical expertise. Japanese manufacturers are recognized globally for their commitment to precision, purity, and high-performance chemical solutions, making dibromoadamantane a key component in domestic and export-driven pharmaceutical synthesis. The country’s chemical industry has long been associated with reliability and innovation, enabling Japanese companies to command a premium in international markets for their high-quality intermediates. At the same time, ongoing investment in next-generation synthesis technologies is reinforcing Japan’s ability to remain competitive in specialty chemical markets. Pharmaceutical companies in Japan are also leveraging their reputation for quality to strengthen global partnerships, particularly in North America and Europe, where demand for advanced intermediates continues to rise. Government initiatives aimed at bolstering pharmaceutical R&D and encouraging the adoption of advanced synthesis technologies are expected to further expand the use of dibromoadamantane. While growth rates are modest compared to emerging economies, Japan’s focus on precision-driven innovation, international market credibility, and pharmaceutical excellence ensures its continued relevance in the global dibromoadamantane landscape.
  • Pharmaceutical manufacturing capabilities and advanced chemical expertise are driving the development of premium dibromoadamantane products that command higher prices in international markets while supporting technological advancement and pharmaceutical excellence initiatives.
  • Growing focus on chemical technology innovation and synthesis optimization is supporting the adoption of advanced chemical intermediates and pharmaceutical synthesis technologies among manufacturers seeking to ensure product quality and maintain the Japanese reputation for chemical excellence in pharmaceutical synthesis applications.

Europe Market Split by Country

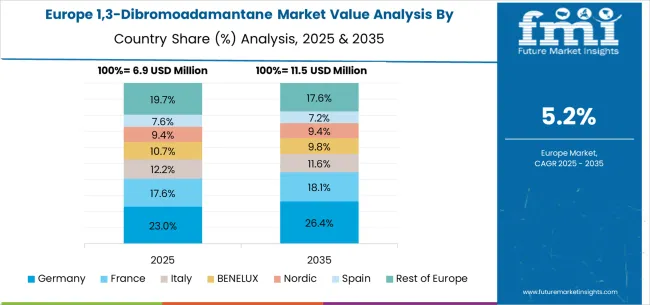
1,3 Dibromoadamantane Market Europe Country Market Share Analysis, 2025 & 2035

The 1,3-dibromoadamantane market in Europe is projected to grow from USD 7.6 million in 2025 to USD 13.4 million by 2035, registering a CAGR of 5.8% over the forecast period. Germany is expected to maintain its leadership position with a 38.2% market share in 2025, remaining stable at 38.5% by 2035, supported by its advanced chemical technology sector, pharmaceutical manufacturing industry, and comprehensive innovation capabilities serving European and international markets.

The United Kingdom follows with a 24.3% share in 2025, projected to reach 24.6% by 2035, driven by specialized chemical technology development programs, advanced pharmaceutical capabilities, and a growing focus on high-purity synthesis solutions for premium applications. France holds a 16.9% share in 2025, expected to maintain 16.7% by 2035, supported by advanced pharmaceutical demand and chemical technology applications, but facing challenges from market competition and economic considerations. Italy commands an 11.4% share in 2025, projected to reach 11.2% by 2035, while Spain accounts for 6.1% in 2025, expected to reach 6.2% by 2035. The Netherlands maintains a 3.1% share in 2025, growing to 2.8% by 2035. The Rest of Europe region, including Nordic countries, Eastern Europe, Belgium, Switzerland, and Austria, is anticipated to hold 15.2% in 2025, declining slightly to 14.9% by 2035, attributed to mixed growth patterns with moderate expansion in some advanced chemical markets balanced by slower growth in smaller countries implementing specialty chemical development programs.

Competitive Landscape of the 1,3-Dibromoadamantane Market

The 1,3-dibromoadamantane market is characterized by competition among established chemical manufacturers, specialized fine chemical producers, and integrated synthesis solution suppliers. Companies are investing in advanced chemical synthesis technologies, purity enhancement systems, application-specific product development, and comprehensive technical support capabilities to deliver consistent, high-performance, and reliable dibromoadamantane products. Innovation in chemical purity optimization, synthesis efficiency enhancement, and customized application solutions is central to strengthening market position and customer satisfaction.

Matrix Fine Chemicals GmbH leads the market with a strong focus on advanced chemical synthesis innovation and comprehensive fine chemical solutions, offering sophisticated dibromoadamantane products with emphasis on chemical purity and industrial integration excellence. Anstar New Material Technology provides specialized material synthesis capabilities with a focus on pharmaceutical applications and global manufacturing networks. Chongqing maohuan Chemical delivers advanced chemical intermediate technology with a focus on innovation and premium product development. Butterfly New Materials specializes in advanced material synthesis with emphasis on technical expertise and application optimization. Hefei Heyu Chemical New Materials focuses on chemical technology and synthesis solutions. Win-Win chemical emphasizes industrial chemical expertise with a focus on synthesis integration and operational reliability. Tianjin Minxiang Biomedical concentrates on pharmaceutical-grade chemical intermediates with specialized synthesis capabilities.

Global 1,3-Dibromoadamantane Market – Stakeholder Contribution Framework

The 1,3-dibromoadamantane market sits at the intersection of pharmaceutical innovation, fine chemical development, and specialty synthesis applications. With global demand driven by API production, specialty materials, and chemical intermediates, coordinated contributions across stakeholders are critical to ensure scalable production, regulatory compliance and innovation adoption.

How Governments Could Spur Local Production and Adoption?

  • Subsidies & Incentives: Offer tax benefits or production-linked incentives for local firms producing high-purity dibromoadamantane for pharmaceutical use.
  • R&D Grants: Fund public–private research into next-generation adamantane derivatives, optimized synthesis pathways, and greener bromination processes.
  • Regulatory Harmonization: Establish clear purity, safety, and handling standards aligned with international pharmacopeias to support global market acceptance.
  • Trade Facilitation: Ease import–export of dibromoadamantane intermediates and harmonize tariff structures to reduce cost barriers for pharma manufacturers.
  • Green Regulations: Encourage adoption of eco-friendly bromination technologies and integrate DBA production into national green chemistry roadmaps.

How Industry Bodies Could Support Market Development?

  • Standardization: Develop consensus guidelines on purity benchmarks, impurity thresholds, and analytical testing protocols for DBA.
  • Export Branding: Position regional DBA producers as trusted suppliers of pharma-grade intermediates, emphasizing compliance with GMP and ISO standards.
  • Training & Knowledge Sharing: Run workshops on safe handling, synthesis efficiency, and regulatory compliance for small and mid-tier chemical producers.
  • Policy Advocacy: Represent producers in dialogues on chemical trade regulations, pharma quality rules, and IP frameworks for advanced intermediates.

How OEMs and Pharma-Tech Players Could Strengthen the Ecosystem?

  • Process Technology Integration: Co-develop continuous flow bromination systems and scalable reactors tailored for adamantane derivatives.
  • Digital Chemistry Platforms: Deploy AI-driven simulation tools for reaction optimization and impurity prediction in DBA synthesis.
  • Collaborative Innovation: Partner with pharma companies to design application-specific DBA derivatives for antivirals, oncology, and specialty drug delivery.
  • Automation & Safety: Provide modular plant solutions with automated monitoring, bromine containment, and waste recycling systems to enhance EHS standards.

How Suppliers Could Navigate the Shift?

  • Eco-friendly Sourcing: Adopt greener bromination routes and explore circular chemistry models using recyclable reagents.
  • Portfolio Diversification: Expand from base DBA into functionalized adamantane derivatives (e.g., hydroxylated, aminated, or halogenated variants).
  • Quality Assurance: Invest in traceability, digital QC, and lot-to-lot consistency systems to build trust with pharma customers.
  • Global Distribution: Strengthen supply chains with localized warehouses and technical service hubs near major pharma clusters (China, India, EU, USA).

How Investors and Financial Enablers Could Unlock Value?

  • Capacity Expansion Financing: Back new DBA production plants and R&D pilot facilities in Asia-Pacific and Europe.
  • Environmental Investment Funds: Channel climate-linked funds into companies developing low-carbon or energy-efficient brominating technologies.
  • Private Equity & M&A: Consolidate fragmented chemical intermediates players into regional champions with cross-border reach.
  • Strategic Pharma Partnerships: Invest in vertical integration deals between DBA suppliers and pharmaceutical companies to secure long-term offtake.
  • Risk Mitigation Tools: Provide price-hedging and insurance models to protect producers from bromine raw material volatility.

Key Players in the 1,3-Dibromoadamantane Market

  • Matrix Fine Chemicals GmbH
  • Anstar New Material Technology
  • Chongqing maohuan Chemical
  • Butterfly New Materials
  • Hefei Heyu Chemical New Materials
  • Win-Win chemical
  • Tianjin Minxiang Biomedical
  • Henan Fengda Chemical Co., Ltd.
  • Zhejiang Hongbo Chemical Co., Ltd.
  • FUJIFILM Wako Chemical Corporation
  • TRC / Advatech Group
  • Ningbo Inno PharmChem Co., Ltd.
  • Shandong Dongde New Materials Co., Ltd.
  • Hebei Weibang Biotechnology Co., Ltd.

Scope of the Report

Items Values
Quantitative Units (2025) USD 29.7 million
Purity Grade Purity 98%, Purity 99%
Application Photosensitive Material, Pharmaceutical Synthesis, Fine Chemicals
Regions Covered North America, Europe, Asia Pacific, Latin America, Middle East & Africa
Countries Covered United States, Canada, United Kingdom, Germany, France, China, Japan, South Korea, India, Brazil, Australia and 40+ countries
Key Companies Profiled Matrix Fine Chemicals GmbH, Anstar New Material Technology, Chongqing maohuan Chemical, Butterfly New Materials, Hefei Heyu Chemical New Materials, Win-Win chemical, and Tianjin Minxiang Biomedical
Additional Attributes Dollar sales by purity grade and application, regional demand trends, competitive landscape, technological advancements in chemical synthesis, pharmaceutical development initiatives, purity optimization programs, and synthesis integration enhancement strategies

1,3-Dibromoadamantane Market by Segments

Purity Grade:

  • Purity 98%
  • Purity 99%

Application:

  • Photosensitive Material
  • Pharmaceutical Synthesis
  • Fine Chemicals

Region:

North America

  • United States
  • Canada
  • Mexico

Europe

  • Germany
  • United Kingdom
  • France
  • Italy
  • Spain
  • Nordic
  • BENELUX
  • Rest of Europe

Asia Pacific

  • China
  • Japan
  • South Korea
  • India
  • ASEAN
  • Australia & New Zealand
  • Rest of Asia Pacific

Latin America

  • Brazil
  • Chile
  • Rest of Latin America

Middle East & Africa

  • Kingdom of Saudi Arabia
  • Other GCC Countries
  • Turkiye
  • South Africa
  • Other African Union
  • Rest of Middle East & Africa

Table of Content

  1. Executive Summary
    • Global Market Outlook
    • Demand to side Trends
    • Supply to side Trends
    • Technology Roadmap Analysis
    • Analysis and Recommendations
  2. Market Overview
    • Market Coverage / Taxonomy
    • Market Definition / Scope / Limitations
  3. Market Background
    • Market Dynamics
      • Drivers
      • Restraints
      • Opportunity
      • Trends
    • Scenario Forecast
      • Demand in Optimistic Scenario
      • Demand in Likely Scenario
      • Demand in Conservative Scenario
    • Opportunity Map Analysis
    • Product Life Cycle Analysis
    • Supply Chain Analysis
    • Investment Feasibility Matrix
    • Value Chain Analysis
    • PESTLE and Porter’s Analysis
    • Regulatory Landscape
    • Regional Parent Market Outlook
    • Production and Consumption Statistics
    • Import and Export Statistics
  4. Global Market Analysis 2020 to 2024 and Forecast, 2025 to 2035
    • Historical Market Size Value (USD Million) Analysis, 2020 to 2024
    • Current and Future Market Size Value (USD Million) Projections, 2025 to 2035
      • Y to o to Y Growth Trend Analysis
      • Absolute $ Opportunity Analysis
  5. Global Market Pricing Analysis 2020 to 2024 and Forecast 2025 to 2035
  6. Global Market Analysis 2020 to 2024 and Forecast 2025 to 2035, By Classification
    • Introduction / Key Findings
    • Historical Market Size Value (USD Million) Analysis By Classification , 2020 to 2024
    • Current and Future Market Size Value (USD Million) Analysis and Forecast By Classification , 2025 to 2035
      • Purity 98%
      • Purity 99%
    • Y to o to Y Growth Trend Analysis By Classification , 2020 to 2024
    • Absolute $ Opportunity Analysis By Classification , 2025 to 2035
  7. Global Market Analysis 2020 to 2024 and Forecast 2025 to 2035, By Application
    • Introduction / Key Findings
    • Historical Market Size Value (USD Million) Analysis By Application, 2020 to 2024
    • Current and Future Market Size Value (USD Million) Analysis and Forecast By Application, 2025 to 2035
      • Photosensitive Material
      • Pharmaceutical Synthesis
    • Y to o to Y Growth Trend Analysis By Application, 2020 to 2024
    • Absolute $ Opportunity Analysis By Application, 2025 to 2035
  8. Global Market Analysis 2020 to 2024 and Forecast 2025 to 2035, By Region
    • Introduction
    • Historical Market Size Value (USD Million) Analysis By Region, 2020 to 2024
    • Current Market Size Value (USD Million) Analysis and Forecast By Region, 2025 to 2035
      • North America
      • Latin America
      • Western Europe
      • Eastern Europe
      • East Asia
      • South Asia and Pacific
      • Middle East & Africa
    • Market Attractiveness Analysis By Region
  9. North America Market Analysis 2020 to 2024 and Forecast 2025 to 2035, By Country
    • Historical Market Size Value (USD Million) Trend Analysis By Market Taxonomy, 2020 to 2024
    • Market Size Value (USD Million) Forecast By Market Taxonomy, 2025 to 2035
      • By Country
        • USA
        • Canada
        • Mexico
      • By Classification
      • By Application
    • Market Attractiveness Analysis
      • By Country
      • By Classification
      • By Application
    • Key Takeaways
  10. Latin America Market Analysis 2020 to 2024 and Forecast 2025 to 2035, By Country
    • Historical Market Size Value (USD Million) Trend Analysis By Market Taxonomy, 2020 to 2024
    • Market Size Value (USD Million) Forecast By Market Taxonomy, 2025 to 2035
      • By Country
        • Brazil
        • Chile
        • Rest of Latin America
      • By Classification
      • By Application
    • Market Attractiveness Analysis
      • By Country
      • By Classification
      • By Application
    • Key Takeaways
  11. Western Europe Market Analysis 2020 to 2024 and Forecast 2025 to 2035, By Country
    • Historical Market Size Value (USD Million) Trend Analysis By Market Taxonomy, 2020 to 2024
    • Market Size Value (USD Million) Forecast By Market Taxonomy, 2025 to 2035
      • By Country
        • Germany
        • UK
        • Italy
        • Spain
        • France
        • Nordic
        • BENELUX
        • Rest of Western Europe
      • By Classification
      • By Application
    • Market Attractiveness Analysis
      • By Country
      • By Classification
      • By Application
    • Key Takeaways
  12. Eastern Europe Market Analysis 2020 to 2024 and Forecast 2025 to 2035, By Country
    • Historical Market Size Value (USD Million) Trend Analysis By Market Taxonomy, 2020 to 2024
    • Market Size Value (USD Million) Forecast By Market Taxonomy, 2025 to 2035
      • By Country
        • Russia
        • Poland
        • Hungary
        • Balkan & Baltic
        • Rest of Eastern Europe
      • By Classification
      • By Application
    • Market Attractiveness Analysis
      • By Country
      • By Classification
      • By Application
    • Key Takeaways
  13. East Asia Market Analysis 2020 to 2024 and Forecast 2025 to 2035, By Country
    • Historical Market Size Value (USD Million) Trend Analysis By Market Taxonomy, 2020 to 2024
    • Market Size Value (USD Million) Forecast By Market Taxonomy, 2025 to 2035
      • By Country
        • China
        • Japan
        • South Korea
      • By Classification
      • By Application
    • Market Attractiveness Analysis
      • By Country
      • By Classification
      • By Application
    • Key Takeaways
  14. South Asia and Pacific Market Analysis 2020 to 2024 and Forecast 2025 to 2035, By Country
    • Historical Market Size Value (USD Million) Trend Analysis By Market Taxonomy, 2020 to 2024
    • Market Size Value (USD Million) Forecast By Market Taxonomy, 2025 to 2035
      • By Country
        • India
        • ASEAN
        • Australia & New Zealand
        • Rest of South Asia and Pacific
      • By Classification
      • By Application
    • Market Attractiveness Analysis
      • By Country
      • By Classification
      • By Application
    • Key Takeaways
  15. Middle East & Africa Market Analysis 2020 to 2024 and Forecast 2025 to 2035, By Country
    • Historical Market Size Value (USD Million) Trend Analysis By Market Taxonomy, 2020 to 2024
    • Market Size Value (USD Million) Forecast By Market Taxonomy, 2025 to 2035
      • By Country
        • Kingdom of Saudi Arabia
        • Other GCC Countries
        • Turkiye
        • South Africa
        • Other African Union
        • Rest of Middle East & Africa
      • By Classification
      • By Application
    • Market Attractiveness Analysis
      • By Country
      • By Classification
      • By Application
    • Key Takeaways
  16. Key Countries Market Analysis
    • USA
      • Pricing Analysis
      • Market Share Analysis, 2024
        • By Classification
        • By Application
    • Canada
      • Pricing Analysis
      • Market Share Analysis, 2024
        • By Classification
        • By Application
    • Mexico
      • Pricing Analysis
      • Market Share Analysis, 2024
        • By Classification
        • By Application
    • Brazil
      • Pricing Analysis
      • Market Share Analysis, 2024
        • By Classification
        • By Application
    • Chile
      • Pricing Analysis
      • Market Share Analysis, 2024
        • By Classification
        • By Application
    • Germany
      • Pricing Analysis
      • Market Share Analysis, 2024
        • By Classification
        • By Application
    • UK
      • Pricing Analysis
      • Market Share Analysis, 2024
        • By Classification
        • By Application
    • Italy
      • Pricing Analysis
      • Market Share Analysis, 2024
        • By Classification
        • By Application
    • Spain
      • Pricing Analysis
      • Market Share Analysis, 2024
        • By Classification
        • By Application
    • France
      • Pricing Analysis
      • Market Share Analysis, 2024
        • By Classification
        • By Application
    • India
      • Pricing Analysis
      • Market Share Analysis, 2024
        • By Classification
        • By Application
    • ASEAN
      • Pricing Analysis
      • Market Share Analysis, 2024
        • By Classification
        • By Application
    • Australia & New Zealand
      • Pricing Analysis
      • Market Share Analysis, 2024
        • By Classification
        • By Application
    • China
      • Pricing Analysis
      • Market Share Analysis, 2024
        • By Classification
        • By Application
    • Japan
      • Pricing Analysis
      • Market Share Analysis, 2024
        • By Classification
        • By Application
    • South Korea
      • Pricing Analysis
      • Market Share Analysis, 2024
        • By Classification
        • By Application
    • Russia
      • Pricing Analysis
      • Market Share Analysis, 2024
        • By Classification
        • By Application
    • Poland
      • Pricing Analysis
      • Market Share Analysis, 2024
        • By Classification
        • By Application
    • Hungary
      • Pricing Analysis
      • Market Share Analysis, 2024
        • By Classification
        • By Application
    • Kingdom of Saudi Arabia
      • Pricing Analysis
      • Market Share Analysis, 2024
        • By Classification
        • By Application
    • Turkiye
      • Pricing Analysis
      • Market Share Analysis, 2024
        • By Classification
        • By Application
    • South Africa
      • Pricing Analysis
      • Market Share Analysis, 2024
        • By Classification
        • By Application
  17. Market Structure Analysis
    • Competition Dashboard
    • Competition Benchmarking
    • Market Share Analysis of Top Players
      • By Regional
      • By Classification
      • By Application
  18. Competition Analysis
    • Competition Deep Dive
      • Anstar New Material Technology
        • Overview
        • Product Portfolio
        • Profitability by Market Segments (Product/Age /Sales Channel/Region)
        • Sales Footprint
        • Strategy Overview
          • Marketing Strategy
          • Product Strategy
          • Channel Strategy
      • Chongqing maohuan Chemical
      • Butterfly New Materials
      • Hefei Heyu Chemical New Materials
      • Win-Win chemical
      • Tianjin Minxiang Biomedical
  19. Assumptions & Acronyms Used
  20. Research Methodology

List of Tables

  • Table 1: Global Market Value (USD Million) Forecast by Region, 2020 to 2035
  • Table 2: Global Market Value (USD Million) Forecast by Classification , 2020 to 2035
  • Table 3: Global Market Value (USD Million) Forecast by Application, 2020 to 2035
  • Table 4: North America Market Value (USD Million) Forecast by Country, 2020 to 2035
  • Table 5: North America Market Value (USD Million) Forecast by Classification , 2020 to 2035
  • Table 6: North America Market Value (USD Million) Forecast by Application, 2020 to 2035
  • Table 7: Latin America Market Value (USD Million) Forecast by Country, 2020 to 2035
  • Table 8: Latin America Market Value (USD Million) Forecast by Classification , 2020 to 2035
  • Table 9: Latin America Market Value (USD Million) Forecast by Application, 2020 to 2035
  • Table 10: Western Europe Market Value (USD Million) Forecast by Country, 2020 to 2035
  • Table 11: Western Europe Market Value (USD Million) Forecast by Classification , 2020 to 2035
  • Table 12: Western Europe Market Value (USD Million) Forecast by Application, 2020 to 2035
  • Table 13: Eastern Europe Market Value (USD Million) Forecast by Country, 2020 to 2035
  • Table 14: Eastern Europe Market Value (USD Million) Forecast by Classification , 2020 to 2035
  • Table 15: Eastern Europe Market Value (USD Million) Forecast by Application, 2020 to 2035
  • Table 16: East Asia Market Value (USD Million) Forecast by Country, 2020 to 2035
  • Table 17: East Asia Market Value (USD Million) Forecast by Classification , 2020 to 2035
  • Table 18: East Asia Market Value (USD Million) Forecast by Application, 2020 to 2035
  • Table 19: South Asia and Pacific Market Value (USD Million) Forecast by Country, 2020 to 2035
  • Table 20: South Asia and Pacific Market Value (USD Million) Forecast by Classification , 2020 to 2035
  • Table 21: South Asia and Pacific Market Value (USD Million) Forecast by Application, 2020 to 2035
  • Table 22: Middle East & Africa Market Value (USD Million) Forecast by Country, 2020 to 2035
  • Table 23: Middle East & Africa Market Value (USD Million) Forecast by Classification , 2020 to 2035
  • Table 24: Middle East & Africa Market Value (USD Million) Forecast by Application, 2020 to 2035

List of Figures

  • Figure 1: Global Market Pricing Analysis
  • Figure 2: Global Market Value (USD Million) Forecast 2020-2035
  • Figure 3: Global Market Value Share and BPS Analysis by Classification , 2025 and 2035
  • Figure 4: Global Market Y to o to Y Growth Comparison by Classification , 2025-2035
  • Figure 5: Global Market Attractiveness Analysis by Classification
  • Figure 6: Global Market Value Share and BPS Analysis by Application, 2025 and 2035
  • Figure 7: Global Market Y to o to Y Growth Comparison by Application, 2025-2035
  • Figure 8: Global Market Attractiveness Analysis by Application
  • Figure 9: Global Market Value (USD Million) Share and BPS Analysis by Region, 2025 and 2035
  • Figure 10: Global Market Y to o to Y Growth Comparison by Region, 2025-2035
  • Figure 11: Global Market Attractiveness Analysis by Region
  • Figure 12: North America Market Incremental Dollar Opportunity, 2025-2035
  • Figure 13: Latin America Market Incremental Dollar Opportunity, 2025-2035
  • Figure 14: Western Europe Market Incremental Dollar Opportunity, 2025-2035
  • Figure 15: Eastern Europe Market Incremental Dollar Opportunity, 2025-2035
  • Figure 16: East Asia Market Incremental Dollar Opportunity, 2025-2035
  • Figure 17: South Asia and Pacific Market Incremental Dollar Opportunity, 2025-2035
  • Figure 18: Middle East & Africa Market Incremental Dollar Opportunity, 2025-2035
  • Figure 19: North America Market Value Share and BPS Analysis by Country, 2025 and 2035
  • Figure 20: North America Market Value Share and BPS Analysis by Classification , 2025 and 2035
  • Figure 21: North America Market Y to o to Y Growth Comparison by Classification , 2025-2035
  • Figure 22: North America Market Attractiveness Analysis by Classification
  • Figure 23: North America Market Value Share and BPS Analysis by Application, 2025 and 2035
  • Figure 24: North America Market Y to o to Y Growth Comparison by Application, 2025-2035
  • Figure 25: North America Market Attractiveness Analysis by Application
  • Figure 26: Latin America Market Value Share and BPS Analysis by Country, 2025 and 2035
  • Figure 27: Latin America Market Value Share and BPS Analysis by Classification , 2025 and 2035
  • Figure 28: Latin America Market Y to o to Y Growth Comparison by Classification , 2025-2035
  • Figure 29: Latin America Market Attractiveness Analysis by Classification
  • Figure 30: Latin America Market Value Share and BPS Analysis by Application, 2025 and 2035
  • Figure 31: Latin America Market Y to o to Y Growth Comparison by Application, 2025-2035
  • Figure 32: Latin America Market Attractiveness Analysis by Application
  • Figure 33: Western Europe Market Value Share and BPS Analysis by Country, 2025 and 2035
  • Figure 34: Western Europe Market Value Share and BPS Analysis by Classification , 2025 and 2035
  • Figure 35: Western Europe Market Y to o to Y Growth Comparison by Classification , 2025-2035
  • Figure 36: Western Europe Market Attractiveness Analysis by Classification
  • Figure 37: Western Europe Market Value Share and BPS Analysis by Application, 2025 and 2035
  • Figure 38: Western Europe Market Y to o to Y Growth Comparison by Application, 2025-2035
  • Figure 39: Western Europe Market Attractiveness Analysis by Application
  • Figure 40: Eastern Europe Market Value Share and BPS Analysis by Country, 2025 and 2035
  • Figure 41: Eastern Europe Market Value Share and BPS Analysis by Classification , 2025 and 2035
  • Figure 42: Eastern Europe Market Y to o to Y Growth Comparison by Classification , 2025-2035
  • Figure 43: Eastern Europe Market Attractiveness Analysis by Classification
  • Figure 44: Eastern Europe Market Value Share and BPS Analysis by Application, 2025 and 2035
  • Figure 45: Eastern Europe Market Y to o to Y Growth Comparison by Application, 2025-2035
  • Figure 46: Eastern Europe Market Attractiveness Analysis by Application
  • Figure 47: East Asia Market Value Share and BPS Analysis by Country, 2025 and 2035
  • Figure 48: East Asia Market Value Share and BPS Analysis by Classification , 2025 and 2035
  • Figure 49: East Asia Market Y to o to Y Growth Comparison by Classification , 2025-2035
  • Figure 50: East Asia Market Attractiveness Analysis by Classification
  • Figure 51: East Asia Market Value Share and BPS Analysis by Application, 2025 and 2035
  • Figure 52: East Asia Market Y to o to Y Growth Comparison by Application, 2025-2035
  • Figure 53: East Asia Market Attractiveness Analysis by Application
  • Figure 54: South Asia and Pacific Market Value Share and BPS Analysis by Country, 2025 and 2035
  • Figure 55: South Asia and Pacific Market Value Share and BPS Analysis by Classification , 2025 and 2035
  • Figure 56: South Asia and Pacific Market Y to o to Y Growth Comparison by Classification , 2025-2035
  • Figure 57: South Asia and Pacific Market Attractiveness Analysis by Classification
  • Figure 58: South Asia and Pacific Market Value Share and BPS Analysis by Application, 2025 and 2035
  • Figure 59: South Asia and Pacific Market Y to o to Y Growth Comparison by Application, 2025-2035
  • Figure 60: South Asia and Pacific Market Attractiveness Analysis by Application
  • Figure 61: Middle East & Africa Market Value Share and BPS Analysis by Country, 2025 and 2035
  • Figure 62: Middle East & Africa Market Value Share and BPS Analysis by Classification , 2025 and 2035
  • Figure 63: Middle East & Africa Market Y to o to Y Growth Comparison by Classification , 2025-2035
  • Figure 64: Middle East & Africa Market Attractiveness Analysis by Classification
  • Figure 65: Middle East & Africa Market Value Share and BPS Analysis by Application, 2025 and 2035
  • Figure 66: Middle East & Africa Market Y to o to Y Growth Comparison by Application, 2025-2035
  • Figure 67: Middle East & Africa Market Attractiveness Analysis by Application
  • Figure 68: Global Market - Tier Structure Analysis
  • Figure 69: Global Market - Company Share Analysis

Frequently Asked Questions

How big is the 1,3-dibromoadamantane market in 2025?

The global 1,3-dibromoadamantane market is estimated to be valued at USD 29.7 million in 2025.

What will be the size of 1,3-dibromoadamantane market in 2035?

The market size for the 1,3-dibromoadamantane market is projected to reach USD 52.2 million by 2035.

How much will be the 1,3-dibromoadamantane market growth between 2025 and 2035?

The 1,3-dibromoadamantane market is expected to grow at a 5.8% CAGR between 2025 and 2035.

What are the key product types in the 1,3-dibromoadamantane market?

The key product types in 1,3-dibromoadamantane market are purity 98% and purity 99%.

Which application segment to contribute significant share in the 1,3-dibromoadamantane market in 2025?

In terms of application, photosensitive material segment to command 45.2% share in the 1,3-dibromoadamantane market in 2025.

Future Market Insights

1,3-Dibromoadamantane Market

Chat With MaRIA

Chat With

MaRIA

Hi There, I am MaRIA, Your Market Research Intelligence Assistant. How may I help you?